Stock splits can attract significant market attention because they change the number of outstanding shares and the nominal price per share, even though a conventional stock split does not directly change the underlying intrinsic value of the company. For traders, however, a stock split can become an important event to monitor because changes in nominal price, trading activity, and market participation may create short-term opportunities or risks.
This project develops a Stock Split Trader Analysis System using the MarketFlow API. The system retrieves recent stock split events through the /splits-events endpoint and obtains additional ticker-level information through the /splits-details/{ticker} endpoint. The analysis covers a rolling 30-day period based on the execution date of the notebook. stock_split_trader_dashboard
The system is organized into five cells. The first cell establishes the API configuration, the second provides reusable API and parsing functions, the third retrieves and normalizes stock split events, the fourth analyzes individual tickers and calculates a Trader Score, and the fifth produces the final trader dashboard, actionable watchlist, visualization, and interpretation. stock_split_trader_dashboard stock_split_trader_dashboard
The resulting score is an event-screening score rather than a BUY/SELL signal. The system explicitly requires additional confirmation from price action, volume, support and resistance, trend, volatility, and risk management before a trading position is considered. stock_split_trader_dashboard
Cell 1 — Setup and API Configuration
The first cell prepares the Python environment and establishes the MarketFlow API connection. Requests handles API communication, Pandas manages tabular data, NumPy performs numerical calculations, Matplotlib generates the dashboard visualization, and IPython Display presents DataFrames.
The analysis period is automatically defined as the most recent 30 days using the current date. This makes the project suitable for repeated execution without manually changing the analysis dates. stock_split_trader_dashboard
For security, the API key should not be hard-coded in a publicly shared notebook. The original uploaded script contains a credential directly in the configuration, so it should be replaced with a secure environment variable or getpass() input before publication.
# CELL 1 - SETUP

import requests
import pandas as pd
import numpy as np
import matplotlib.pyplot as plt
from datetime import datetime, timedelta
from IPython.display import display

pd.set_option("display.max_columns", None)
pd.set_option("display.width", 150)

BASE_URL = "https://marketflow-all-in-one-market-finance-api.p.rapidapi.com"

RAPIDAPI_KEY = "YOUR_API_KEY"

HEADERS = {
    "x-rapidapi-key": RAPIDAPI_KEY,
    "x-rapidapi-host": "marketflow-all-in-one-market-finance-api.p.rapidapi.com"
}

# Periode analisis split
END_DATE = datetime.today()
START_DATE = END_DATE - timedelta(days=30)

START_DATE = START_DATE.strftime("%Y-%m-%d")
END_DATE = END_DATE.strftime("%Y-%m-%d")

print("Split Analysis Period :", START_DATE, "s/d", END_DATE)
The main output from this cell is the analysis window. Because the dates are generated dynamically, the system always evaluates the most recent 30-day period when executed.
Cell 2 — API Functions and Flexible Parser
The second cell creates reusable functions for communicating with the MarketFlow API. The api_get() function handles HTTP requests and errors, while extract_records() provides a flexible parser for different API response structures.
The parser supports responses returned as a direct list or nested under common keys such as data, results, items, events, splits, and records. This design reduces the dependence on one fixed JSON structure. stock_split_trader_dashboard
Two endpoint-specific functions are then created. get_split_events() retrieves stock split events, while get_split_detail() retrieves additional information for an individual ticker. stock_split_trader_dashboard
# CELL 2 - API FUNCTIONS

def api_get(endpoint, params=None):
    url = f"{BASE_URL}{endpoint}"

    try:
        r = requests.get(
            url,
            headers=HEADERS,
            params=params,
            timeout=30
        )

        r.raise_for_status()
        return r.json()

    except requests.exceptions.RequestException as e:
        print("API ERROR:", e)
        return None


def extract_records(data):
    """
    Membuat parser fleksibel jika response API berupa:
    list,
    {'data': [...]},
    {'results': [...]},
    {'items': [...]},
    dll.
    """

    if data is None:
        return []

    if isinstance(data, list):
        return data

    if isinstance(data, dict):

        common_keys = [
            "data",
            "results",
            "items",
            "events",
            "splits",
            "records"
        ]

        for key in common_keys:
            if key in data:

                if isinstance(data[key], list):
                    return data[key]

                if isinstance(data[key], dict):
                    return [data[key]]

        # fallback
        return [data]

    return []


def get_split_events(start_date, end_date, skip=0):

    data = api_get(
        "/splits-events",
        params={
            "skip": skip,
            "start_date": start_date,
            "end_date": end_date
        }
    )

    return extract_records(data)


def get_split_detail(ticker):

    data = api_get(
        f"/splits-details/{ticker}",
        params={"lang": "en"}
    )

    return extract_records(data)
This structure separates API communication from the analytical logic. As a result, the same request functions can be reused throughout the project without duplicating HTTP request code.
Cell 3 — Retrieve and Normalize Stock Split Events
The third cell retrieves stock split events for the defined 30-day period and converts the response into a Pandas DataFrame.
The code automatically searches for a ticker field among several possible names, including ticker, symbol, code, instrument, and security_code. It then creates a standardized ticker_clean field.
The cell also contains a dedicated ratio parser capable of interpreting formats such as 10:1, 10/1, and 10-for-1. If a direct split-ratio column is unavailable, the system attempts to calculate the ratio from numerator and denominator fields. stock_split_trader_dashboard
# CELL 3 - ROBUST SPLIT EVENT PARSER

import re

events = get_split_events(
    START_DATE,
    END_DATE
)

df = pd.json_normalize(events)

print("Total split events:", len(df))
print("\nRAW COLUMNS:")
print(df.columns.tolist())

if df.empty:
    print("Tidak ada split event.")
else:

    # ========================================================
    # 1. REMOVE DUPLICATE COLUMNS
    # ========================================================

    df = df.loc[:, ~df.columns.duplicated()].copy()


    # ========================================================
    # 2. FIND TICKER COLUMN
    # ========================================================

    ticker_candidates = [
        "ticker",
        "symbol",
        "code",
        "instrument",
        "security_code"
    ]

    ticker_col = None

    for candidate in ticker_candidates:
        if candidate in df.columns:
            ticker_col = candidate
            break

    if ticker_col is None:
        for col in df.columns:
            c = str(col).lower()

            if (
                "ticker" in c
                or "symbol" in c
            ):
                ticker_col = col
                break


    if ticker_col is not None:
        df["ticker_clean"] = (
            df[ticker_col]
            .astype(str)
            .str.strip()
        )

    else:
        raise ValueError(
            "Ticker column tidak ditemukan."
        )


    # ========================================================
    # 3. FUNCTION PARSE RATIO TEXT
    # ========================================================

    def parse_ratio_text(value):

        if pd.isna(value):
            return np.nan

        text = str(value).strip()

        # contoh:
        # 10:1
        # 10/1
        # 10-for-1
        # 1 for 10

        patterns = [
            r"([\d.]+)\s*:\s*([\d.]+)",
            r"([\d.]+)\s*/\s*([\d.]+)",
            r"([\d.]+)\s*[- ]?for[- ]?\s*([\d.]+)"
        ]

        for pattern in patterns:

            match = re.search(
                pattern,
                text,
                flags=re.IGNORECASE
            )

            if match:

                a = float(match.group(1))
                b = float(match.group(2))

                if b != 0:
                    return a / b

        # single numeric
        try:
            return float(text)

        except:
            return np.nan


    # ========================================================
    # 4. FIND DIRECT RATIO COLUMN
    # ========================================================

    ratio_col = None

    ratio_keywords = [
        "split_ratio",
        "splitratio",
        "ratio",
        "split ratio"
    ]

    for col in df.columns:

        c = str(col).lower()

        if any(
            keyword == c
            or keyword in c
            for keyword in ratio_keywords
        ):
            ratio_col = col
            break


    # ========================================================
    # 5. TRY NUMERATOR / DENOMINATOR
    # ========================================================

    numerator_col = None
    denominator_col = None

    numerator_keywords = [
        "numerator",
        "new_shares",
        "split_to",
        "to_factor",
        "new"
    ]

    denominator_keywords = [
        "denominator",
        "old_shares",
        "split_from",
        "from_factor",
        "old"
    ]


    for col in df.columns:

        c = str(col).lower()

        if numerator_col is None:

            if any(
                x == c or x in c
                for x in numerator_keywords
            ):
                numerator_col = col

        if denominator_col is None:

            if any(
                x == c or x in c
                for x in denominator_keywords
            ):
                denominator_col = col


    # ========================================================
    # 6. CALCULATE SPLIT RATIO
    # ========================================================

    df["split_ratio"] = np.nan


    # Method A: direct ratio
    if ratio_col is not None:

        print(
            "Ratio column detected:",
            ratio_col
        )

        df["split_ratio"] = (
            df[ratio_col]
            .apply(parse_ratio_text)
        )


    # Method B: numerator / denominator
    if (
        df["split_ratio"].isna().all()
        and numerator_col is not None
        and denominator_col is not None
    ):

        print(
            "Using numerator:",
            numerator_col
        )

        print(
            "Using denominator:",
            denominator_col
        )

        num = pd.to_numeric(
            df[numerator_col],
            errors="coerce"
        )

        den = pd.to_numeric(
            df[denominator_col],
            errors="coerce"
        )

        df["split_ratio"] = (
            num / den.replace(0, np.nan)
        )


    # ========================================================
    # 7. SPLIT CLASSIFICATION
    # ========================================================

    def classify_split(ratio):

        if pd.isna(ratio):
            return "UNKNOWN"

        elif ratio > 1:
            return "STOCK SPLIT"

        elif ratio < 1:
            return "REVERSE SPLIT"

        else:
            return "NO CHANGE"


    df["split_type"] = (
        df["split_ratio"]
        .apply(classify_split)
    )


    # ========================================================
    # 8. DISPLAY IMPORTANT DATA
    # ========================================================

    print("\nPARSED SPLIT DATA:")

    display(
        df[
            [
                "ticker_clean",
                "split_ratio",
                "split_type"
            ]
        ].head(30)
    )
The classification logic is straightforward:
\[ Split\ Ratio > 1 \Rightarrow Stock\ Split \]\[ Split\ Ratio < 1 \Rightarrow Reverse\ Split \]\[ Split\ Ratio = 1 \Rightarrow No\ Change \]
This step is essential because the subsequent Trader Score uses the split ratio as one of its main scoring variables.
Cell 4 — Ticker-Level Analysis and Trader Score
The fourth cell performs the main trader-oriented analysis. For each unique ticker, the system requests additional split details and attempts to extract three key variables: price, volume, and market capitalization. stock_split_trader_dashboard
The system starts each ticker with a base score of 50. It then adjusts the score according to split ratio, price, volume, and data completeness. Larger forward split ratios receive higher scores, while extreme reverse splits receive negative adjustments. Price and volume provide additional context for trading activity. stock_split_trader_dashboard
# CELL 4 - SPLIT TRADER ANALYSIS
# Compatible with robust Cell 3

def find_numeric_value(row, keywords):

    for col in row.index:

        name = str(col).lower()

        if any(
            keyword in name
            for keyword in keywords
        ):

            try:

                value = row[col]

                # duplicate / nested handling
                if isinstance(value, pd.Series):

                    value = pd.to_numeric(
                        value,
                        errors="coerce"
                    ).dropna()

                    if len(value) > 0:
                        return float(value.iloc[0])

                else:

                    value = pd.to_numeric(
                        value,
                        errors="coerce"
                    )

                    if pd.notna(value):
                        return float(value)

            except:
                continue

    return np.nan


# ============================================================
# TICKER LIST
# ============================================================

tickers = (
    df["ticker_clean"]
    .dropna()
    .astype(str)
    .str.strip()
)

tickers = tickers[
    (tickers != "")
    & (tickers.str.lower() != "nan")
]

tickers = tickers.unique()[:30]

print("Total tickers:", len(tickers))


results = []


# ============================================================
# ANALYSIS LOOP
# ============================================================

for ticker in tickers:

    print("Analyzing:", ticker)

    try:

        detail = get_split_detail(ticker)

        detail_df = pd.json_normalize(
            detail
        )

        price = np.nan
        volume = np.nan
        market_cap = np.nan


        # ====================================================
        # DETAIL API PARSER
        # ====================================================

        if not detail_df.empty:

            detail_df = (
                detail_df
                .loc[
                    :,
                    ~detail_df.columns.duplicated()
                ]
            )

            row = detail_df.iloc[0]


            price = find_numeric_value(
                row,
                [
                    "price",
                    "close",
                    "last"
                ]
            )


            volume = find_numeric_value(
                row,
                [
                    "volume",
                    "avg_volume",
                    "average_volume"
                ]
            )


            market_cap = find_numeric_value(
                row,
                [
                    "market_cap",
                    "marketcap",
                    "market cap"
                ]
            )


        # ====================================================
        # EVENT INFORMATION
        # ====================================================

        event = df[
            df["ticker_clean"].astype(str)
            == str(ticker)
        ]


        if not event.empty:

            ratio = pd.to_numeric(
                event.iloc[0]["split_ratio"],
                errors="coerce"
            )

            split_type = (
                event.iloc[0]["split_type"]
            )

        else:

            ratio = np.nan
            split_type = "UNKNOWN"


        # ====================================================
        # EVENT SCORE
        # ====================================================

        score = 50


        # ---------- SPLIT FACTOR ----------

        if pd.notna(ratio):

            if ratio >= 10:
                score += 25

            elif ratio >= 4:
                score += 20

            elif ratio >= 2:
                score += 15

            elif ratio > 1:
                score += 8


            elif ratio <= 0.10:
                score -= 30

            elif ratio <= 0.25:
                score -= 25

            elif ratio < 1:
                score -= 15


        # ---------- PRICE ----------

        if pd.notna(price):

            if price < 1:

                score -= 15

            elif price < 5:

                score -= 5

            elif price >= 10:

                score += 5


        # ---------- VOLUME ----------

        if pd.notna(volume):

            if volume >= 10_000_000:

                score += 20

            elif volume >= 5_000_000:

                score += 15

            elif volume >= 1_000_000:

                score += 10

            elif volume < 100_000:

                score -= 10


        # ====================================================
        # DATA QUALITY PENALTY
        # ====================================================

        missing = 0

        if pd.isna(ratio):
            missing += 1

        if pd.isna(volume):
            missing += 1

        if pd.isna(price):
            missing += 1


        # jangan memberikan confidence tinggi
        # jika data utama hilang

        if missing >= 2:
            score -= 10


        score = int(
            max(
                0,
                min(100, score)
            )
        )


        # ====================================================
        # SIGNAL
        # ====================================================

        if pd.isna(ratio):

            signal = "INSUFFICIENT DATA"

        elif score >= 75:

            signal = "HIGH WATCH"

        elif score >= 60:

            signal = "WATCH"

        elif score >= 40:

            signal = "NEUTRAL"

        else:

            signal = "HIGH RISK"


        # ====================================================
        # RESULT
        # ====================================================

        results.append(
            {

                "Ticker": ticker,

                "Price": price,

                "Volume": volume,

                "Market Cap": market_cap,

                "Split Ratio": ratio,

                "Split Type": split_type,

                "Trader Score": score,

                "Signal": signal

            }
        )


    except Exception as e:

        print(
            f"Error {ticker}: {e}"
        )


# ============================================================
# FINAL DATAFRAME
# ============================================================

trader_df = pd.DataFrame(results)


if not trader_df.empty:

    trader_df = (
        trader_df
        .sort_values(
            [
                "Trader Score",
                "Ticker"
            ],
            ascending=[
                False,
                True
            ]
        )
        .reset_index(drop=True)
    )


    display(
        trader_df.style.background_gradient(
            subset=[
                "Trader Score"
            ],
            cmap="RdYlGn"
        )
    )

else:

    print(
        "Tidak ada data yang dapat dianalisis."
    )
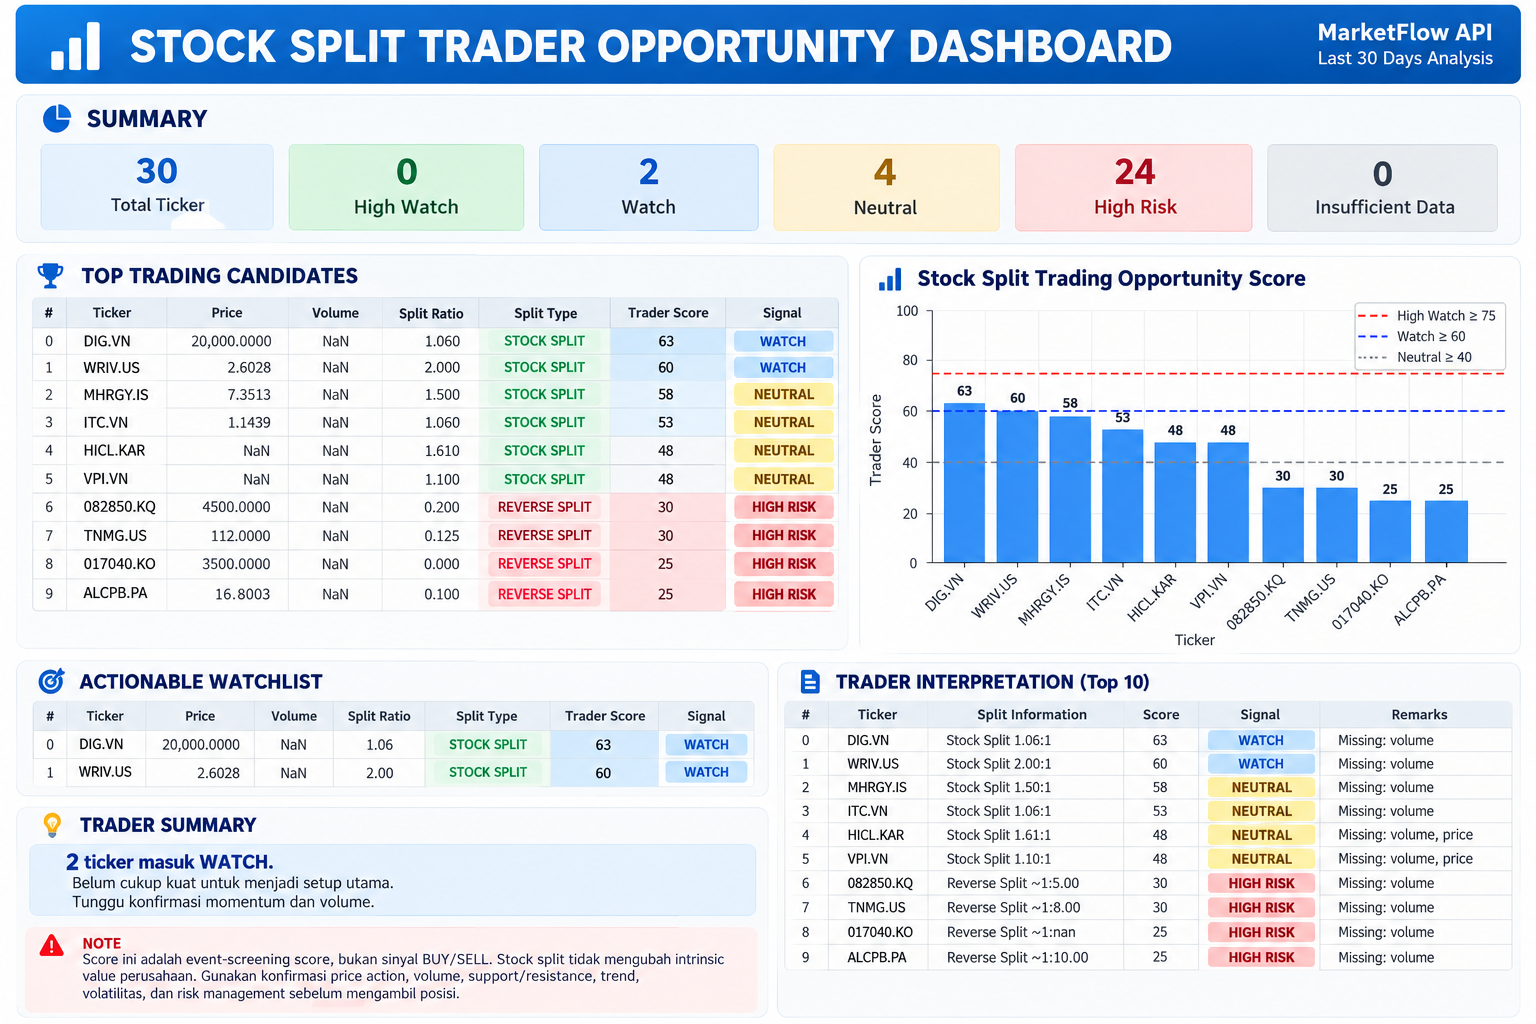
The Trader Score is intentionally bounded between 0 and 100. The signal thresholds are defined as follows: 75 or higher = HIGH WATCH, 60–74 = WATCH, 40–59 = NEUTRAL, and below 40 = HIGH RISK. Missing split-ratio information results in an INSUFFICIENT DATA classification. stock_split_trader_dashboard
This scoring system should not be interpreted as a statistically validated probability model. It is a rule-based screening framework that combines the event characteristics and available market information.
Cell 5 — Stock Split Trader Opportunity Dashboard
The fifth cell converts the calculated scores into a final trader dashboard. It groups the tickers according to their signals, displays the top trading candidates, isolates the actionable watchlist, and creates a bar chart showing the Trader Score for the highest-ranked tickers. stock_split_trader_dashboard
# CELL 5 - TRADER DASHBOARD

if trader_df.empty:

    print("Tidak ada data untuk dashboard.")

else:

    print("=" * 70)
    print("          STOCK SPLIT TRADER OPPORTUNITY DASHBOARD")
    print("=" * 70)

    # =========================================================
    # SIGNAL GROUPING
    # =========================================================

    high_watch = trader_df[
        trader_df["Signal"] == "HIGH WATCH"
    ]

    watch = trader_df[
        trader_df["Signal"] == "WATCH"
    ]

    neutral = trader_df[
        trader_df["Signal"] == "NEUTRAL"
    ]

    risky = trader_df[
        trader_df["Signal"] == "HIGH RISK"
    ]

    insufficient = trader_df[
        trader_df["Signal"] == "INSUFFICIENT DATA"
    ]


    # =========================================================
    # SUMMARY
    # =========================================================

    print("\nSUMMARY")
    print("-" * 35)

    print("Total Ticker       :", len(trader_df))
    print("High Watch         :", len(high_watch))
    print("Watch              :", len(watch))
    print("Neutral            :", len(neutral))
    print("High Risk          :", len(risky))
    print("Insufficient Data  :", len(insufficient))


    # =========================================================
    # TOP TRADING CANDIDATES
    # =========================================================

    print("\nTOP TRADING CANDIDATES")
    print("-" * 70)

    display(
        trader_df[
            [
                "Ticker",
                "Price",
                "Volume",
                "Split Ratio",
                "Split Type",
                "Trader Score",
                "Signal"
            ]
        ].head(10)
    )


    # =========================================================
    # ACTIONABLE CANDIDATES ONLY
    # =========================================================

    actionable = trader_df[
        trader_df["Signal"].isin(
            [
                "HIGH WATCH",
                "WATCH"
            ]
        )
    ]

    print("\nACTIONABLE WATCHLIST")
    print("-" * 70)

    if actionable.empty:

        print(
            "Belum ada ticker dengan signal "
            "HIGH WATCH atau WATCH."
        )

    else:

        display(
            actionable[
                [
                    "Ticker",
                    "Price",
                    "Volume",
                    "Split Ratio",
                    "Split Type",
                    "Trader Score",
                    "Signal"
                ]
            ]
        )


    # =========================================================
    # BAR CHART
    # =========================================================

    top = trader_df.head(15).copy()

    plt.figure(figsize=(12, 6))

    plt.bar(
        top["Ticker"],
        top["Trader Score"]
    )

    # Threshold sesuai Cell 4
    plt.axhline(
        75,
        linestyle="--",
        label="High Watch ≥ 75"
    )

    plt.axhline(
        60,
        linestyle="--",
        label="Watch ≥ 60"
    )

    plt.axhline(
        40,
        linestyle=":",
        label="Neutral ≥ 40"
    )

    plt.title(
        "Stock Split Trading Opportunity Score"
    )

    plt.xlabel("Ticker")
    plt.ylabel("Trader Score")

    plt.ylim(0, 100)

    plt.xticks(
        rotation=45,
        ha="right"
    )

    plt.legend()

    plt.grid(
        axis="y",
        alpha=0.3
    )

    plt.tight_layout()
    plt.show()


    # =========================================================
    # TRADER INTERPRETATION
    # =========================================================

    print("\nTRADER INTERPRETATION")
    print("-" * 100)

    for _, r in trader_df.head(10).iterrows():

        ratio = r["Split Ratio"]

        # -----------------------------------------------------
        # Split description
        # -----------------------------------------------------

        if pd.isna(ratio):

            split_txt = "Split ratio unavailable"

        elif ratio > 1:

            split_txt = (
                f"Stock Split {ratio:.2f}:1"
            )

        elif ratio < 1:

            reverse_ratio = (
                1 / ratio
                if ratio > 0
                else np.nan
            )

            split_txt = (
                f"Reverse Split ~1:{reverse_ratio:.2f}"
            )

        else:

            split_txt = "No effective split"


        # -----------------------------------------------------
        # Data quality description
        # -----------------------------------------------------

        missing_fields = []

        if pd.isna(r["Split Ratio"]):
            missing_fields.append("ratio")

        if pd.isna(r["Volume"]):
            missing_fields.append("volume")

        if pd.isna(r["Price"]):
            missing_fields.append("price")


        if missing_fields:

            quality_txt = (
                "Missing: "
                + ", ".join(missing_fields)
            )

        else:

            quality_txt = "Data OK"


        print(
            f"{r['Ticker']:12} | "
            f"{split_txt:28} | "
            f"Score {r['Trader Score']:3.0f} | "
            f"{r['Signal']:18} | "
            f"{quality_txt}"
        )


    # =========================================================
    # FINAL TRADER SUMMARY
    # =========================================================

    print("\n" + "=" * 70)
    print("TRADER SUMMARY")
    print("=" * 70)

    if len(high_watch) > 0:

        print(
            f"{len(high_watch)} ticker masuk HIGH WATCH."
        )

        print(
            "Prioritaskan validasi price action, "
            "relative volume, breakout level, "
            "dan risk/reward sebelum entry."
        )


    elif len(watch) > 0:

        print(
            f"{len(watch)} ticker masuk WATCH."
        )

        print(
            "Belum cukup kuat untuk menjadi setup utama. "
            "Tunggu konfirmasi momentum dan volume."
        )


    else:

        print(
            "Belum ada kandidat dengan score ≥ 60."
        )


    if len(insufficient) > 0:

        print(
            f"\nWarning: {len(insufficient)} ticker memiliki "
            "data yang belum lengkap."
        )

        print(
            "Ticker dengan status INSUFFICIENT DATA "
            "tidak boleh dipakai sebagai dasar entry."
        )


    print("\nNOTE:")
    print(
        "Score ini adalah event-screening score, bukan sinyal BUY/SELL. "
        "Stock split tidak mengubah intrinsic value perusahaan. "
        "Gunakan konfirmasi price action, volume, support/resistance, "
        "trend, volatilitas, dan risk management sebelum mengambil posisi."
    )
The dashboard separates candidates into HIGH WATCH, WATCH, NEUTRAL, HIGH RISK, and INSUFFICIENT DATA categories. It also creates an actionable watchlist containing only HIGH WATCH and WATCH candidates. stock_split_trader_dashboard
The bar chart uses the same score thresholds defined in Cell 4, allowing the user to visually compare the relative attractiveness of the screened tickers. stock_split_trader_dashboard
The final interpretation also emphasizes an important limitation: a high Trader Score does not mean that a stock should automatically be bought. The uploaded project explicitly states that the score is an event-screening score, while stock splits themselves do not change the intrinsic value of a company. stock_split_trader_dashboard
Result:
Conclusion
The Stock Split Trader Analysis System provides a structured framework for screening recent stock split events using MarketFlow API data. The system automatically defines a rolling 30-day analysis period, retrieves stock split events, normalizes different API response structures, identifies stock and reverse split ratios, retrieves additional ticker-level information, and converts these variables into a standardized Trader Score.
The scoring framework combines the split ratio, stock price, trading volume, and data completeness. Large forward splits receive positive adjustments, while extreme reverse splits receive negative adjustments. Higher trading volume also increases the score because it provides stronger evidence of market activity, while incomplete data reduce confidence in the resulting classification. stock_split_trader_dashboard
The final dashboard ranks stocks into HIGH WATCH, WATCH, NEUTRAL, HIGH RISK, and INSUFFICIENT DATA categories. This provides a practical starting point for constructing a stock-split watchlist and identifying events that deserve further technical investigation. However, the score remains a rule-based screening mechanism, not a statistically validated prediction model or an automatic trading signal.
Therefore, a ticker classified as HIGH WATCH should not be interpreted as an immediate BUY recommendation. Traders should validate the setup using price structure, relative volume, breakout levels, support and resistance, trend direction, volatility, and risk-to-reward before taking a position. The distinction is particularly important because a stock split changes the share structure and nominal price but does not, by itself, create additional intrinsic economic value for the company. stock_split_trader_dashboard