
Gold is one of the most actively monitored financial instruments because its price can change rapidly in response to market conditions. To analyze these movements systematically, traders can combine historical price data with technical indicators and market-structure information.
This project develops an XAUUSD Trader Insight Dashboard using the MarketFlow API. The system retrieves daily XAUUSD price data, processes OHLC information, calculates technical indicators, identifies support and resistance levels, evaluates volatility, retrieves dividend-event data, and generates an automated trader insight.
The analysis uses OANDA as the selected instrument. The price-data module requests the latest 100 daily observations using the Asia/Jakarta timezone. The resulting dataset is standardized into a structured DataFrame before being used for technical analysis.
Cell 1 — Import Library and API Configuration
The first cell prepares the Python environment and establishes the MarketFlow API configuration. Requests is used for API communication, Pandas for data processing, NumPy for numerical calculations, and Matplotlib for visualization.
The selected instrument is OANDA:XAUUSD. The API key is required for authentication.
# ==============================
# CELL 1
# IMPORT & API CONFIGURATION
# ==============================

import requests
import pandas as pd
import numpy as np
import matplotlib.pyplot as plt


# ==============================
# RAPIDAPI CONFIG
# ==============================

API_KEY = "YOUR_API_KEY"

HOST = "marketflow-all-in-one-market-finance-api.p.rapidapi.com"

BASE_URL = "https://marketflow-all-in-one-market-finance-api.p.rapidapi.com"


headers = {
    "x-rapidapi-key": API_KEY,
    "x-rapidapi-host": HOST
}


SYMBOL = "OANDA:XAUUSD"


print("Konfigurasi API siap.")
print("Symbol:", SYMBOL)
The source file defines the same MarketFlow host, API configuration, and XAUUSD symbol.
Cell 2 — Retrieve and Process XAUUSD Price Data
The second cell retrieves daily XAUUSD price data through the /v2/chart/price endpoint. The request uses a range of 100 observations, daily timeframe, and Asia/Jakarta timezone.
Because API responses can have different JSON structures, the code uses a flexible recursive extractor to search for price records under keys such as data, result, results, prices, candles, chart, and items.
The OHLC data is then standardized. Short column names such as o, h, l, c, and v are converted into open, high, low, close, and volume. The code also automatically detects the available datetime field and converts Unix timestamps or date strings into a standardized datetime column.
# ==============================
# CELL 2
# GET XAUUSD PRICE DATA
# ==============================

url_price = f"{BASE_URL}/v2/chart/price"


params_price = {
    "range": 100,
    "timeframe": "D",
    "timezone": "Asia/Jakarta",
    "symbol": SYMBOL
}


response = requests.get(
    url_price,
    headers=headers,
    params=params_price,
    timeout=30
)


response.raise_for_status()

data_price = response.json()


print("HTTP Status:", response.status_code)


# ============================================================
# FLEXIBLE JSON EXTRACTOR
# ============================================================

def extract_records(obj):

    if isinstance(obj, list):

        if len(obj) > 0 and isinstance(obj[0], dict):
            return obj

        return []


    if isinstance(obj, dict):

        priority_keys = [
            "data",
            "result",
            "results",
            "prices",
            "candles",
            "chart",
            "items"
        ]


        for key in priority_keys:

            if key in obj:

                result = extract_records(
                    obj[key]
                )

                if result:
                    return result


        for value in obj.values():

            result = extract_records(value)

            if result:
                return result


    return []


records = extract_records(data_price)


if not records:

    print("\nRaw JSON:")
    print(data_price)

    raise ValueError(
        "Tidak ditemukan data harga berbentuk list of dictionaries."
    )


# ============================================================
# CONVERT TO DATAFRAME
# ============================================================

df = pd.DataFrame(records)


df.columns = [
    str(c)
    .lower()
    .strip()
    .replace(" ", "_")
    for c in df.columns
]


# ============================================================
# RENAME OHLC
# ============================================================

ohlc_mapping = {
    "o": "open",
    "h": "high",
    "l": "low",
    "c": "close",
    "v": "volume"
}


for old_col, new_col in ohlc_mapping.items():

    if (
        old_col in df.columns
        and new_col not in df.columns
    ):

        df = df.rename(
            columns={
                old_col: new_col
            }
        )


# ============================================================
# DETECT DATETIME
# ============================================================

possible_datetime_cols = [
    "datetime",
    "timestamp",
    "time",
    "date",
    "t"
]


available_datetime_cols = [
    col
    for col in possible_datetime_cols
    if col in df.columns
]


if len(available_datetime_cols) == 0:

    print(
        "\nWARNING: Tidak ditemukan kolom waktu."
    )

else:

    selected_datetime_col = (
        available_datetime_cols[0]
    )

    dt_raw = df[
        selected_datetime_col
    ].copy()


    numeric_dt = pd.to_numeric(
        dt_raw,
        errors="coerce"
    )


    numeric_ratio = (
        numeric_dt.notna().mean()
    )


    if numeric_ratio > 0.8:

        median_ts = (
            numeric_dt.dropna().median()
        )


        if median_ts > 1e11:

            df["datetime_clean"] = (
                pd.to_datetime(
                    numeric_dt,
                    unit="ms",
                    errors="coerce"
                )
            )


        elif median_ts > 1e9:

            df["datetime_clean"] = (
                pd.to_datetime(
                    numeric_dt,
                    unit="s",
                    errors="coerce"
                )
            )


        else:

            df["datetime_clean"] = (
                pd.to_datetime(
                    dt_raw,
                    errors="coerce"
                )
            )


    else:

        df["datetime_clean"] = (
            pd.to_datetime(
                dt_raw,
                errors="coerce"
            )
        )


    cols_to_remove = [
        col
        for col in available_datetime_cols
        if col in df.columns
    ]


    df = df.drop(
        columns=cols_to_remove,
        errors="ignore"
    )


    df = df.rename(
        columns={
            "datetime_clean": "datetime"
        }
    )


# ============================================================
# NUMERIC CONVERSION
# ============================================================

numeric_cols = [
    "open",
    "high",
    "low",
    "close",
    "volume"
]


for col in numeric_cols:

    if col in df.columns:

        df[col] = pd.to_numeric(
            df[col],
            errors="coerce"
        )


# ============================================================
# VALIDATION
# ============================================================

if "close" not in df.columns:

    raise ValueError(
        "Kolom CLOSE tidak ditemukan pada response API."
    )


df = df.dropna(
    subset=["close"]
).copy()


# ============================================================
# SORTING
# ============================================================

if "datetime" in df.columns:

    df = df.dropna(
        subset=["datetime"]
    )

    df = df.sort_values(
        "datetime"
    )


df = df.reset_index(
    drop=True
)


print("\nDATA XAUUSD BERHASIL DIPROSES")

print(
    "Kolom final:",
    df.columns.tolist()
)

print(
    "Jumlah data:",
    len(df)
)


if "datetime" in df.columns:

    print(
        "Periode:",
        df["datetime"].min(),
        "s/d",
        df["datetime"].max()
    )


display(
    df.tail()
)
Cell 3 — Technical Indicators and Market Structure
The third cell performs the main technical analysis.
The system calculates:
MA20 for the 20-period moving average
MA50 for the 50-period moving average
Daily Return for daily percentage price changes
RSI14 for momentum analysis
Volatility20 for 20-period volatility
Support20 for the 20-period support level
Resistance20 for the 20-period resistance level
Distance_MA20_% for the distance between price and MA20
Distance_MA50_% for the distance between price and MA50
The trend is classified into three conditions. A bullish condition occurs when price is above MA20 and MA20 is above MA50. A bearish condition occurs when price is below MA20 and MA20 is below MA50. Other conditions are classified as sideways or transition.
# ==============================
# CELL 3
# TECHNICAL ANALYSIS
# ==============================

if len(df) < 20:

    raise ValueError(
        "Data terlalu sedikit untuk technical analysis."
    )


# Moving Average

df["MA20"] = (
    df["close"]
    .rolling(20)
    .mean()
)


df["MA50"] = (
    df["close"]
    .rolling(50)
    .mean()
)


# Daily Return

df["daily_return"] = (
    df["close"].pct_change()
    * 100
)


# RSI 14

delta = df["close"].diff()


gain = delta.clip(
    lower=0
)


loss = -delta.clip(
    upper=0
)


avg_gain = gain.ewm(
    alpha=1/14,
    adjust=False,
    min_periods=14
).mean()


avg_loss = loss.ewm(
    alpha=1/14,
    adjust=False,
    min_periods=14
).mean()


rs = avg_gain / avg_loss


df["RSI14"] = (
    100
    - (100 / (1 + rs))
)


# Volatility 20 Days

df["Volatility20"] = (
    df["daily_return"]
    .rolling(20)
    .std()
)


# Support

if "low" in df.columns:

    df["Support20"] = (
        df["low"]
        .rolling(20)
        .min()
    )

else:

    df["Support20"] = (
        df["close"]
        .rolling(20)
        .min()
    )


# Resistance

if "high" in df.columns:

    df["Resistance20"] = (
        df["high"]
        .rolling(20)
        .max()
    )

else:

    df["Resistance20"] = (
        df["close"]
        .rolling(20)
        .max()
    )


# Distance terhadap MA

df["Distance_MA20_%"] = (
    (
        df["close"]
        - df["MA20"]
    )
    / df["MA20"]
    * 100
)


df["Distance_MA50_%"] = (
    (
        df["close"]
        - df["MA50"]
    )
    / df["MA50"]
    * 100
)


# Trend Classification

def classify_trend(row):

    if (
        pd.isna(row["MA20"])
        or pd.isna(row["MA50"])
    ):

        return "Belum cukup data"


    if (
        row["close"] > row["MA20"]
        and row["MA20"] > row["MA50"]
    ):

        return "Bullish"


    elif (
        row["close"] < row["MA20"]
        and row["MA20"] < row["MA50"]
    ):

        return "Bearish"


    else:

        return "Sideways / Transition"


df["Trend"] = df.apply(
    classify_trend,
    axis=1
)


display(
    df[
        [
            "datetime",
            "close",
            "MA20",
            "MA50",
            "RSI14",
            "Volatility20",
            "Support20",
            "Resistance20",
            "Trend"
        ]
    ].tail(15)
)
Cell 4 — Dividend Events
The fourth cell retrieves dividend-event data for the period November 2–9, 2025.
Dividend events are processed separately from XAUUSD price data. The code converts nested objects into strings to avoid DataFrame processing errors and removes duplicate records.
Importantly, the source code does not treat dividend events as a direct XAUUSD price signal. Instead, the events are used as a market-activity calendar indicator.
# ==============================
# CELL 4
# DIVIDEND EVENTS
# ==============================

url_dividend = (
    f"{BASE_URL}/dividens-events"
)


params_dividend = {
    "skip": 0,
    "start_date": "2025-11-02",
    "end_date": "2025-11-09"
}


response_div = requests.get(
    url_dividend,
    headers=headers,
    params=params_dividend,
    timeout=30
)


response_div.raise_for_status()


data_div = response_div.json()


div_records = extract_records(
    data_div
)


if div_records:

    df_dividend = pd.DataFrame(
        div_records
    )


    df_dividend.columns = [
        str(c)
        .lower()
        .strip()
        .replace(" ", "_")
        for c in df_dividend.columns
    ]


    for col in df_dividend.columns:

        if df_dividend[col].apply(
            lambda x:
            isinstance(x, (dict, list))
        ).any():

            df_dividend[col] = (
                df_dividend[col]
                .astype(str)
            )


    df_dividend = (
        df_dividend
        .astype(str)
        .drop_duplicates()
        .reset_index(drop=True)
    )


    print(
        "Jumlah Dividend Events:",
        len(df_dividend)
    )


    print(
        "\nKolom tersedia:"
    )

    print(
        df_dividend.columns.tolist()
    )


    display(
        df_dividend.head(20)
    )


else:

    df_dividend = pd.DataFrame()


    print(
        "Tidak ada dividend event "
        "atau format response berbeda."
    )

    print(data_div)
Cell 5 — XAUUSD Trader Insight Dashboard
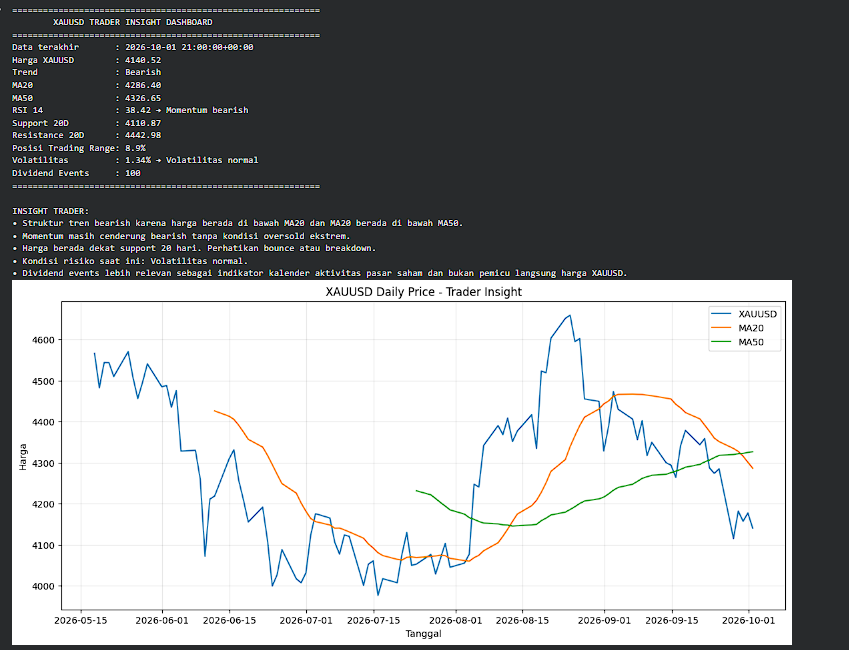
The fifth cell combines the latest XAUUSD price with the technical indicators calculated previously.
The dashboard evaluates:
Latest XAUUSD price
Trend
MA20
MA50
RSI14
Support 20D
Resistance 20D
Position within the 20-day trading range
Volatility
Dividend-event count
The RSI interpretation is divided into five conditions: overbought, oversold, bullish momentum, bearish momentum, and neutral momentum.
The system also compares the latest volatility with historical median volatility. Volatility above 1.3 times the median is classified as high, while volatility below 0.7 times the median is classified as low.
# ==============================
# CELL 5
# TRADER INSIGHT
# ==============================

latest = df.iloc[-1]


close = latest["close"]

ma20 = latest["MA20"]

ma50 = latest["MA50"]

rsi = latest["RSI14"]

volatility = latest["Volatility20"]


support = latest["Support20"]

resistance = latest["Resistance20"]

trend = latest["Trend"]


# RSI Interpretation

if pd.isna(rsi):

    rsi_signal = "Data belum cukup"


elif rsi >= 70:

    rsi_signal = "Overbought"


elif rsi <= 30:

    rsi_signal = "Oversold"


elif rsi >= 55:

    rsi_signal = "Momentum bullish"


elif rsi <= 45:

    rsi_signal = "Momentum bearish"


else:

    rsi_signal = "Momentum netral"


# Trading Range Position

if (
    pd.notna(support)
    and pd.notna(resistance)
    and resistance != support
):

    range_position = (
        (close - support)
        / (resistance - support)
        * 100
    )

else:

    range_position = np.nan


# Risk Interpretation

historical_vol = (
    df["Volatility20"]
    .dropna()
)


if (
    pd.notna(volatility)
    and len(historical_vol) > 10
):

    median_vol = (
        historical_vol.median()
    )


    if volatility > median_vol * 1.3:

        risk = "Volatilitas tinggi"


    elif volatility < median_vol * 0.7:

        risk = "Volatilitas rendah"


    else:

        risk = "Volatilitas normal"

else:

    risk = "Belum cukup data"


# Dashboard

print("=" * 60)

print(
    "        XAUUSD TRADER INSIGHT DASHBOARD"
)

print("=" * 60)


if "datetime" in df.columns:

    print(
        f"Data terakhir       : "
        f"{latest['datetime']}"
    )


print(
    f"Harga XAUUSD        : "
    f"{close:.2f}"
)


print(
    f"Trend               : "
    f"{trend}"
)


print(
    f"MA20                : "
    f"{ma20:.2f}"
    if pd.notna(ma20)
    else "MA20                : N/A"
)


print(
    f"MA50                : "
    f"{ma50:.2f}"
    if pd.notna(ma50)
    else "MA50                : N/A"
)


print(
    f"RSI 14              : "
    f"{rsi:.2f} → {rsi_signal}"
    if pd.notna(rsi)
    else "RSI 14              : N/A"
)


print(
    f"Support 20D         : "
    f"{support:.2f}"
)


print(
    f"Resistance 20D      : "
    f"{resistance:.2f}"
)


if pd.notna(range_position):

    print(
        f"Posisi Trading Range: "
        f"{range_position:.1f}%"
    )


print(
    f"Volatilitas         : "
    f"{volatility:.2f}% → {risk}"
    if pd.notna(volatility)
    else "Volatilitas         : N/A"
)


print(
    f"Dividend Events     : "
    f"{len(df_dividend)}"
)


print("=" * 60)


# ==============================
# AUTOMATIC MARKET INTERPRETATION
# ==============================

print("\nINSIGHT TRADER:")


if trend == "Bullish":

    print(
        "• Struktur tren bullish karena harga "
        "berada di atas MA20 dan MA20 berada "
        "di atas MA50."
    )


elif trend == "Bearish":

    print(
        "• Struktur tren bearish karena harga "
        "berada di bawah MA20 dan MA20 berada "
        "di bawah MA50."
    )


else:

    print(
        "• Pasar sedang sideways atau berada "
        "dalam fase transisi tren."
    )


if rsi_signal == "Overbought":

    print(
        "• RSI menunjukkan kondisi overbought. "
        "Momentum naik kuat, tetapi risiko "
        "pullback meningkat."
    )


elif rsi_signal == "Oversold":

    print(
        "• RSI menunjukkan kondisi oversold. "
        "Tekanan jual kuat, tetapi peluang "
        "technical rebound meningkat."
    )


elif rsi_signal == "Momentum bullish":

    print(
        "• Momentum masih cenderung bullish "
        "tanpa kondisi overbought ekstrem."
    )


elif rsi_signal == "Momentum bearish":

    print(
        "• Momentum masih cenderung bearish "
        "tanpa kondisi oversold ekstrem."
    )


if pd.notna(range_position):

    if range_position >= 80:

        print(
            "• Harga berada dekat resistance "
            "20 hari. Perhatikan breakout "
            "atau rejection."
        )


    elif range_position <= 20:

        print(
            "• Harga berada dekat support "
            "20 hari. Perhatikan bounce "
            "atau breakdown."
        )


    else:

        print(
            "• Harga masih berada di tengah "
            "range support-resistance."
        )


print(
    f"• Kondisi risiko saat ini: {risk}."
)


print(
    "• Dividend events lebih relevan sebagai "
    "indikator kalender aktivitas pasar saham "
    "dan bukan pemicu langsung harga XAUUSD."
)
The source file then generates a daily XAUUSD price chart together with MA20 and MA50. This visualization allows the price trend to be compared directly with the two moving-average levels.
# ==============================
# PRICE CHART
# ==============================

plt.figure(
    figsize=(14, 6)
)


plt.plot(
    df["datetime"],
    df["close"],
    label="XAUUSD"
)


plt.plot(
    df["datetime"],
    df["MA20"],
    label="MA20"
)


plt.plot(
    df["datetime"],
    df["MA50"],
    label="MA50"
)


plt.title(
    "XAUUSD Daily Price - Trader Insight"
)


plt.xlabel("Tanggal")

plt.ylabel("Harga")


plt.legend()

plt.grid(alpha=0.3)

plt.show()
Result:
Conclusion
This project develops an XAUUSD Trader Insight Dashboard using MarketFlow API data and a combination of technical indicators and market-structure analysis.
The system first retrieves and standardizes daily XAUUSD price data. It then calculates MA20, MA50, daily return, RSI14, 20-day volatility, support, resistance, and the distance between price and moving averages. These variables are used to classify the current market structure into bullish, bearish, or sideways/transition conditions.
The dashboard further evaluates RSI momentum, price position within the 20-day trading range, and current volatility relative to historical volatility. The system also retrieves dividend-event information, although the source code explicitly treats dividend events as a market-activity calendar indicator rather than a direct XAUUSD price trigger.
Overall, the project provides a structured workflow for converting raw XAUUSD API data into a trader-oriented dashboard. However, the resulting signals remain technical indicators and should not be interpreted as a standalone trading decision. The analysis is limited to the variables implemented in the source code and does not incorporate broader macroeconomic factors such as interest rates, US Dollar Index movements, inflation data, employment data, or central-bank policy.