Cryptocurrency markets are highly dynamic, with asset prices and market trends changing rapidly over time. For traders, identifying assets that are currently receiving market attention and showing strong directional momentum can provide an important initial screening step before performing detailed technical analysis.
This project develops a Crypto Market Trend Intelligence System using the MarketFlow API. The system retrieves data from the /trending and /crypto/strong-trend endpoints, converts the API responses into structured datasets, identifies the directional bias of individual assets, calculates a relative trend-strength score, assigns trading priority, and summarizes the overall trend condition of the analyzed cryptocurrency dataset.
The analysis is designed as a market screening and directional filtering tool, rather than an automatic trading strategy. The resulting information can help traders identify assets that deserve further investigation using technical indicators such as price structure, volume, RSI, moving averages, support and resistance, and risk-to-reward analysis.
Cell 1 — Import Library and API Configuration
The first cell imports the Python libraries required for the analysis and configures the connection to the MarketFlow API. Pandas is used for data processing and tabular analysis, Requests is used to communicate with the API, NumPy is used for numerical calculations, and IPython Display is used to present DataFrames in a readable format.
The API configuration contains the MarketFlow base URL and authentication headers. The API key is represented as YOUR_API_KEY for security and should be replaced with the user's own RapidAPI key.
# ============================================================
# CELL 1 - SETUP
# ============================================================

import requests
import pandas as pd
import numpy as np
from IPython.display import display


# ============================================================
# RAPIDAPI CONFIGURATION
# ============================================================

RAPIDAPI_KEY = "YOUR_API_KEY"

HOST = (
    "marketflow-all-in-one-market-finance-api.p.rapidapi.com"
)

BASE_URL = f"https://{HOST}"


HEADERS = {
    "x-rapidapi-key": RAPIDAPI_KEY,
    "x-rapidapi-host": HOST
}


print("Setup completed successfully.")
Cell 2 — Trending Market
The second cell retrieves data from the Trending Market endpoint. This endpoint is used to identify cryptocurrency assets that are currently receiving market attention.
The API response is stored as JSON in trending_json. The HTTP status code is displayed to verify whether the request was successful. A preview of the raw response is also displayed so that the structure of the API data can be inspected before normalization.
# CELL 2 - TRENDING MARKET

url = f"{BASE_URL}/trending"

response = requests.get(
    url,
    headers=HEADERS,
    timeout=30
)

print("HTTP Status:", response.status_code)

response.raise_for_status()

trending_json = response.json()

print("Response type:", type(trending_json))
print("\nPreview raw response:")
print(str(trending_json)[:1500])
The main purpose of this cell is to obtain the market-attention dataset. Trending information alone does not represent a complete trading signal because an asset may become trending temporarily without developing a sustainable directional movement.
Cell 3 — Crypto Strong Trend
The third cell retrieves data from the Crypto Strong Trend endpoint. This dataset provides the primary information used to determine directional trends and relative trend strength.
Similar to Cell 2, the response is first checked through the HTTP status code and then converted into JSON. A preview of the raw response is displayed to make it easier to inspect the structure and available variables.
# CELL 3 - CRYPTO STRONG TREND

url = f"{BASE_URL}/crypto/strong-trend"

response = requests.get(
    url,
    headers=HEADERS,
    timeout=30
)

print("HTTP Status:", response.status_code)

response.raise_for_status()

strong_json = response.json()

print("Response type:", type(strong_json))
print("\nPreview raw response:")
print(str(strong_json)[:1500])
The Strong Trend dataset is more important for the trading-intelligence calculation because it is used to identify whether an asset has a bullish or bearish directional trend and, when numerical strength data are available, to calculate its relative trend strength.
Cell 4 — Data Normalization and Preparation
The fourth cell converts the raw API responses into structured Pandas DataFrames.
Because API responses can have different JSON structures, the extract_records() function searches several possible keys, including data, results, result, items, symbols, trending, and crypto. This prevents the analysis from depending on one fixed API response structure.
After the records are extracted, pd.json_normalize() converts them into tabular DataFrames. The cell then displays the number of records, available columns, and sample data for both datasets.
# CELL 4 - NORMALISASI DAN GABUNGKAN DATA

def extract_records(data):
    """
    Mengubah berbagai bentuk response JSON API
    menjadi list of dictionaries.
    """

    if isinstance(data, list):
        return data

    if isinstance(data, dict):

        preferred_keys = [
            "data",
            "results",
            "result",
            "items",
            "symbols",
            "trending",
            "crypto"
        ]

        for key in preferred_keys:
            if key in data:
                value = data[key]

                if isinstance(value, list):
                    return value

                if isinstance(value, dict):
                    # mencari nested list
                    for nested_value in value.values():
                        if isinstance(nested_value, list):
                            return nested_value

        # fallback
        for value in data.values():
            if isinstance(value, list):
                return value

    return []


trending_records = extract_records(trending_json)
strong_records = extract_records(strong_json)

df_trending = pd.json_normalize(trending_records)
df_strong = pd.json_normalize(strong_records)

print("Jumlah Trending :", len(df_trending))
print("Jumlah Strong Trend :", len(df_strong))

print("\nKolom Trending:")
print(df_trending.columns.tolist())

print("\nKolom Strong Trend:")
print(df_strong.columns.tolist())

print("\n=== TRENDING DATA ===")
display(df_trending.head(10))

print("\n=== STRONG TREND DATA ===")
display(df_strong.head(10))
This cell is important because it creates the structured datasets that will be used in the final analysis. It also provides an early validation step. If the API returns an unexpected structure or empty data, the problem can be identified before the trading calculations are performed.
Cell 5 — Trading Intelligence Analysis
The fifth cell performs the main trading-intelligence analysis.
First, the system detects the relevant columns automatically. The asset identifier can be obtained from fields such as symbol, ticker, pair, coin, or asset. The trend direction can be identified from fields such as trend, direction, signal, or side.
The system then converts the available trend information into standardized BULLISH, BEARISH, or NEUTRAL classifications.
If numerical trend-strength data are available, the system applies min-max normalization to create a Confidence Score from 0 to 100. The score represents relative trend strength within the current dataset and should not be interpreted as a probability of profit.
The score is then converted into three Trading Priority categories:
Below 40 → LOW
40 to below 70 → MEDIUM
70 or higher → HIGH
Finally, the system calculates the overall market trend based on the number of bullish and bearish assets and displays the top trading opportunities.
# CELL 5 - TRADING ANALYSIS

def find_column(df, candidates):
    """Mencari nama kolom berdasarkan beberapa kemungkinan nama."""

    if df.empty:
        return None

    cols = {
        str(c).lower().replace("_", "").replace("-", ""): c
        for c in df.columns
    }

    for candidate in candidates:

        key = candidate.lower().replace("_", "").replace("-", "")

        if key in cols:
            return cols[key]

        for normalized, original in cols.items():
            if key in normalized:
                return original

    return None


# ---------------------------
# DETEKSI KOLOM
# ---------------------------

symbol_col = find_column(
    df_strong,
    ["symbol", "ticker", "pair", "coin", "asset"]
)

trend_col = find_column(
    df_strong,
    ["trend", "direction", "signal", "side"]
)

strength_col = find_column(
    df_strong,
    [
        "strength",
        "score",
        "trend_strength",
        "momentum",
        "change_percent",
        "change"
    ]
)


# ---------------------------
# DATA ANALYSIS
# ---------------------------

if df_strong.empty:

    print("Tidak ada data strong trend yang dapat dianalisis.")

else:

    analysis = df_strong.copy()


    # =========================
    # SYMBOL
    # =========================

    if symbol_col:
        analysis["Asset"] = analysis[symbol_col].astype(str)
    else:
        analysis["Asset"] = [
            f"Asset_{i+1}" for i in range(len(analysis))
        ]


    # =========================
    # TREND DIRECTION
    # =========================

    if trend_col:

        trend_text = (
            analysis[trend_col]
            .astype(str)
            .str.lower()
        )

        analysis["Trading_Bias"] = np.select(
            [
                trend_text.str.contains(
                    "bull|up|long|buy|positive",
                    regex=True
                ),

                trend_text.str.contains(
                    "bear|down|short|sell|negative",
                    regex=True
                )
            ],
            [
                "BULLISH",
                "BEARISH"
            ],
            default="NEUTRAL"
        )

    else:
        analysis["Trading_Bias"] = "TREND DETECTED"


    # =========================
    # TREND STRENGTH
    # =========================

    if strength_col:

        strength = pd.to_numeric(
            analysis[strength_col],
            errors="coerce"
        )

        analysis["Raw_Strength"] = strength

        valid = strength.dropna()

        if len(valid) > 1:

            min_v = valid.min()
            max_v = valid.max()

            if max_v != min_v:

                analysis["Confidence_Score"] = (
                    (strength - min_v)
                    /
                    (max_v - min_v)
                    * 100
                )

            else:
                analysis["Confidence_Score"] = 50

        else:
            analysis["Confidence_Score"] = 50

    else:

        # tanpa strength numerik,
        # confidence tidak boleh dibuat seolah-olah data aktual
        analysis["Confidence_Score"] = np.nan


    # =========================
    # PRIORITY
    # =========================

    if analysis["Confidence_Score"].notna().any():

        analysis["Trading_Priority"] = pd.cut(
            analysis["Confidence_Score"],
            bins=[
                -np.inf,
                40,
                70,
                np.inf
            ],
            labels=[
                "LOW",
                "MEDIUM",
                "HIGH"
            ]
        )

    else:
        analysis["Trading_Priority"] = "N/A"


    # =========================
    # SORT
    # =========================

    if analysis["Confidence_Score"].notna().any():

        analysis = analysis.sort_values(
            "Confidence_Score",
            ascending=False
        )


    output_cols = [
        "Asset",
        "Trading_Bias",
        "Confidence_Score",
        "Trading_Priority"
    ]


    print("=" * 70)
    print("CRYPTO TREND TRADING INTELLIGENCE")
    print("=" * 70)

    display(
        analysis[output_cols]
        .head(20)
        .reset_index(drop=True)
    )


    # =========================
    # MARKET SUMMARY
    # =========================

    bullish = (
        analysis["Trading_Bias"] == "BULLISH"
    ).sum()

    bearish = (
        analysis["Trading_Bias"] == "BEARISH"
    ).sum()

    neutral = (
        analysis["Trading_Bias"] == "NEUTRAL"
    ).sum()


    print("\nMARKET TREND SUMMARY")
    print("-" * 40)

    print("Bullish Assets :", bullish)
    print("Bearish Assets :", bearish)
    print("Neutral Assets :", neutral)


    if bullish > bearish:
        regime = "BULLISH"

    elif bearish > bullish:
        regime = "BEARISH"

    else:
        regime = "MIXED / NEUTRAL"


    print("\nOverall Crypto Trend :", regime)


    # =========================
    # TOP OPPORTUNITIES
    # =========================

    print("\nTOP TRADING OPPORTUNITIES")
    print("-" * 40)


    top = analysis.head(5)

    for _, row in top.iterrows():

        score = row["Confidence_Score"]

        if pd.isna(score):
            score_text = "N/A"
        else:
            score_text = f"{score:.1f}/100"

        print(
            f"{row['Asset']} | "
            f"{row['Trading_Bias']} | "
            f"Score: {score_text} | "
            f"Priority: {row['Trading_Priority']}"
        )


    print("\nINTERPRETASI:")

    print("""
1. BULLISH menunjukkan aset memiliki arah strong trend naik.
2. BEARISH menunjukkan strong trend turun.
3. HIGH Priority berarti aset relatif memiliki trend paling kuat
   dibandingkan aset lain pada response API.
4. Trending data dapat digunakan untuk mendeteksi aset yang sedang
   mendapat perhatian pasar.
5. Strong Trend digunakan sebagai directional filter sebelum entry.
6. Sinyal ini sebaiknya dikombinasikan dengan price action, volume,
   support-resistance, RSI atau moving average sebelum membuka posisi.
""")
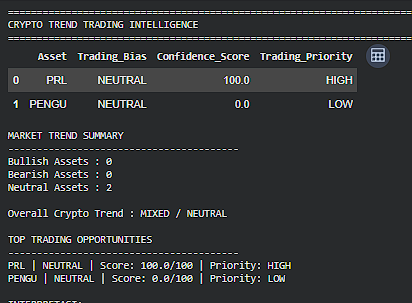
The main output of this cell is a ranked table containing Asset, Trading Bias, Confidence Score, and Trading Priority. The system also summarizes the number of bullish, bearish, and neutral assets and determines whether the analyzed dataset has an overall bullish, bearish, or mixed condition.
The Confidence Score uses the following min-max normalization:
\[ Confidence\ Score = \frac{X-X_{min}} {X_{max}-X_{min}} \times100 \]
Therefore, a score of 90 does not mean a 90% probability of profit. It means that the asset has a relatively strong trend measurement compared with other assets in the same dataset.
Result:
Conclusion
The Crypto Market Trend Intelligence system provides a structured approach to screening cryptocurrency markets using MarketFlow API data. The /trending endpoint identifies assets receiving market attention, while the /crypto/strong-trend endpoint provides the primary directional trend information.
Through the five-cell workflow, raw API responses are transformed into structured datasets, trend directions are classified into bullish or bearish conditions, numerical trend strength is converted into a relative Confidence Score, and assets are assigned Trading Priority categories. The system also summarizes the overall directional condition of the analyzed dataset and identifies the highest-ranked trading candidates.
The resulting dashboard should be considered a screening tool rather than an automatic trading system. A high Confidence Score indicates relatively strong trend strength within the analyzed dataset, but it does not represent a probability of profit. Final trading decisions should therefore be supported by additional technical analysis, including price structure, volume, support and resistance, RSI, moving averages, breakout or pullback confirmation, and risk-to-reward analysis.