
Cryptocurrency markets are highly dynamic, making it important for traders to understand both broader market positioning and individual asset momentum. Looking only at the assets with the highest price increases may provide an incomplete picture because strong performance from individual assets does not necessarily mean that the overall market is bullish. This project develops a MarketFlow BTC Trader Analysis system that combines Global Heatmap BTC data with Trending Market data to evaluate market positioning, determine the overall market condition, identify the current trading bias, and generate potential trading candidates.
The system uses the MarketFlow API to retrieve two main datasets. The first dataset comes from the Global Heatmap BTC endpoint and contains information such as market segment, total position value, total long position value, position count, liquidation-related value, and market bias. The second dataset comes from the Trending Market endpoint and contains asset symbols, 24-hour price changes, trading volume, and market-cap ranking. These two datasets provide complementary information because the Global Heatmap describes market positioning, while the Trending Market data describes individual asset momentum.
The Global Heatmap cannot be analyzed using a conventional price-change variable because its available fields describe position exposure rather than asset returns. Therefore, this project uses the Long Ratio as the main market-positioning indicator. The Long Ratio represents the proportion of total position value held in long positions and is calculated by dividing total long position value by total position value and multiplying the result by 100. The system calculates the Long Ratio for each segment and also calculates a Weighted Market Long Ratio using the aggregate position values. The weighted calculation gives larger position segments a proportionally larger contribution to the overall market measurement.
The system also calculates additional market information, including the average segment Long Ratio, total position count, and total liquidation-related value. These variables provide additional context when interpreting the market environment. A high Long Ratio indicates that long positioning represents a larger proportion of total position value, while a Long Ratio close to 50% indicates that long and short exposure are relatively balanced.
The Weighted Market Long Ratio is used to classify the market condition. A value of 65% or higher is classified as Strong Bullish, while a value between 55% and below 65% is classified as Bullish. A value above 45% and below 55% is classified as Mixed / Neutral. A value above 35% and up to 45% is classified as Bearish, while a value of 35% or lower is classified as Strong Bearish. This classification provides a systematic method for translating market positioning into a simple market-condition indicator.
The Trending Market dataset provides a different perspective by identifying assets that currently show positive or negative price momentum. The system converts the 24-hour price-change field into a numeric variable and sorts the dataset to identify the top gainers and top losers. This information is not treated as a standalone trading signal. Instead, it is combined with the broader market positioning obtained from the Global Heatmap.
The combination of Global Heatmap and Trending Market data is then used to determine the trading bias. When the market condition is Strong Bullish or Bullish, the system generates a Long Bias because long positioning is dominant. When the market condition is Strong Bearish or Bearish, the system generates a Defensive / Short Bias because bearish positioning is more dominant. When the market condition is Mixed / Neutral, the system generates a Neutral / Selective bias because the market does not show a sufficiently strong directional imbalance.
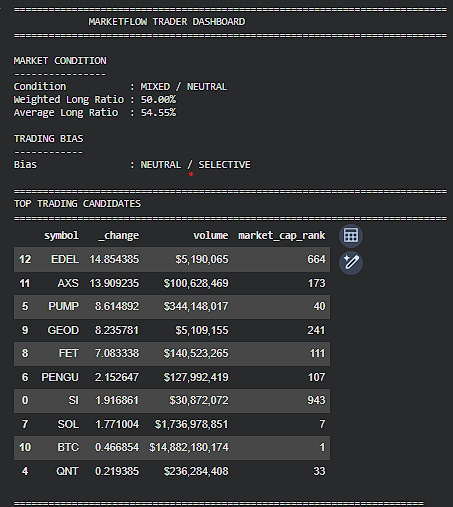
The system also creates a list of potential trading candidates from the Trending Market dataset. An asset must have positive 24-hour momentum but less than a 20% increase to enter the candidate list. The purpose of this filter is to identify assets with positive momentum while avoiding assets that have already experienced an extreme price increase. The candidates are then sorted according to their positive price change and displayed together with available trading volume and market-cap ranking information.
The final MarketFlow Trader Dashboard summarizes the market condition, Weighted Long Ratio, Average Long Ratio, trading bias, and top trading candidates. This makes the output easier to interpret because the trader can immediately see the broader market positioning before evaluating individual assets. A high Long Ratio combined with positive trending assets represents a more supportive environment for bullish momentum. Positive trending assets during a low Long Ratio environment require greater selectivity because individual strength may not represent broad market strength. When the Long Ratio is close to 50%, traders should avoid applying an excessive directional bias and should focus more heavily on individual asset structure and momentum.
The system is designed as a market screener rather than an automatic trading strategy. The Long Ratio describes positioning within the available Global Heatmap data, but it does not guarantee future price direction. Similarly, a positive 24-hour price change only describes recent momentum and does not confirm that an asset will continue rising. Therefore, potential trading candidates should still be evaluated using price structure, support and resistance, trading volume, RSI, moving averages, breakout or pullback confirmation, and risk-to-reward analysis.
Overall, the MarketFlow BTC Trader Analysis system provides a structured approach for combining broader market positioning with individual asset momentum. The Global Heatmap is used to evaluate long exposure and market condition, while the Trending Market dataset is used to identify assets with positive momentum and market attention. By combining these two perspectives, the system provides a more informative screening process than relying on trending assets alone. Its main purpose is to help traders understand the current market environment and identify assets that deserve further analysis rather than automatically generating buy or sell decisions.
Full Python Implementation
Cell 1 — API Setup and Request Function
# ============================================================
# CELL 1 — API SETUP AND REQUEST FUNCTION
# ============================================================

import requests
import pandas as pd
import numpy as np
from IPython.display import display


# ============================================================
# RAPIDAPI CONFIGURATION
# ============================================================

RAPIDAPI_KEY = "YOUR_API_KEY"

BASE_URL = (
    "https://marketflow-all-in-one-market-finance-api.p.rapidapi.com"
)


HEADERS = {
    "x-rapidapi-key": RAPIDAPI_KEY,
    "x-rapidapi-host":
        "marketflow-all-in-one-market-finance-api.p.rapidapi.com"
}


# ============================================================
# API REQUEST FUNCTION
# ============================================================

def get_api(endpoint, params=None):

    url = f"{BASE_URL}/{endpoint}"

    response = requests.get(
        url,
        headers=HEADERS,
        params=params,
        timeout=30
    )

    print(f"Endpoint   : /{endpoint}")
    print(f"HTTP Status: {response.status_code}")

    response.raise_for_status()

    return response.json()


print("API setup completed successfully.")
Cell 2 — Retrieve Global Heatmap BTC and Trending Market
# ============================================================
# CELL 2 — RETRIEVE MARKET DATA
# ============================================================


# ============================================================
# GLOBAL HEATMAP BTC
# ============================================================

heatmap_raw = get_api(
    "global-heatmap",
    params={
        "symbol": "BTC"
    }
)


# ============================================================
# TRENDING MARKET
# ============================================================

trending_raw = get_api(
    "trending"
)


# ============================================================
# JSON TO DATAFRAME FUNCTION
# ============================================================

def json_to_df(data):

    if isinstance(data, list):

        return pd.DataFrame(data)


    if isinstance(data, dict):

        for key, value in data.items():

            if isinstance(value, list):

                return pd.DataFrame(value)


        return pd.json_normalize(data)


    return pd.DataFrame()


# ============================================================
# CONVERT API RESPONSES
# ============================================================

df_heatmap = json_to_df(
    heatmap_raw
)


df_trending = json_to_df(
    trending_raw
)


# ============================================================
# DISPLAY GLOBAL HEATMAP
# ============================================================

print("\n=== GLOBAL HEATMAP BTC ===")

display(
    df_heatmap.head(20)
)


print("\nHeatmap columns:")

print(
    df_heatmap.columns.tolist()
)


# ============================================================
# DISPLAY TRENDING MARKET
# ============================================================

print("\n=== TRENDING MARKET ===")

display(
    df_trending.head(20)
)


print("\nTrending columns:")

print(
    df_trending.columns.tolist()
)
Cell 3 — Data Cleaning and Column Detection
# ============================================================
# CELL 3 — DATA CLEANING AND COLUMN DETECTION
# ============================================================


# ============================================================
# CONVERT NUMERIC COLUMNS
# ============================================================

def convert_numeric(df):

    df = df.copy()

    for col in df.columns:

        try:

            df[col] = pd.to_numeric(
                df[col]
            )

        except:

            pass

    return df


df_heatmap = convert_numeric(
    df_heatmap
)


df_trending = convert_numeric(
    df_trending
)


# ============================================================
# COLUMN DETECTION FUNCTION
# ============================================================

def detect_column(df, keywords):

    normalized_columns = {}

    for col in df.columns:

        normalized = (
            str(col)
            .lower()
            .replace("_", "")
            .replace(" ", "")
        )

        normalized_columns[
            normalized
        ] = col


    # Exact match

    for keyword in keywords:

        normalized_keyword = (
            str(keyword)
            .lower()
            .replace("_", "")
            .replace(" ", "")
        )


        if normalized_keyword in normalized_columns:

            return normalized_columns[
                normalized_keyword
            ]


    # Partial match

    for normalized_col, original_col in (
        normalized_columns.items()
    ):

        for keyword in keywords:

            normalized_keyword = (
                str(keyword)
                .lower()
                .replace("_", "")
                .replace(" ", "")
            )


            if normalized_keyword in normalized_col:

                return original_col


    return None


# ============================================================
# GLOBAL HEATMAP COLUMNS
# ============================================================

heatmap_segment = detect_column(
    df_heatmap,
    ["segment"]
)


heatmap_total = detect_column(
    df_heatmap,
    ["totalPositionValue"]
)


heatmap_long = detect_column(
    df_heatmap,
    ["totalPositionValueLong"]
)


heatmap_position_count = detect_column(
    df_heatmap,
    ["positionCount"]
)


heatmap_liquidation = detect_column(
    df_heatmap,
    ["valueCloseToLiquidation"]
)


heatmap_bias = detect_column(
    df_heatmap,
    ["bias"]
)


# ============================================================
# TRENDING MARKET COLUMNS
# ============================================================

trend_symbol = detect_column(
    df_trending,
    [
        "symbol",
        "ticker",
        "coin",
        "asset"
    ]
)


trend_change = detect_column(
    df_trending,
    [
        "price_change_24h",
        "change",
        "percent",
        "return"
    ]
)


trend_volume = detect_column(
    df_trending,
    [
        "volume",
        "vol"
    ]
)


trend_rank = detect_column(
    df_trending,
    [
        "market_cap_rank",
        "rank",
        "position",
        "score"
    ]
)


# ============================================================
# DISPLAY DETECTED COLUMNS
# ============================================================

print("=" * 70)

print(
    "DETECTED GLOBAL HEATMAP COLUMNS"
)

print("=" * 70)


print(
    "Segment              :",
    heatmap_segment
)

print(
    "Total Position Value :",
    heatmap_total
)

print(
    "Total Position Long  :",
    heatmap_long
)

print(
    "Position Count       :",
    heatmap_position_count
)

print(
    "Liquidation Value    :",
    heatmap_liquidation
)

print(
    "Bias                 :",
    heatmap_bias
)


print("\n" + "=" * 70)

print(
    "DETECTED TRENDING COLUMNS"
)

print("=" * 70)


print(
    "Symbol :",
    trend_symbol
)

print(
    "Change :",
    trend_change
)

print(
    "Volume :",
    trend_volume
)

print(
    "Rank   :",
    trend_rank
)
Cell 4 — MarketFlow Trader Analysis
# ============================================================
# CELL 4 — MARKETFLOW TRADER ANALYSIS
# ============================================================


print("=" * 70)

print(
    "MARKETFLOW TRADER ANALYSIS"
)

print("=" * 70)


# ============================================================
# 1. GLOBAL HEATMAP BTC
# ============================================================

print(
    "\n1. GLOBAL HEATMAP BTC"
)


if (
    heatmap_total is not None
    and heatmap_long is not None
):

    # --------------------------------------------------------
    # TOTAL POSITION VALUE
    # --------------------------------------------------------

    total_position = pd.to_numeric(
        df_heatmap[heatmap_total],
        errors="coerce"
    )


    # --------------------------------------------------------
    # TOTAL LONG POSITION VALUE
    # --------------------------------------------------------

    total_long = pd.to_numeric(
        df_heatmap[heatmap_long],
        errors="coerce"
    )


    # --------------------------------------------------------
    # LONG RATIO PER SEGMENT
    # --------------------------------------------------------

    df_heatmap["long_ratio"] = (
        total_long
        / total_position
        * 100
    )


    # --------------------------------------------------------
    # WEIGHTED MARKET LONG RATIO
    # --------------------------------------------------------

    total_market_position = (
        total_position.sum()
    )


    total_market_long = (
        total_long.sum()
    )


    if total_market_position > 0:

        market_long_ratio = (
            total_market_long
            / total_market_position
            * 100
        )

    else:

        market_long_ratio = np.nan


    # --------------------------------------------------------
    # AVERAGE SEGMENT LONG RATIO
    # --------------------------------------------------------

    average_long_ratio = (
        df_heatmap["long_ratio"]
        .mean()
    )


    # --------------------------------------------------------
    # POSITION COUNT
    # --------------------------------------------------------

    if heatmap_position_count is not None:

        position_count = pd.to_numeric(
            df_heatmap[
                heatmap_position_count
            ],
            errors="coerce"
        ).sum()

    else:

        position_count = np.nan


    # --------------------------------------------------------
    # LIQUIDATION VALUE
    # --------------------------------------------------------

    if heatmap_liquidation is not None:

        liquidation_value = pd.to_numeric(
            df_heatmap[
                heatmap_liquidation
            ],
            errors="coerce"
        ).sum()

    else:

        liquidation_value = np.nan


    # --------------------------------------------------------
    # MARKET CONDITION
    # --------------------------------------------------------

    if market_long_ratio >= 65:

        market_condition = (
            "STRONG BULLISH"
        )


    elif market_long_ratio >= 55:

        market_condition = (
            "BULLISH"
        )


    elif market_long_ratio <= 35:

        market_condition = (
            "STRONG BEARISH"
        )


    elif market_long_ratio <= 45:

        market_condition = (
            "BEARISH"
        )


    else:

        market_condition = (
            "MIXED / NEUTRAL"
        )


    # --------------------------------------------------------
    # DISPLAY HEATMAP ANALYSIS
    # --------------------------------------------------------

    print(
        f"Weighted Long Ratio : "
        f"{market_long_ratio:.2f}%"
    )


    print(
        f"Average Long Ratio  : "
        f"{average_long_ratio:.2f}%"
    )


    print(
        f"Total Position      : "
        f"{total_market_position:,.2f}"
    )


    print(
        f"Total Long Position : "
        f"{total_market_long:,.2f}"
    )


    if pd.notna(position_count):

        print(
            f"Position Count      : "
            f"{position_count:,.0f}"
        )

    else:

        print(
            "Position Count      : N/A"
        )


    if pd.notna(liquidation_value):

        print(
            f"Liquidation Value   : "
            f"{liquidation_value:,.2f}"
        )

    else:

        print(
            "Liquidation Value   : N/A"
        )


    print(
        f"\nMarket Condition    : "
        f"{market_condition}"
    )


else:

    market_long_ratio = np.nan

    average_long_ratio = np.nan

    market_condition = (
        "DATA UNAVAILABLE"
    )


    print(
        "Global Heatmap data "
        "is incomplete."
    )


# ============================================================
# 2. TRENDING ASSETS
# ============================================================

print(
    "\n" + "=" * 70
)

print(
    "2. TRENDING ASSETS"
)

print(
    "=" * 70
)


if trend_change is not None:

    df_trending["_change_numeric"] = (
        pd.to_numeric(
            df_trending[trend_change],
            errors="coerce"
        )
    )


    # --------------------------------------------------------
    # TOP GAINERS
    # --------------------------------------------------------

    top_gainers = (
        df_trending
        .sort_values(
            "_change_numeric",
            ascending=False
        )
        .head(10)
    )


    # --------------------------------------------------------
    # TOP LOSERS
    # --------------------------------------------------------

    top_losers = (
        df_trending
        .sort_values(
            "_change_numeric",
            ascending=True
        )
        .head(10)
    )


    print(
        "\nTOP TRENDING GAINERS"
    )

    display(
        top_gainers
    )


    print(
        "\nTOP TRENDING LOSERS"
    )

    display(
        top_losers
    )


# ============================================================
# 3. TRADING BIAS
# ============================================================

print(
    "\n" + "=" * 70
)

print(
    "3. TRADING BIAS"
)

print(
    "=" * 70
)


if market_condition in [
    "STRONG BULLISH",
    "BULLISH"
]:

    bias = "LONG BIAS"


    explanation = (
        "Long positioning is dominant. "
        "Traders can prioritize assets "
        "with positive momentum."
    )


elif market_condition in [
    "STRONG BEARISH",
    "BEARISH"
]:

    bias = (
        "DEFENSIVE / SHORT BIAS"
    )


    explanation = (
        "Short exposure is dominant. "
        "Traders should be more defensive "
        "toward long positions."
    )


else:

    bias = (
        "NEUTRAL / SELECTIVE"
    )


    explanation = (
        "Long and short exposure are relatively "
        "balanced. Traders should be selective "
        "and rely more on individual asset momentum."
    )


print(
    "Current Trading Bias :",
    bias
)


print(
    "\nInterpretation:"
)

print(
    explanation
)
Cell 5 — MarketFlow Trader Dashboard
# ============================================================
# CELL 5 — MARKETFLOW TRADER DASHBOARD
# ============================================================


print("=" * 75)

print(
    "             MARKETFLOW TRADER DASHBOARD"
)

print("=" * 75)


# ============================================================
# MARKET CONDITION
# ============================================================

print(
    f"""
MARKET CONDITION
----------------
Condition           : {market_condition}
Weighted Long Ratio : {market_long_ratio:.2f}%
Average Long Ratio  : {average_long_ratio:.2f}%

TRADING BIAS
------------
Bias                : {bias}
"""
)


# ============================================================
# TOP TRADING CANDIDATES
# ============================================================

print(
    "=" * 75
)

print(
    "TOP TRADING CANDIDATES"
)

print(
    "=" * 75
)


if trend_change is not None:

    candidates = (
        df_trending.copy()
    )


    # --------------------------------------------------------
    # CONVERT PRICE CHANGE TO NUMERIC
    # --------------------------------------------------------

    candidates["_change"] = (
        pd.to_numeric(
            candidates[trend_change],
            errors="coerce"
        )
    )


    # --------------------------------------------------------
    # FILTER POSITIVE MOMENTUM
    # AND AVOID EXTREME PUMPS
    # --------------------------------------------------------

    candidates = candidates[
        (candidates["_change"] > 0)
        &
        (candidates["_change"] < 20)
    ]


    # --------------------------------------------------------
    # SORT BY MOMENTUM
    # --------------------------------------------------------

    candidates = (
        candidates
        .sort_values(
            "_change",
            ascending=False
        )
    )


    # --------------------------------------------------------
    # SELECT DISPLAY COLUMNS
    # --------------------------------------------------------

    selected_cols = []


    if trend_symbol is not None:

        selected_cols.append(
            trend_symbol
        )


    selected_cols.append(
        "_change"
    )


    if trend_volume is not None:

        selected_cols.append(
            trend_volume
        )


    if trend_rank is not None:

        selected_cols.append(
            trend_rank
        )


    # --------------------------------------------------------
    # TOP 10 CANDIDATES
    # --------------------------------------------------------

    candidates = (
        candidates[
            selected_cols
        ]
        .head(10)
    )


    display(
        candidates
    )


else:

    display(
        df_trending.head(10)
    )


# ============================================================
# TRADER INTERPRETATION
# ============================================================

print(
"""
=======================================================================
TRADER INTERPRETATION
=======================================================================

1. GLOBAL HEATMAP
   Measures the distribution of long positions
   relative to total position value.

2. LONG RATIO
   Shows the percentage of total position value
   allocated to long positions.

3. TRENDING
   Identifies assets currently receiving significant
   market attention.

4. HEATMAP + TRENDING

   High Long Ratio + Positive Trending
   -> More supportive environment for bullish momentum.

   Low Long Ratio + Positive Trending
   -> The asset's upside momentum should be analyzed selectively.

   Low Long Ratio + Negative Trending
   -> Bearish pressure is more dominant.

   Long Ratio around 50%
   -> Long and short exposure are relatively balanced.

5. TRADING CANDIDATE FILTER
   Candidates have positive momentum but a price increase
   below 20% to avoid extreme pump conditions.

=======================================================================
IMPORTANT NOTE
=======================================================================

This output is a market screener, not an automatic entry signal.

Potential trades should still be confirmed using:
- Price structure
- Support / Resistance
- Volume
- RSI
- Moving Average
- Breakout / Pullback
- Risk to Reward
"""
)
The complete workflow therefore consists of five cells: API configuration, data retrieval, data cleaning and column detection, market analysis, and the final trader dashboard. The key correction is that Global Heatmap is analyzed using Long Ratio, because the retrieved Heatmap data does not contain a conventional price-change field. The Trending Market continues to use price_change_24h, volume, and market-cap rank as the individual-asset screening variables.
Result:
Conclusion
The MarketFlow BTC Trader Analysis system provides a structured approach to evaluating cryptocurrency market conditions by combining Global Heatmap positioning with Trending Market momentum. The Global Heatmap is analyzed through the Weighted Long Ratio to determine whether long or short exposure is dominant, while the Trending Market data identifies assets with positive momentum and significant market attention. The system then combines these indicators to classify the overall market condition and determine an appropriate trading bias.
The Top Trading Candidates filter further narrows the analysis to assets with positive momentum while excluding assets that have already increased by more than 20%. This helps reduce the tendency to chase extreme price movements. However, the resulting candidates should be treated as assets for further investigation rather than automatic trading signals.
Overall, the dashboard provides a practical market-screening framework that helps traders understand broader market positioning and identify assets that may warrant deeper technical analysis. Final trading decisions should still be supported by price structure, support and resistance, volume, RSI, moving averages, breakout or pullback confirmation, and risk-to-reward analysis.