
Smart money activity is one of the important factors in stock market analysis because large market participants can influence price movement and market direction. This project develops a Smart Money Analysis System by integrating stock chart data, bandar distribution analysis, and sector correlation data through an API-based approach.
The system processes market data to generate several indicators, including price trend, moving average comparison, volume ratio, momentum, foreign flow, and bandar activity. These indicators are combined into a scoring model to evaluate stock attractiveness and identify potential smart money activity.
The developed system provides an automated framework for analyzing market behavior and generating investor-oriented insights based on quantitative indicators.
1. Introduction
Stock market analysis requires multiple perspectives to understand market behavior. Price movement alone is often insufficient because market participants with large capital can influence supply and demand conditions.
This project introduces a Smart Money Analysis System that combines:
Stock price and volume analysis
Bandar distribution analysis
Foreign flow analysis
Sector correlation information
The objective of this system is to identify market conditions by transforming raw API data into meaningful indicators and a final smart money score.
2. System Implementation
Cell 1 — Setup API and Library
Code
# ============================================================
# CELL 1 : SETUP
# ============================================================

import requests
import pandas as pd
import numpy as np
import json
import warnings

warnings.filterwarnings("ignore")


API_HOST = "indonesia-stock-exchange-idx.p.rapidapi.com"


HEADERS = {
    "Content-Type": "application/json",
    "x-rapidapi-host": API_HOST,
    "x-rapidapi-key": "YOUR_RAPIDAPI_KEY"
}


print("SYSTEM READY")
Explanation
This cell initializes the required Python libraries and configures the API connection. The imported libraries are used for data retrieval, processing, numerical calculation, and JSON handling.
Cell 2 — Data Collector
Code
# ============================================================
# CELL 2 : DATA COLLECTOR
# ============================================================


def get_chart(symbol):

    url = (
        f"https://{API_HOST}/api/chart/"
        f"{symbol}/daily/latest"
    )


    params={
        "limit":100
    }


    r=requests.get(
        url,
        headers=HEADERS,
        params=params
    )


    return r.json()


def get_bandar(symbol):

    url=(
        f"https://{API_HOST}/api/analysis/"
        f"bandar/distribution/{symbol}"
    )


    params={
        "days":7
    }


    r=requests.get(
        url,
        headers=HEADERS,
        params=params
    )


    return r.json()


def get_sector(sector):

    url=(
        f"https://{API_HOST}/api/sectors/"
        f"correlation/{sector}"
    )


    r=requests.get(
        url,
        headers=HEADERS
    )


    return r.json()


def collect_data(symbol,sector):


    return {

        "symbol":symbol,

        "chart":
        get_chart(symbol),

        "bandar":
        get_bandar(symbol),

        "sector":
        get_sector(sector)

    }


market = collect_data(
    "BUMI",
    "energy"
)


print(market.keys())
Explanation
This cell collects three main datasets:
tock chart data
Bandar distribution analysis
Sector correlation data
The collected information is stored in a single dictionary called market for further analysis.
Cell 3 — Feature Engineering
Code
# ============================================================
# CELL 3 : FEATURE ENGINEERING (FIX IDX API)
# ============================================================


def create_features(chart):


    # Ambil chartbit

    df = pd.DataFrame(
        chart["data"]["data"]["chartbit"]
    )


    # Pastikan urut tanggal lama -> baru

    df["date"] = pd.to_datetime(
        df["date"]
    )


    df = df.sort_values(
        "date"
    )


    close = df["close"]

    volume = df["volume"]


    # =========================
    # MOVING AVERAGE
    # =========================


    ma20 = (
        close
        .tail(20)
        .mean()
    )


    ma50 = (
        close
        .tail(50)
        .mean()
    )


    # =========================
    # VOLUME ANALYSIS
    # =========================


    avg_volume = (
        volume
        .tail(20)
        .mean()
    )


    volume_ratio = (

        volume.iloc[-1]
        /
        avg_volume

    )


    # =========================
    # MOMENTUM
    # =========================


    momentum = (

        (
        close.iloc[-1]
        -
        close.iloc[-10]
        )
        /
        close.iloc[-10]

    )*100


    # =========================
    # TREND
    # =========================


    if (
        close.iloc[-1]
        >
        ma20
        >
        ma50
    ):

        trend="BULLISH"


    elif (

        close.iloc[-1]
        <
        ma20
        <
        ma50

    ):

        trend="BEARISH"


    else:

        trend="SIDEWAYS"


    # =========================
    # FOREIGN FLOW
    # =========================


    foreign_flow = (

        df["foreignbuy"].iloc[-1]
        -
        df["foreignsell"].iloc[-1]

    )


    if foreign_flow > 0:

        foreign_signal="FOREIGN BUY"


    else:

        foreign_signal="FOREIGN SELL"


    return {


        "last_price":
        close.iloc[-1],


        "MA20":
        round(ma20,2),


        "MA50":
        round(ma50,2),


        "trend":
        trend,


        "volume_ratio":
        round(volume_ratio,2),


        "momentum":
        round(momentum,2),


        "foreign_flow":
        foreign_flow,


        "foreign_signal":
        foreign_signal,


        "data_rows":
        len(df)

    }


features = create_features(
    market["chart"]
)


features
Explanation
This cell performs feature engineering from stock chart data.
The system calculates:
Moving Average 20 and 50 periods
Volume ratio
Price momentum
Trend classification
Foreign buying and selling flow
The generated features are used as input for the smart money scoring model.
Cell 4 — Smart Money Scoring Engine
Code
# ============================================================
# CELL 4 : SMART MONEY SCORING ENGINE
# ============================================================


def smart_money_score(features, bandar):


    score = 0

    reason = []


    # =================================
    # 1. PRICE TREND
    # =================================


    if features["trend"] == "BULLISH":

        score += 2

        reason.append(
            "Trend harga bullish"
        )


    elif features["trend"] == "BEARISH":

        score -= 2

        reason.append(
            "Trend harga bearish"
        )


    # =================================
    # 2. VOLUME ACCUMULATION
    # =================================


    if features["volume_ratio"] >= 1.5:

        score += 2

        reason.append(
            "Volume spike terdeteksi"
        )


    elif features["volume_ratio"] < 0.7:

        score -=1

        reason.append(
            "Volume melemah"
        )


    # =================================
    # 3. MOMENTUM
    # =================================


    if features["momentum"] > 3:

        score +=1

        reason.append(
            "Momentum positif"
        )


    elif features["momentum"] < -3:

        score -=1

        reason.append(
            "Momentum negatif"
        )


    # =================================
    # 4. FOREIGN FLOW
    # =================================


    if features["foreign_flow"] > 0:

        score +=1

        reason.append(
            "Foreign net buy"
        )


    else:

        score -=1

        reason.append(
            "Foreign net sell"
        )


    # =================================
    # 5. BANDAR DISTRIBUTION
    # =================================


    bandar_text = str(
        bandar
    ).lower()


    if (
        "accumulation"
        in bandar_text
    ):

        score +=3

        reason.append(
            "Bandar accumulation"
        )


    elif (

        "distribution"
        in bandar_text

    ):

        score -=3

        reason.append(
            "Bandar distribution"
        )


    # =================================
    # FINAL SCORE
    # =================================


    if score >=7:

        signal = (
            "🟢 NO SELL CANDIDATE"
        )


    elif score >=4:

        signal = (
            "🟡 WATCHLIST"
        )


    else:

        signal = (
            "🔴 NOT INTERESTING"
        )


    return {


        "score":
        score,


        "max_score":
        10,


        "signal":
        signal,


        "reason":
        reason

    }


analysis = smart_money_score(
    features,
    market["bandar"]
)


analysis
Explanation
This cell creates the smart money scoring model.
The scoring system evaluates:
Price trend
Volume strength
Momentum
Foreign flow
Bandar distribution condition
Each factor contributes positive or negative scores. The final score determines the stock classification:
NO SELL CANDIDATE
WATCHLIST
NOT INTERESTING
Cell 5 — Final Smart Money Dashboard
Code
# ============================================================
# CELL 5 : FINAL SMART MONEY DASHBOARD
# ============================================================


print("="*60)

print(
    "SMART MONEY ANALYSIS :",
    market["symbol"]
)

print("="*60)


print("\n📊 PRICE ACTION")

print("-"*40)


print(
    "Harga terakhir :",
    features["last_price"]
)


print(
    "Trend          :",
    features["trend"]
)


print(
    "MA20           :",
    features["MA20"]
)


print(
    "MA50           :",
    features["MA50"]
)


print("\n📈 VOLUME & MOMENTUM")

print("-"*40)


print(
    "Volume Ratio   :",
    features["volume_ratio"]
)


print(
    "Momentum       :",
    features["momentum"],
    "%"
)


print("\n🌍 FOREIGN FLOW")

print("-"*40)


print(
    "Flow           :",
    features["foreign_flow"]
)


print(
    "Signal         :",
    features["foreign_signal"]
)


print("\n🏦 SMART MONEY SCORE")

print("-"*40)


print(
    "Score          :",
    analysis["score"],
    "/",
    analysis["max_score"]
)


print(
    "Decision       :",
    analysis["signal"]
)


print("\n📝 REASON")

print("-"*40)


for r in analysis["reason"]:

    print(
        "✓",
        r
    )
Explanation
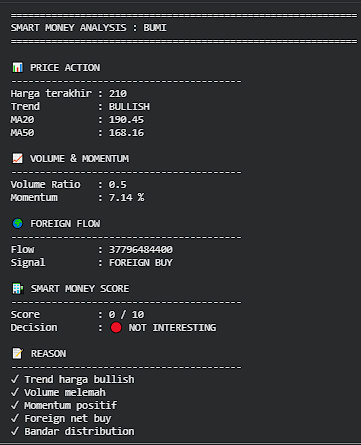
This cell displays the final smart money dashboard.
The output summarizes:
Price action
Volume and momentum condition
Foreign flow direction
Smart money score
Final decision and supporting reasons
The dashboard converts technical calculations into a simple interpretation for investors.
Conclusion
This project successfully developed a Smart Money Analysis System by combining stock chart data, bandar distribution analysis, and sector-related market information. The system processes raw API data into meaningful features such as trend direction, volume strength, momentum, foreign flow, and smart money score.
The scoring engine provides a structured method to evaluate market conditions by combining multiple indicators rather than relying on a single parameter. The final dashboard presents the analysis results in a simplified format, allowing users to understand potential market behavior more efficiently.
Although this system can assist investors in identifying possible smart money activity and market opportunities, the generated signals should not be treated as direct investment recommendations. Additional evaluation using company fundamentals, valuation analysis, and broader market conditions remains necessary before making investment decisions.