Corporate events are important components of stock market analysis because they can influence investor expectations, trading activity, and investment decisions. Dividend announcements provide information about distributions to shareholders, while initial public offerings (IPOs) introduce new securities to the public market. Monitoring these events can help investors organize relevant information and identify stocks that require further analysis.
Dividend analysis requires more than identifying companies that distribute dividends. Investors may need to examine the dividend amount per share, ex-dividend date, payment date, record date, and sector. These variables provide different types of information about the distribution and its timing. However, a dividend amount alone does not indicate the dividend yield, which requires the corresponding share price.
Similarly, IPO analysis involves examining information about newly listed or prospective publicly traded companies. IPO records may include the issuer's name, ticker symbol, exchange, offering status, listing date, and proposed price range. Organizing these fields into a structured watchlist can help investors compare available opportunities and identify missing information before conducting further research.
Python provides an efficient environment for collecting and processing these corporate event records. Through an application programming interface (API), financial information can be retrieved programmatically and transformed into structured datasets. Libraries such as Requests, Pandas, NumPy, and Matplotlib support data retrieval, cleaning, analysis, and visualization.
This article presents Market Events Analyzer, a Python-based framework that retrieves dividend and IPO event data from the MarketFlow All-in-One Market Finance API through RapidAPI. The system combines both event categories into a unified dataset, generates dividend and IPO watchlists, screens available IPO price ranges, visualizes corporate event distributions, and produces a dashboard for exploratory analysis.
The objective is to demonstrate a reproducible workflow for corporate event monitoring. The resulting watchlists and visualizations support preliminary research but do not constitute investment recommendations or guarantees of future stock performance.
2. Methodology
The Market Events Analyzer workflow consists of five computational stages. The first stage configures the API connection and analysis period. The second retrieves dividend and IPO records. The third normalizes the JSON responses and combines the available records into a single DataFrame. The fourth performs event screening and generates initial visualizations. The fifth builds a dashboard containing summary indicators, charts, watchlists, and a timeline of corporate events.
The implementation uses the following Python libraries:
Requestsfor communicating with the MarketFlow API.Pandasfor data cleaning, tabular analysis, and aggregation.NumPyfor numerical operations.Matplotlibfor visualizing event distributions and dividend amounts.IPython.displayfor presenting tables and dashboard elements in a notebook environment.
The example configuration uses the period November 2–9, 2025. This is a historical example period, not a current or future event window. The date parameters should be updated when the objective is to monitor upcoming corporate events.
Cell 1 — Setup, API Configuration, and Analysis Period
The first cell initializes the required libraries and configures authentication through RapidAPI. The API key is read from the RAPIDAPI_KEY environment variable or requested interactively if the environment variable is unavailable.
The start date, end date, pagination offset, and request timeout are also defined. An assertion checks that the starting date does not fall after the ending date.
Code — Cell 1
import json

API_HOST = "marketflow-all-in-one-market-finance-api.p.rapidapi.com"

# Masukkan hanya API key dari bagian X-RapidAPI-Key
API_KEY = getpass("Masukkan X-RapidAPI-Key: ").strip()

headers = {
    "x-rapidapi-key": API_KEY,
    "x-rapidapi-host": API_HOST
}

endpoints = {
    "DIVIDEND": "https://marketflow-all-in-one-market-finance-api.p.rapidapi.com/dividens-events",
    "IPO": "https://marketflow-all-in-one-market-finance-api.p.rapidapi.com/ipos-events"
}

params = {
    "skip": "0",
    "start_date": "2025-11-02",
    "end_date": "2025-11-09"
}

results = {}

for name, url in endpoints.items():
    try:
        r = requests.get(
            url,
            headers=headers,
            params=params,
            timeout=30
        )

        print(f"\n{name} | HTTP {r.status_code}")
        r.raise_for_status()

        results[name] = r.json()
        print(json.dumps(
            results[name],
            indent=2,
            ensure_ascii=True
        )[:2000])

    except Exception as e:
        results[name] = None
        print(f"{name} gagal: {type(e).__name__}: {e}")
Cell 2B — Data Cleaning and Event Normalization
The next stage converts the API responses into DataFrames. The extract_records() function supports common JSON structures, including lists and dictionaries containing fields such as data, results, items, events, records, dividends, and ipos.
The normalize_events() function flattens nested records using pandas.json_normalize(). It then identifies likely columns for ticker symbols, company names, and event dates. Standardized columns named symbol_clean, company_clean, and event_date_clean are created to simplify subsequent analysis.
Finally, the dividend and IPO datasets are combined into a single DataFrame called events. An event_type field distinguishes dividend records from IPO records.
Code — Cell 2B: Normalization and Merging
# CELL 2 - DATA CLEANING

def extract_records(payload):
    if payload is None:
        return []

    if isinstance(payload, list):
        return [x for x in payload if isinstance(x, dict)]

    if isinstance(payload, dict):
        for key in [
            "data", "results", "items", "events",
            "records", "dividends", "ipos"
        ]:
            value = payload.get(key)

            if isinstance(value, list):
                return [x for x in value if isinstance(x, dict)]

            if isinstance(value, dict):
                records = extract_records(value)
                if records:
                    return records

        return [payload] if payload else []

    return []


def normalize_events(payload, event_type):
    records = extract_records(payload)

    if not records:
        return pd.DataFrame()

    df = pd.json_normalize(records, sep="_")
    df.columns = [str(c).strip() for c in df.columns]
    df["event_type"] = event_type

    def find_column(candidates):
        lookup = {c.lower(): c for c in df.columns}
        for candidate in candidates:
            if candidate.lower() in lookup:
                return lookup[candidate.lower()]
        return None

    symbol_col = find_column([
        "symbol", "ticker", "stock_symbol", "company_ticker"
    ])

    company_col = find_column([
        "company_name", "company", "name",
        "issuer", "issuer_name"
    ])

    date_col = find_column([
        "ex_dividend_date", "ex_date", "ipo_date",
        "listing_date", "event_date", "date",
        "record_date", "payment_date", "effective_date"
    ])

    df["symbol_clean"] = (
        df[symbol_col].fillna("").astype(str)
        if symbol_col else ""
    )

    df["company_clean"] = (
        df[company_col].fillna("").astype(str)
        if company_col else ""
    )

    df["event_date_clean"] = (
        pd.to_datetime(df[date_col], errors="coerce", utc=True)
        .dt.tz_convert(None)
        .dt.normalize()
        if date_col else pd.NaT
    )

    return df


dividends = normalize_events(results.get("DIVIDEND"), "Dividend")
ipos = normalize_events(results.get("IPO"), "IPO")

frames = [df for df in [dividends, ipos] if not df.empty]

events = (
    pd.concat(frames, ignore_index=True, sort=False)
    if frames else pd.DataFrame()
)

print("Dividend records:", len(dividends))
print("IPO records:", len(ipos))
print("Total records:", len(events))

if not events.empty:
    display(events.head(10))
    print("\nKolom yang tersedia:")
    print(events.columns.tolist())
else:
    print("Tidak ada data event. Periksa respons Cell 1.")
Cell 3 — Dividend and IPO Screening
The third analytical stage separates dividend events from IPO events and prepares the numerical fields required for screening.
For dividend records, the code converts the amount field into a numeric variable. It then generates a dividend watchlist containing available dates, ticker symbols, company names, sectors, dividend amounts, currencies, payment dates, and record dates. A separate table ranks dividend records by their reported dividend amount per share.
For IPO records, the program extracts available listing dates, tickers, company names, offering status, exchange, and price-range information. It also summarizes the frequency of IPO statuses when a status field is present.
The analysis is descriptive. A high dividend amount does not necessarily imply a high dividend yield, and an IPO's proposed price range does not establish its future market performance.
Code — Cell 3
# CELL 3 - ANALISIS EVENT UNTUK TRADER

if events.empty:
    raise ValueError("Data event kosong. Jalankan Cell 1 dan Cell 2.")

# Gunakan tanggal asli API, lalu normalisasi
events["date_clean"] = pd.to_datetime(
    events["date"], errors="coerce", utc=True
).dt.tz_convert(None).dt.normalize()

events["amount_num"] = pd.to_numeric(
    events.get("amount", pd.Series(index=events.index, dtype=float)),
    errors="coerce"
)

events["ipo_price_low"] = pd.to_numeric(
    events.get("price_range_price_from",
               pd.Series(index=events.index, dtype=float)),
    errors="coerce"
)

events["ipo_price_high"] = pd.to_numeric(
    events.get("price_range_price_to",
               pd.Series(index=events.index, dtype=float)),
    errors="coerce"
)

dividend_df = events[
    events["event_type"].astype(str).str.lower().eq("dividend")
].copy()

ipo_df = events[
    events["event_type"].astype(str).str.lower().eq("ipo")
].copy()

print("=" * 60)
print("MARKET EVENTS TRADER REPORT")
print("=" * 60)
print("Total record :", len(events))
print("Dividend     :", len(dividend_df))
print("IPO          :", len(ipo_df))

print("\n1. DIVIDEND WATCHLIST")

if not dividend_df.empty:
    cols = [
        "date_clean", "ticker", "name", "sector",
        "amount_num", "currency", "pay_date", "record_date"
    ]
    cols = [c for c in cols if c in dividend_df.columns]

    display(
        dividend_df[cols]
        .sort_values("date_clean")
        .rename(columns={
            "date_clean": "event_date",
            "amount_num": "dividend_amount"
        })
        .head(30)
    )

    print("\nSaham dengan nominal dividen per saham tertinggi")
    display(
        dividend_df.sort_values("amount_num", ascending=False)[
            [c for c in [
                "ticker", "name", "sector",
                "amount_num", "currency", "date_clean"
            ] if c in dividend_df.columns]
        ].head(10)
    )

print("\n2. IPO WATCHLIST")

if not ipo_df.empty:
    ipo_cols = [
        "date_clean", "ticker", "symbol", "name",
        "status", "exchange", "price_range_price_from",
        "price_range_price_to", "price_range_exact_price"
    ]
    ipo_cols = [c for c in ipo_cols if c in ipo_df.columns]

    display(
        ipo_df[ipo_cols]
        .sort_values("date_clean")
        .head(30)
    )

    print("\nStatus IPO")
    if "status" in ipo_df.columns:
        display(
            ipo_df["status"].fillna("Tidak diketahui")
            .value_counts()
            .rename_axis("status")
            .to_frame("jumlah")
        )

# Tanggal contoh dapat berada di masa lalu.
today = pd.Timestamp(date.today())
print("\nTanggal hari ini:", today.date())
print("Catatan: gunakan periode terbaru untuk watchlist event mendatang.")
Cell 4 — Visualization and IPO Price Screening
The fourth cell introduces visual analysis to help interpret the event dataset.
The first chart shows the number of corporate events by sector when sector information is available. The second visualization ranks dividend amounts separately by currency. Separating currencies prevents dividend amounts denominated in different currencies from being compared directly as if they represented the same monetary unit.
The IPO screening section identifies records containing both lower and upper price estimates. These records can be placed in a separate table for further examination. IPOs with incomplete price information are retained in the underlying dataset rather than being assigned an assumed price of zero.
These visualizations provide an exploratory view of the retrieved records. They do not measure investment returns, dividend yield, or the probability that an IPO will perform well after listing.
Code — Cell 4
# CELL 4 - CHART DAN SCREENING

# Grafik jumlah event per sektor
if "sector" in events.columns:
    sector_counts = (
        events["sector"].fillna("Unknown")
        .value_counts()
        .head(12)
    )

    plt.figure(figsize=(10, 5))
    sector_counts.sort_values().plot(kind="barh")
    plt.title("Distribusi Corporate Events per Sektor")
    plt.xlabel("Jumlah Event")
    plt.tight_layout()
    plt.show()

# Grafik nominal dividen, dipisah berdasarkan mata uang
if not dividend_df.empty:
    div_chart = dividend_df.dropna(subset=["amount_num"]).copy()

    if not div_chart.empty:
        currency = (
            div_chart["currency"].dropna().unique()
            if "currency" in div_chart.columns else []
        )

        for cur in currency:
            subset = div_chart[
                div_chart["currency"].eq(cur)
            ].nlargest(10, "amount_num")

            if subset.empty:
                continue

            plt.figure(figsize=(10, 5))
            plt.bar(subset["ticker"].astype(str),
                    subset["amount_num"])
            plt.title(f"10 Nominal Dividen Tertinggi ({cur})")
            plt.xlabel("Ticker")
            plt.ylabel(f"Nominal dividen per saham ({cur})")
            plt.xticks(rotation=45, ha="right")
            plt.tight_layout()
            plt.show()

# Screening IPO dengan rentang harga tersedia
if not ipo_df.empty:
    priced_ipo = ipo_df.dropna(
        subset=["ipo_price_low", "ipo_price_high"]
    ).copy()

    print("IPO dengan rentang harga lengkap:", len(priced_ipo))

    if not priced_ipo.empty:
        display(
            priced_ipo[[
                c for c in [
                    "ticker", "name", "status",
                    "ipo_price_low", "ipo_price_high", "currency"
                ] if c in priced_ipo.columns
            ]].sort_values("ipo_price_low")
        )
    else:
        print(
            "Belum ada rentang harga IPO lengkap. "
            "Jangan menganggap nilai kosong sebagai harga nol."
        )
Cell 5 — Market Events Dashboard and Final Watchlists
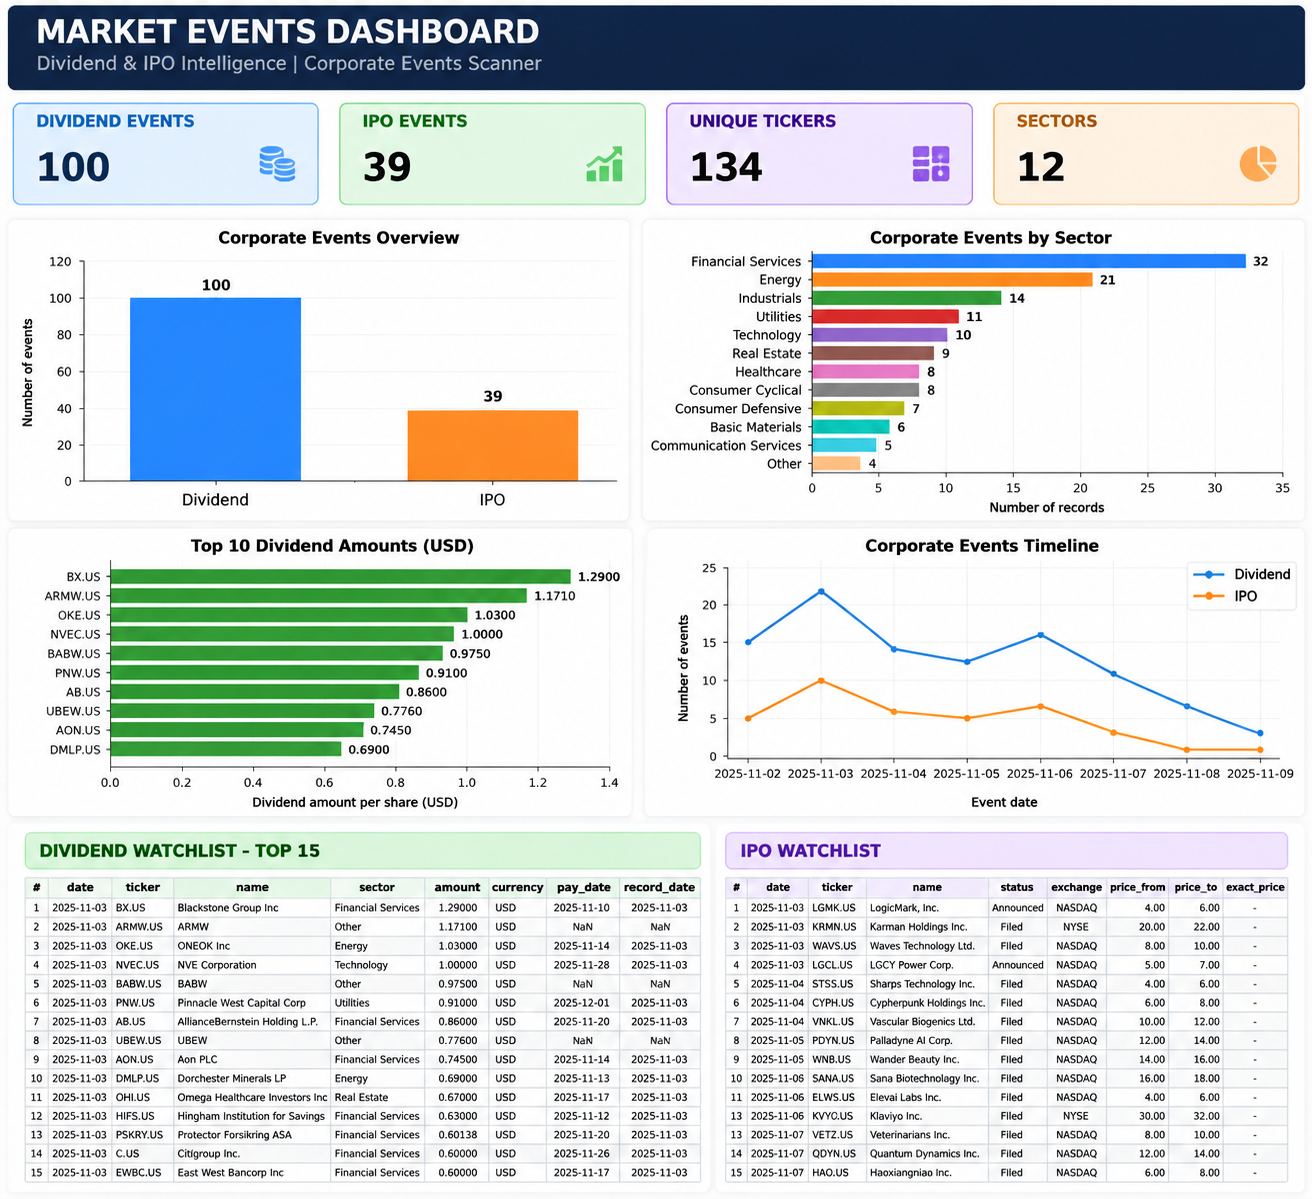
The fifth cell assembles the final dashboard. It calculates four summary indicators: the number of dividend events, the number of IPO events, the number of unique tickers, and the number of represented sectors.
The dashboard includes a comparison of dividend and IPO records, a sector distribution chart, a ranking of dividend amounts by currency, and a timeline of corporate events. It also displays separate dividend and IPO watchlists to support more detailed inspection.
The final output remains dependent on the fields returned by the API. If the event dates, ticker symbols, sector names, or dividend amounts are unavailable, the corresponding chart or table may be incomplete.
Code — Cell 5
# CELL 5 - VISUAL TRADER DASHBOARD

import matplotlib.pyplot as plt
import pandas as pd
import numpy as np
from IPython.display import display, HTML

if events.empty:
    raise ValueError("Data kosong. Jalankan Cell 1-4 terlebih dahulu.")

# Siapkan data berdasarkan kolom yang sudah tersedia
div = events[
    events["event_type"].eq("Dividend")
].copy()

ipo = events[
    events["event_type"].eq("IPO")
].copy()

div["amount_num"] = pd.to_numeric(
    div.get("amount", pd.Series(index=div.index, dtype=float)),
    errors="coerce"
)

ipo["price_low"] = pd.to_numeric(
    ipo.get("price_range_price_from",
            pd.Series(index=ipo.index, dtype=float)),
    errors="coerce"
)

ipo["price_high"] = pd.to_numeric(
    ipo.get("price_range_price_to",
            pd.Series(index=ipo.index, dtype=float)),
    errors="coerce"
)

date_col = (
    "date_clean" if "date_clean" in events.columns
    else "event_date_clean"
)

events[date_col] = pd.to_datetime(
    events[date_col], errors="coerce"
)

# Header dashboard
display(HTML("""
<div style="background:#101827;color:white;padding:22px;
border-radius:12px;margin-bottom:14px">
<h1 style="margin:0;color:white">MARKET EVENTS DASHBOARD</h1>
<p style="margin:8px 0 0;color:#cbd5e1">
Dividend & IPO Intelligence | Corporate Events Scanner
</p>
</div>
"""))

# KPI cards
total_div = len(div)
total_ipo = len(ipo)
unique_tickers = events["ticker"].nunique() if "ticker" in events else 0
unique_sectors = events["sector"].nunique() if "sector" in events else 0

display(HTML(f"""
<div style="display:flex;flex-wrap:wrap;gap:12px;margin-bottom:20px">
<div style="flex:1;min-width:145px;background:#e0f2fe;padding:16px;border-radius:10px">
<div style="color:#075985">DIVIDEND EVENTS</div>
<div style="font-size:30px;font-weight:bold;color:#0c4a6e">{total_div}</div>
</div>
<div style="flex:1;min-width:145px;background:#dcfce7;padding:16px;border-radius:10px">
<div style="color:#166534">IPO EVENTS</div>
<div style="font-size:30px;font-weight:bold;color:#14532d">{total_ipo}</div>
</div>
<div style="flex:1;min-width:145px;background:#f3e8ff;padding:16px;border-radius:10px">
<div style="color:#6b21a8">UNIQUE TICKERS</div>
<div style="font-size:30px;font-weight:bold;color:#581c87">{unique_tickers}</div>
</div>
<div style="flex:1;min-width:145px;background:#ffedd5;padding:16px;border-radius:10px">
<div style="color:#9a3412">SECTORS</div>
<div style="font-size:30px;font-weight:bold;color:#7c2d12">{unique_sectors}</div>
</div>
</div>
"""))

# Grafik 1: perbandingan jenis event
fig, ax = plt.subplots(figsize=(7, 4))
bars = ax.bar(
    ["Dividend", "IPO"],
    [total_div, total_ipo]
)
ax.bar_label(bars, padding=4, fontsize=11)
ax.set_title("Corporate Events Overview", fontsize=14)
ax.set_ylabel("Number of events")
ax.spines[["top", "right"]].set_visible(False)
plt.tight_layout()
plt.show()

# Grafik 2: distribusi sektor
if "sector" in events.columns:
    sector_data = (
        events.groupby("sector")["ticker"]
        .count()
        .sort_values()
        .tail(12)
    )

    fig, ax = plt.subplots(figsize=(10, 5))
    sector_data.plot(kind="barh", ax=ax)
    ax.set_title("Corporate Events by Sector", fontsize=14)
    ax.set_xlabel("Number of records")
    ax.set_ylabel("")
    ax.spines[["top", "right"]].set_visible(False)
    plt.tight_layout()
    plt.show()

# Grafik 3: dividen terbesar per saham
if not div.empty and div["amount_num"].notna().any():
    currencies = (
        div["currency"].dropna().unique()
        if "currency" in div.columns else []
    )

    for cur in currencies[:3]:
        subset = div[
            div["currency"].eq(cur)
        ].nlargest(10, "amount_num")

        if subset.empty:
            continue

        labels = subset["symbol"].fillna(subset["ticker"]).astype(str)

        fig, ax = plt.subplots(figsize=(10, 5))
        ax.barh(labels[::-1], subset["amount_num"].values[::-1])
        ax.set_title(f"Top 10 Dividend Amounts ({cur})", fontsize=14)
        ax.set_xlabel(f"Dividend amount per share ({cur})")
        ax.set_ylabel("Ticker")
        ax.spines[["top", "right"]].set_visible(False)
        plt.tight_layout()
        plt.show()

# Grafik 4: kalender jumlah event per tanggal
calendar_data = events.dropna(subset=[date_col]).copy()

if not calendar_data.empty:
    daily = calendar_data.groupby(date_col).size().sort_index()

    fig, ax = plt.subplots(figsize=(11, 4))
    ax.plot(daily.index, daily.values, marker="o")
    ax.set_title("Corporate Events Timeline", fontsize=14)
    ax.set_xlabel("Event date")
    ax.set_ylabel("Number of records")
    ax.grid(True, alpha=0.25)
    plt.xticks(rotation=45, ha="right")
    plt.tight_layout()
    plt.show()

# Tabel watchlist dividen
print("DIVIDEND WATCHLIST - TOP 15")
div_cols = [
    c for c in [
        "date", "ticker", "name", "sector",
        "amount", "currency", "pay_date", "record_date"
    ] if c in div.columns
]
display(
    div.sort_values("amount_num", ascending=False)[div_cols].head(15)
    if not div.empty else pd.DataFrame()
)

# Tabel watchlist IPO
print("IPO WATCHLIST")
ipo_cols = [
    c for c in [
        "date", "ticker", "name", "status", "exchange",
        "price_range_price_from", "price_range_price_to",
        "price_range_exact_price", "currency"
    ] if c in ipo.columns
]
display(
    ipo[ipo_cols].head(25)
    if not ipo.empty else pd.DataFrame()
)

print(
    "Dashboard selesai. Nominal dividen bukan dividend yield; "
    "diperlukan harga saham untuk menghitung yield."
)
Result:
3. Results and Discussion
3.1. Dividend Event Analysis
The dividend analysis module organizes available dividend records into a watchlist that includes company identifiers, sectors, dividend amounts, currencies, and relevant dates. The ranking of dividend amounts provides a preliminary comparison of the nominal distributions reported by different companies.
However, dividend amount and dividend yield are different financial measures. Dividend yield requires the dividend amount to be compared with the corresponding share price. Therefore, the framework does not establish which stock offers the highest dividend yield unless reliable price data are added.
The usefulness of the dividend watchlist also depends on the availability of ex-dividend dates, payment dates, and record dates. These dates should be checked against the original company announcements or other authoritative financial sources before an investor makes a decision.
3.2. IPO Event Screening
The IPO module organizes records according to available issuer information, ticker symbols, exchanges, offering statuses, and price ranges. The screening process identifies records containing both lower and upper price estimates, making it easier to review IPOs with more complete pricing information.
This approach helps distinguish records with usable price-range information from those requiring further investigation. Missing price fields are treated as unavailable rather than being interpreted as zero.
Nevertheless, the existence of an IPO price range does not establish whether the offering is attractively valued. Additional analysis would be needed to evaluate the issuer's financial performance, valuation, business model, competitive position, and associated risks.
3.3. Corporate Event Distribution by Sector
The sector distribution chart summarizes the number of retrieved dividend and IPO records associated with each sector. This visualization provides an overview of how the available events are distributed across the represented industries.
The chart can help analysts identify sectors with relatively large numbers of records during the selected period. However, a greater number of events does not necessarily indicate stronger financial performance, higher expected returns, or better investment opportunities.
The interpretation also depends on the completeness of sector classifications. Records with missing sector information may be excluded or grouped differently, depending on the relevant processing step.
3.4. Corporate Event Timeline
The corporate event timeline aggregates records by date and displays the number of events recorded on each date. It offers a chronological overview of the events contained in the dataset.
This visualization can support the organization of a monitoring schedule, particularly when the analysis is configured to retrieve upcoming events. For practical monitoring, the analysis period should be updated regularly and the dates should be checked against the API's definitions of event dates.
The timeline represents the records returned by the API, not necessarily every corporate event occurring in the market. Incomplete API coverage or unavailable dates may affect the resulting distribution.
3.5. Limitations and Future Improvements
Several limitations should be considered when using the framework.
First, the example period, November 2–9, 2025, is historical. It must be changed to the relevant analysis period before the system is used to monitor upcoming events.
Second, the implementation relies on API field names such as date, ticker, amount, sector, and price_range_price_from. If the API returns different field names, some analytical steps may require adjustment. In particular, the normalization function creates event_date_clean, while the subsequent analysis also expects a date field. The actual response structure should be verified before execution.
Third, the original script requests the RapidAPI key in both the initial setup and the retrieval cell. When running the notebook sequentially, the authentication flow should be consolidated to avoid unnecessary repeated input.
Fourth, dividend rankings are based on nominal amounts rather than dividend yields, and IPO price screening does not constitute a valuation assessment. Future development could incorporate historical prices, dividend yields, market capitalization, financial ratios, offering details, and more extensive data validation.
These improvements would make the framework more suitable for systematic corporate event monitoring while preserving the distinction between descriptive information and investment recommendations.
4. Conclusion
Market Events Analyzer demonstrates how Python can be used to retrieve, organize, analyze, and visualize dividend and IPO events through the MarketFlow All-in-One Market Finance API.
The framework integrates API communication, JSON normalization, dividend and IPO watchlists, dividend amount rankings, IPO price-range screening, sector distribution charts, and a corporate event timeline. By combining these functions, it provides a structured workflow for preliminary corporate event research.
Nevertheless, the reliability of the resulting analysis depends on API coverage, field definitions, date selection, and the completeness of the returned records. Dividend amounts should not be confused with dividend yields, and IPO price ranges should not be treated as evidence of future investment performance.
Future improvements should prioritize consistent API authentication, flexible event-date handling, automatic pagination, stronger data validation, and integration of relevant price and financial data. With these enhancements, Market Events Analyzer could serve as a useful foundation for more comprehensive financial market monitoring.