
Stock market analysis requires a combination of technical indicators and market behavior analysis to evaluate investment opportunities. Price movement alone cannot fully describe market conditions because investor decisions are also influenced by trend direction, return performance, foreign investor activity, and stock risk characteristics.
This project develops an Indonesia Stock Analyzer System using IDX API data processing. The system integrates historical stock price data, technical indicators, foreign flow analysis, and a scoring mechanism to generate a structured stock evaluation.
The developed system analyzes several important parameters:
Historical price movement
Moving average trend
Stock return performance
Price volatility
Foreign buying and selling activity
Investment score classification
The objective of this project is to transform raw stock market data into a simplified analytical report that can support investors in understanding stock conditions before conducting further analysis.
The system is implemented using Python with API integration, Pandas for data processing, NumPy for numerical calculation, and Matplotlib for data visualization.
Implementation
The first stage of the system initializes the required libraries and configures the IDX RapidAPI connection. The API configuration defines the authentication header and stock parameters used in the analysis. In this project, the analyzed stock symbol is BBCA with a historical observation period of 7 days.
Cell 1 — Library Installation and API Setup
!pip install pandas numpy matplotlib requests -q

import requests
import pandas as pd
import numpy as np
import matplotlib.pyplot as plt


API_KEY = "YOUR_API_KEY"


HEADERS = {
    "Content-Type": "application/json",
    "x-rapidapi-host": "indonesia-stock-exchange-idx.p.rapidapi.com",
    "x-rapidapi-key": API_KEY
}


symbol = "BBCA"

days = 7
The second stage retrieves historical stock price data from IDX API. The obtained chart data is converted into a Pandas DataFrame, where date values are transformed into datetime format and numerical variables such as open, high, low, close, volume, foreign buy, foreign sell, and transaction value are converted into numeric format for analysis.
Cell 2 — Historical Stock Price Data Processing
url = f"https://indonesia-stock-exchange-idx.p.rapidapi.com/api/chart/{symbol}/daily/latest?limit=100"


response = requests.get(
    url,
    headers=HEADERS
)


result = response.json()


df = pd.DataFrame(
    result["data"]["data"]["chartbit"]
)


df["date"] = pd.to_datetime(df["date"])


df = df.sort_values("date")


columns_numeric = [
    "open",
    "high",
    "low",
    "close",
    "volume",
    "foreignbuy",
    "foreignsell",
    "value"
]


for col in columns_numeric:

    df[col] = pd.to_numeric(df[col])


df.head()
The third stage performs technical trend analysis. The system calculates daily return, Moving Average 20 (MA20), Moving Average 50 (MA50), total return performance, and volatility. The moving average indicators are used to evaluate the relationship between short-term and long-term price trends, while volatility represents stock price fluctuation risk.
The system also generates a price trend visualization by comparing closing prices with MA20 and MA50 indicators. This visualization helps identify whether the stock movement follows an increasing, decreasing, or uncertain trend.
Cell 3 — Price Trend and Technical Indicator Analysis
if "daily_return" not in df.columns:

    df["daily_return"] = (
        df["close"].pct_change() * 100
    )


df["MA20"] = (
    df["close"]
    .rolling(window=20)
    .mean()
)


df["MA50"] = (
    df["close"]
    .rolling(window=50)
    .mean()
)


return_total = (

    (df["close"].iloc[-1] -
     df["close"].iloc[0])

    /

    df["close"].iloc[0]

) * 100


volatility = (

    df["daily_return"]

    .std()

)
The fourth stage analyzes foreign investor activity. The system calculates net foreign flow by subtracting foreign selling value from foreign buying value. The last seven trading days are evaluated to determine whether foreign investors show accumulation, distribution, or neutral behavior.
A positive net foreign flow indicates higher foreign buying activity, while a negative value indicates stronger foreign selling pressure. The result is visualized using a foreign net flow chart to observe daily foreign investor movement.
Cell 4 — Foreign Flow and Accumulation Distribution Analysis
df["foreign_net"] = (
    df["foreignbuy"]
    -
    df["foreignsell"]
)


foreign_7d = df.tail(7).copy()


total_buy_7d = foreign_7d["foreignbuy"].sum()

total_sell_7d = foreign_7d["foreignsell"].sum()

net_foreign_7d = foreign_7d["foreign_net"].sum()


if net_foreign_7d > 0:

    foreign_signal = "AKUMULASI ASING"


elif net_foreign_7d < 0:

    foreign_signal = "DISTRIBUSI ASING"


else:

    foreign_signal = "NETRAL"
The final stage combines all analytical indicators into an investment scoring model. The system evaluates four main components:
Price trend
Return performance
Foreign flow condition
Volatility risk
Each positive indicator increases the investment score. The final score is used to classify stock conditions into positive, neutral, or cautious categories.
Cell 5 — Final Stock Analysis Score and Recommendation
score = 0


if df["MA20"].iloc[-1] > df["MA50"].iloc[-1]:

    trend_signal = "BULLISH"

    score += 1

else:

    trend_signal = "BEARISH"


if return_total > 0:

    return_signal = "POSITIF"

    score += 1

else:

    return_signal = "NEGATIF"


if net_foreign_7d > 0:

    foreign_score = "AKUMULASI ASING"

    score += 1

elif net_foreign_7d < 0:

    foreign_score = "DISTRIBUSI ASING"

else:

    foreign_score = "NETRAL"


if volatility < 3:

    risk_signal = "RISIKO RENDAH"

else:

    risk_signal = "RISIKO TINGGI"
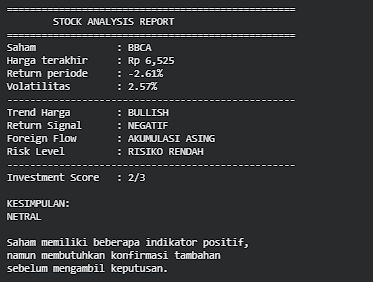
The final output generates a stock analysis report containing the latest price, return performance, volatility, trend signal, foreign flow condition, risk level, and investment score. The automatic conclusion classifies the stock condition as positive, neutral, or cautious depending on the obtained score.
Conclusion
This project successfully developed an Indonesia Stock Analyzer System using IDX API integration to analyze stock market conditions based on technical indicators, foreign investor activity, and investment scoring.
The system successfully processes historical stock price data into meaningful indicators including moving averages, return performance, volatility, and foreign net flow. By combining these indicators, the system provides a structured evaluation of stock conditions.
The scoring mechanism allows the system to classify stock conditions into positive, neutral, or cautious categories. This approach provides investors with a simplified overview of market behavior and potential risks.
However, the generated analysis should not be considered as an automatic investment recommendation. Further evaluation using company fundamentals, valuation analysis, financial performance, and broader market conditions is still required before making investment decisions.
Overall, this project demonstrates the application of API-based financial data processing and Python analytics to develop an automated stock market analysis framework.