
Building an IDX Broker and Bonus Calendar Dashboard Using Python
Monitoring market activity often involves looking at more than stock prices alone. Investors frequently review broker transaction activity to understand market participation and trading behavior. At the same time, corporate action information such as bonus share distributions can provide additional context regarding company decisions that may affect shareholders.
Top Brokers data helps identify which brokers are the most active based on trading value, while Bonus Calendar data provides information regarding bonus share events listed on the Indonesia Stock Exchange. Combining both datasets into a single dashboard can help users review market activity and corporate actions more efficiently.
In this project, we build an IDX Broker and Bonus Calendar Dashboard using Python and the Indonesia Stock Exchange API. The notebook retrieves Top Brokers data and Bonus Calendar data, processes the responses, and displays the information through a simple dashboard interface.
The notebook is divided into five main sections. The first section imports the required libraries, followed by API configuration, helper functions, data retrieval, and dashboard generation.
What This Project Builds
This project creates an IDX Broker and Bonus Calendar Dashboard that combines:
Top Brokers data
Bonus Calendar data
Structured dataframe output
Broker activity monitoring
Corporate action monitoring
By combining both datasets into a single workflow, users can review broker activity and bonus share information through one dashboard.
CELL 1 — Import Libraries
import requests
import pandas as pd
import time
from IPython.display import display, Markdown

pd.set_option("display.max_columns", None)
pd.set_option("display.max_colwidth", 100)
pd.set_option("display.width", 1000)
Explanation
The project begins by importing the required libraries.
The requests library is used to communicate with the IDX API, while pandas is used to process and display structured data. The time library is used to create delays between API requests, and display together with Markdown is used to create a cleaner dashboard presentation inside Google Colab.
The notebook also configures pandas display settings to allow all available columns to be displayed more clearly and prevent excessive truncation when reviewing API responses.
CELL 2 — API Configuration
BASE_URL = "https://indonesia-stock-exchange-idx.p.rapidapi.com"

HEADERS = {
    "Content-Type": "application/json",
    "x-rapidapi-host": "indonesia-stock-exchange-idx.p.rapidapi.com",
    "x-rapidapi-key": "Your_api_Key"
}
Explanation
Cell 2 contains the API configuration used throughout the notebook.
The BASE_URL variable stores the IDX API endpoint, while HEADERS contains the request configuration required for communication with the API service.
These settings are reused whenever the notebook requests Top Brokers data and Bonus Calendar data.
CELL 3 — Helper Functions
def fetch_api(endpoint, retries=3, delay=5):
    url = BASE_URL + endpoint

    for attempt in range(retries):
        try:
            response = requests.get(url, headers=HEADERS, timeout=30)

            if response.status_code == 200:
                return response.json()

            elif response.status_code == 429:
                print(f"Rate limit terkena. Menunggu {delay} detik...")
                time.sleep(delay)
                delay *= 2

            else:
                print(f"Error {response.status_code}: {response.text}")
                return None

        except Exception as e:
            print(f"Request error: {e}")
            time.sleep(delay)

    return None


def extract_list(data):
    if data is None:
        return []

    if isinstance(data, list):
        return data

    if isinstance(data, dict):
        possible_keys = [
            "data", "result", "results", "items", "list",
            "brokers", "bonus", "bonusCalendar"
        ]

        for key in possible_keys:
            if key in data:
                value = data[key]

                if isinstance(value, list):
                    return value

                if isinstance(value, dict):
                    for sub_key in possible_keys:
                        if sub_key in value and isinstance(value[sub_key], list):
                            return value[sub_key]

                    return [value]

        return [data]

    return []
Explanation
Cell 3 creates helper functions used throughout the project.
The fetch_api() function retrieves data from the IDX API. The function includes retry handling and rate-limit management so the notebook can continue attempting requests if temporary issues occur.
The extract_list() function is designed to extract list-based data from different API response structures. This allows the notebook to process Top Brokers data and Bonus Calendar data more consistently.
CELL 4 — Retrieve Data
display(Markdown("## 📥 Fetching Data from IDX API"))

top_brokers_raw = fetch_api(
    "/api/market-detector/top-broker?marketType=MARKET_TYPE_ALL&period=TB_PERIOD_LAST_1_DAY&order=ORDER_BY_ASC&sort=TB_SORT_BY_TOTAL_VALUE"
)

time.sleep(5)

bonus_calendar_raw = fetch_api("/api/calendar/bonus")

display(Markdown("✅ Data retrieval completed"))
Explanation
Cell 4 is used to retrieve the main data required for the dashboard.
The notebook begins by displaying a message that indicates the data retrieval process is starting. After that, it requests Top Brokers data from the IDX API using the market detector endpoint.
The request uses several parameters directly inside the endpoint, including market type, period, order, and sorting by total trading value. This allows the notebook to retrieve broker activity data based on trading value.
After retrieving the Top Brokers data, the notebook waits for five seconds using time.sleep(5). This delay helps reduce the possibility of hitting the API rate limit.
The second request retrieves Bonus Calendar data from the IDX API. This data is stored in bonus_calendar_raw and later processed in the dashboard section.
Once both API requests are completed, the notebook displays a message confirming that the data retrieval process has finished.
CELL 5 — Dashboard Output
display(Markdown("# 📊 IDX Broker and Bonus Calendar Dashboard"))
display(Markdown("Dashboard sederhana untuk membaca data Top Brokers dan Bonus Calendar dari Bursa Efek Indonesia."))

# =========================
# Top Brokers
# =========================
display(Markdown("## 🏆 Top Brokers by Trading Value"))

brokers = extract_list(top_brokers_raw)

if brokers:
    df_brokers = pd.json_normalize(brokers)

    numeric_cols = ["total_value", "totalValue", "value", "buy_value", "sell_value", "net_value"]

    for col in numeric_cols:
        if col in df_brokers.columns:
            df_brokers[col] = pd.to_numeric(df_brokers[col], errors="coerce")

    sort_candidates = ["total_value", "totalValue", "value"]

    for col in sort_candidates:
        if col in df_brokers.columns:
            df_brokers = df_brokers.sort_values(by=col, ascending=False)
            break

    display(Markdown(f"Jumlah broker yang berhasil ditampilkan: **{len(df_brokers)} broker**"))
    display(df_brokers.head(20))

else:
    display(Markdown("Tidak ada data Top Brokers."))


# =========================
# Bonus Calendar
# =========================
display(Markdown("## 🎁 Bonus Calendar"))

bonus_data = extract_list(bonus_calendar_raw)

if bonus_data:
    df_bonus = pd.json_normalize(bonus_data)

    selected_cols = [
        col for col in df_bonus.columns
        if any(keyword in col.lower() for keyword in [
            "symbol", "company", "date", "ratio", "bonus", "share", "cum", "ex", "record"
        ])
    ]

    if selected_cols:
        df_bonus = df_bonus[selected_cols]

    display(Markdown(f"Jumlah data Bonus Calendar yang berhasil ditampilkan: **{len(df_bonus)} data**"))
    display(df_bonus)

else:
    display(Markdown("Tidak ada data Bonus Calendar."))


display(Markdown("✅ Dashboard berhasil dibuat."))
Explanation
Cell 5 builds the final IDX Broker and Bonus Calendar Dashboard.
The dashboard begins by displaying the main title and a short description explaining that the dashboard is designed to read Top Brokers data and Bonus Calendar data from the Indonesia Stock Exchange.
The first section focuses on Top Brokers by Trading Value. The notebook extracts broker data from top_brokers_raw using the extract_list() function. If broker data is available, the response is converted into a dataframe using pd.json_normalize().
After that, several numeric columns such as total_value, buy_value, sell_value, and net_value are converted into numeric format. This allows the notebook to sort the data correctly based on trading value.
The notebook then checks available sorting candidates, including total_value, totalValue, and value. If one of these columns exists, the dataframe is sorted in descending order. This makes the highest-value brokers appear first.
The dashboard then displays the total number of brokers retrieved and shows the first 20 broker records.
If no broker data is available, the notebook displays a message indicating that there is no Top Brokers data.
The second section focuses on Bonus Calendar data. The notebook extracts bonus calendar data from bonus_calendar_raw using the same extract_list() helper function. If data is available, it is converted into a dataframe.
The notebook then filters columns related to symbol, company, date, ratio, bonus, share, cum date, ex date, and record date. This makes the displayed Bonus Calendar table more focused and easier to read.
After that, the dashboard displays the total number of Bonus Calendar records and shows the resulting dataframe.
If no Bonus Calendar data is available, the notebook displays a message indicating that there is no Bonus Calendar data.
At the end, the notebook displays a confirmation message indicating that the dashboard has been successfully created.
Result:
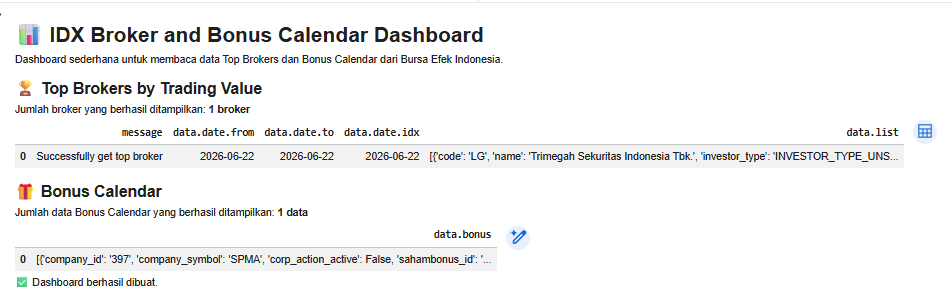
Dashboard Output
Top Brokers by Trading Value
The dashboard displays broker activity data based on trading value.
If broker data is available, the notebook shows the total number of brokers retrieved and displays the top 20 brokers after sorting the data by value-related columns.
This section helps users review which brokers are the most active based on trading value.
Bonus Calendar
The dashboard also displays Bonus Calendar information from the Indonesia Stock Exchange.
If bonus data is available, the notebook displays selected columns related to company symbols, company names, dates, ratios, bonus information, shares, and relevant corporate action dates.
This section helps users monitor bonus share information in a structured dataframe format.
Overall Workflow
Import the required libraries.
Configure IDX API access.
Create helper functions for API retrieval and list extraction.
Retrieve Top Brokers data.
Retrieve Bonus Calendar data.
Convert API responses into dataframes.
Sort Top Brokers data by trading value.
Filter important Bonus Calendar columns.
Display both datasets through a dashboard interface.
Why This Project Matters
Broker activity and corporate action information are useful components of market monitoring.
Top Brokers data helps users identify which brokers are the most active based on trading value, while Bonus Calendar data helps users monitor bonus share-related corporate actions.
By combining both datasets into one dashboard, users can review broker activity and bonus calendar information in a single workflow.
Conclusion
The IDX Broker and Bonus Calendar Dashboard demonstrates how Python can be used to retrieve, process, and display Top Brokers data and Bonus Calendar data from the Indonesia Stock Exchange API.
The notebook combines broker activity and corporate action information into a simple dashboard, making the data easier to read and review in Google Colab.