
Investment analysis requires a comprehensive approach that considers not only stock price movement but also corporate actions, dividend opportunities, and macroeconomic conditions. Investors need structured information to evaluate potential income opportunities, market conditions, and external factors that may influence stock performance.
This project develops an IDX Market Intelligence Analysis System using Indonesia Stock Exchange API data to analyze corporate actions and market indicators. The system integrates several analytical components:
Dividend calendar analysis
Right issue monitoring
Dividend yield ranking
Forex IDR impact analysis
Automated market intelligence dashboard
The objective of this system is to transform raw IDX API responses into structured investment information. The analyzer processes corporate action data, evaluates dividend attractiveness, analyzes currency conditions, and generates a summarized market intelligence report.
The system is developed using Python with several analytical libraries including Requests for API communication, Pandas for data processing, Matplotlib for visualization, and Excel export functionality for reporting. The project uses IDX RapidAPI as the main data source for retrieving market information.
The first stage prepares the analysis environment by installing required libraries and configuring the IDX RapidAPI connection. The system defines the API key, base URL, and authentication headers required to access IDX market data.
The second stage creates a reusable API request function. This function allows the system to retrieve different datasets by sending endpoint requests and returning JSON responses. In this project, the system collects dividend calendar data and right issue information from IDX API endpoints.
The dividend dataset provides information related to company dividend events, while the right issue dataset provides corporate action information that may affect shareholder value and capital structure.
Cell 1 — Library and API Configuration
import requests
import pandas as pd
import matplotlib.pyplot as plt
import seaborn as sns


API_KEY = "YOUR_API_KEY"


BASE_URL = "https://indonesia-stock-exchange-idx.p.rapidapi.com"


headers = {
    "Content-Type": "application/json",
    "x-rapidapi-host": "indonesia-stock-exchange-idx.p.rapidapi.com",
    "x-rapidapi-key": API_KEY
}


print("API Connected Setup")
This stage establishes the connection between Python and IDX API services for collecting market intelligence data.
The third stage converts raw API responses into structured analytical datasets. The system applies JSON normalization to transform nested API responses into Pandas DataFrames.
Dividend data is extracted into a dividend dataset, while right issue information is converted into a separate dataset for further evaluation.
The cleaned datasets allow the system to perform numerical calculations and ranking analysis.
Cell 2 — Fetch Corporate Action Data
def get_api(endpoint):

    url = BASE_URL + endpoint

    response = requests.get(
        url,
        headers=headers
    )

    print(
        endpoint,
        "Status:",
        response.status_code
    )

    return response.json()


dividend_data = get_api(
    "/api/calendar/dividend"
)


right_issue_data = get_api(
    "/api/calendar/right-issue"
)


display(dividend_data)

display(right_issue_data)
This module retrieves dividend and right issue information from IDX API.
The fourth stage performs Forex IDR Impact Analysis. The system processes currency information to understand market conditions and identify potential beneficiaries based on foreign exchange movement.
The analysis extracts:
Currency symbol
Currency name
Market summary
Current beneficiary sector
The result is converted into a structured summary table for easier interpretation.
Cell 3 — Data Cleaning and Forex Analysis
dividend_df = pd.json_normalize(
    dividend_data["data"]["data"]["dividend"]
)


right_issue_df = pd.json_normalize(
    right_issue_data["data"]
)


forex_df = pd.json_normalize(
    forex_data
)


display(dividend_df.head())

display(forex_df)
This process prepares market datasets for further analytical calculations.
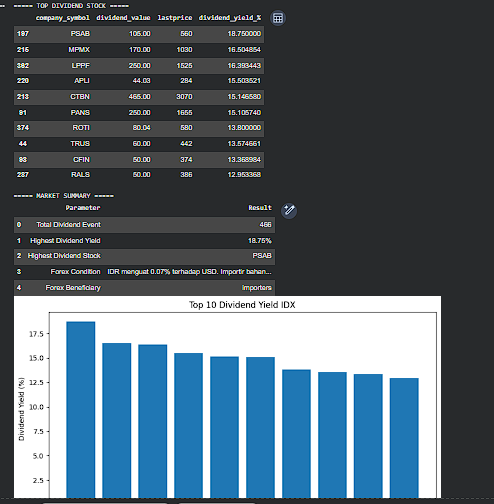
The fifth stage develops the Investment Intelligence Dashboard. The system calculates dividend yield using dividend value divided by stock last price.
The dividend ranking process sorts companies based on dividend yield percentage to identify stocks with higher dividend attractiveness.
The formula applied is:
Dividend Yield (%) = Dividend Value / Last Price × 100
The system then generates a market summary containing:
Total dividend events
Highest dividend yield
Highest dividend stock
Forex condition
Forex beneficiary
Cell 4 — Dividend Ranking and Market Summary
dividend_analysis = dividend_df.copy()


dividend_analysis["dividend_value"] = pd.to_numeric(
    dividend_analysis["dividend_value"],
    errors="coerce"
)


dividend_analysis["lastprice"] = pd.to_numeric(
    dividend_analysis["lastprice"],
    errors="coerce"
)


dividend_analysis["dividend_yield_%"] = (
    dividend_analysis["dividend_value"]
    /
    dividend_analysis["lastprice"]
    *
    100
)


dividend_rank = dividend_analysis.sort_values(
    "dividend_yield_%",
    ascending=False
)


display(
    dividend_rank.head(10)
)
This module ranks dividend opportunities based on calculated dividend yield.
The final stage creates visualization and exports the analysis results into an Excel dashboard.
The visualization displays the top ten dividend yield stocks using a bar chart. This provides a quick comparison of dividend attractiveness among listed companies.
The exported Excel file contains three main sheets:
Dividend Analysis
Forex Analysis
Dashboard
Cell 5 — Dashboard Visualization and Export
top10 = dividend_rank.head(10)


plt.figure(figsize=(10,5))


plt.bar(
    top10["company_symbol"],
    top10["dividend_yield_%"]
)


plt.title(
    "Top 10 Dividend Yield IDX"
)


plt.xlabel(
    "Stock"
)


plt.ylabel(
    "Dividend Yield (%)"
)


plt.xticks(rotation=45)


plt.show()


file_name = "IDX_Market_Intelligence_Analysis.xlsx"


with pd.ExcelWriter(file_name) as writer:

    dividend_analysis.to_excel(
        writer,
        sheet_name="Dividend Analysis",
        index=False
    )


    forex_analysis.to_excel(
        writer,
        sheet_name="Forex Analysis",
        index=False
    )


    market_summary.to_excel(
        writer,
        sheet_name="Dashboard",
        index=False
    )


print(
    f"{file_name} berhasil dibuat"
)
This final module converts analytical results into a visual and downloadable investment intelligence report.
Conclusion
This project successfully developed an IDX Market Intelligence Analysis System using IDX API data to evaluate corporate actions, dividend opportunities, and macroeconomic impact.
The system integrates dividend calendar analysis, right issue monitoring, forex impact evaluation, and dividend yield ranking into a structured analytical workflow. The dividend analysis module identifies companies with attractive dividend yield potential, while forex analysis provides additional market context related to currency conditions and sector beneficiaries.
The automated dashboard improves data interpretation by presenting market summaries and visual comparisons. The exported Excel report allows users to store and analyze dividend, forex, and dashboard information in a structured format.
However, dividend yield analysis should not be used as the only investment decision factor. Investors should also consider company fundamentals, financial performance, valuation, dividend sustainability, and overall market conditions.
Overall, the IDX Market Intelligence Analysis System demonstrates how API-based financial analytics can support systematic investment research and improve the efficiency of processing stock market information.