Stock market decision-making requires a structured approach that combines market participant behavior, sector movement, and market sentiment indicators. Relying only on price movement may provide limited information because stock performance can also be influenced by accumulation activity, sector rotation, and investor sentiment toward new market opportunities.
This project develops an IDX Trader Intelligence Dashboard using Indonesia Stock Exchange API data to evaluate stock conditions through multiple market intelligence indicators. The system integrates:
Bandar accumulation analysis
Sector rotation analysis
IPO momentum analysis
Trader scoring engine
Visual intelligence dashboard
The objective of this system is to transform IDX market data into a simplified trader intelligence framework. The system evaluates several market signals and converts them into a numerical score to provide an overall trading bias.
The analyzer is implemented using Python with API integration, Pandas for data processing, Requests for API communication, and Matplotlib for visualization. The selected stock analyzed in this project is BUMI with a seven-day observation period.
The first stage prepares the analytical environment by installing required libraries and configuring the IDX RapidAPI connection. The system defines the API key, base URL, request headers, stock symbol, and analysis period.
Cell 1 — API Setup and Library Configuration
import requests
import pandas as pd
import json
import matplotlib.pyplot as plt
from tabulate import tabulate


API_KEY = "YOUR_API_KEY"


BASE_URL = "https://indonesia-stock-exchange-idx.p.rapidapi.com"


HEADERS = {
    "Content-Type": "application/json",
    "x-rapidapi-host": "indonesia-stock-exchange-idx.p.rapidapi.com",
    "x-rapidapi-key": API_KEY
}


SYMBOL = "BUMI"

DAYS = 7


print("IDX Trader Intelligence System Ready")
print("Stock :", SYMBOL)
This stage establishes the connection between Python and IDX API services for collecting market intelligence data.
The second stage retrieves bandar accumulation data. The system accesses the IDX bandar accumulation endpoint using the selected stock symbol and observation period. The collected information is used to evaluate potential accumulation behavior from market participants.
Cell 2 — Bandar Accumulation Analysis
def get_bandarmology(symbol, days=7):

    url = (
        f"{BASE_URL}/api/analysis/"
        f"bandar/accumulation/{symbol}"
    )


    params = {
        "days": days
    }


    r = requests.get(
        url,
        headers=HEADERS,
        params=params
    )


    return r.json()


bandar = get_bandarmology(
    SYMBOL,
    DAYS
)


print(
    json.dumps(
        bandar,
        indent=2
    )
)
This module provides market participant activity information that becomes one of the main components in the trader scoring system.
The third stage analyzes broader market sentiment through sector rotation and IPO momentum indicators. Sector rotation analysis identifies market sector movement, while IPO momentum provides additional sentiment information related to new market opportunities.
The system retrieves both datasets through IDX API endpoints before converting the results into scoring parameters.
Cell 3 — Sector Rotation and IPO Momentum Analysis
def get_sector_rotation():

    url = (
        BASE_URL +
        "/api/analysis/retail/sector-rotation"
    )


    r = requests.get(
        url,
        headers=HEADERS
    )


    return r.json()


def get_ipo_momentum():

    url = (
        BASE_URL +
        "/api/analysis/sentiment/ipo/momentum"
    )


    r = requests.get(
        url,
        headers=HEADERS
    )


    return r.json()


sector = get_sector_rotation()

ipo = get_ipo_momentum()
This stage expands stock analysis by incorporating market-wide sentiment factors.
The fourth stage develops the Trader Scoring Engine. The system converts qualitative market signals into numerical scores.
The scoring mechanism starts from a baseline value and adjusts the score based on detected keywords:
Positive indicators:
Strong
Accumulation
Bullish
Negative indicators:
Distribution
Bearish
Each component receives an individual score:
Bandar score
Sector score
IPO score
The final score is calculated using weighted parameters:
Bandar contribution: 50%
Sector contribution: 30%
IPO contribution: 20%
Cell 4 — Trader Scoring Engine
def extract_score(data):

    text = json.dumps(data).lower()


    score = 50


    if "strong" in text:

        score += 20


    if "accumulation" in text:

        score += 15


    if "bullish" in text:

        score += 10


    if "distribution" in text:

        score -= 20


    if "bearish" in text:

        score -= 15


    return max(
        0,
        min(score,100)
    )


bandar_score = extract_score(bandar)

sector_score = extract_score(sector)

ipo_score = extract_score(ipo)


final_score = round(

    bandar_score*0.5 +

    sector_score*0.3 +

    ipo_score*0.2,

    2

)
This scoring engine transforms multiple market indicators into a simplified trader intelligence score.
The final stage creates the trader intelligence dashboard. The system classifies the final score into four trading bias categories:
Strong Bullish
Accumulation Watch
Neutral
High Risk
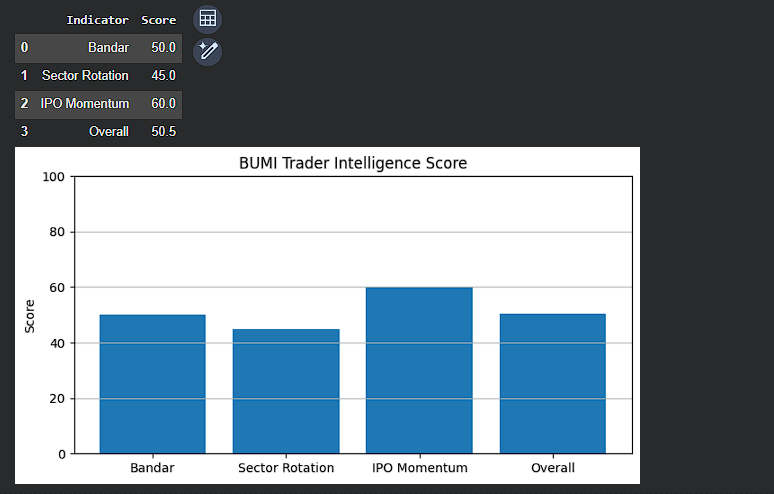
The dashboard displays the score breakdown from each indicator and provides a visual comparison using a bar chart.
The visualization module presents:
Bandar score
Sector rotation score
IPO momentum score
Overall trader intelligence score
Cell 5 — Trader Intelligence Dashboard
df = pd.DataFrame({

    "Indicator":[
        "Bandar",
        "Sector Rotation",
        "IPO Momentum",
        "Overall"
    ],


    "Score":[
        bandar_score,
        sector_score,
        ipo_score,
        final_score
    ]

})


display(df)


plt.figure(figsize=(8,4))


plt.bar(
    df["Indicator"],
    df["Score"]
)


plt.ylim(
    0,
    100
)


plt.title(
    f"{SYMBOL} Trader Intelligence Score"
)


plt.ylabel(
    "Score"
)


plt.grid(
    axis="y"
)


plt.show()
This dashboard provides a visual summary of stock intelligence conditions based on multiple market indicators.
Conclusion
This project successfully developed an IDX Trader Intelligence Dashboard using IDX API integration to evaluate stock conditions through bandar accumulation, sector rotation, and IPO momentum analysis.
The system combines different market intelligence sources into a weighted scoring framework. Bandar accumulation represents market participant activity, sector rotation provides broader market direction, and IPO momentum contributes additional sentiment information.
The Trader Scoring Engine converts qualitative market signals into numerical values and generates an overall trading bias. The dashboard visualization simplifies interpretation by displaying individual indicator scores and final intelligence results.
However, this system should be considered as an analytical support tool rather than a direct investment recommendation. Additional evaluation using financial fundamentals, valuation analysis, technical indicators, and market risk assessment remains necessary.
Overall, the IDX Trader Intelligence Dashboard demonstrates how API-based financial analytics can support structured stock screening and improve data-driven market analysis.