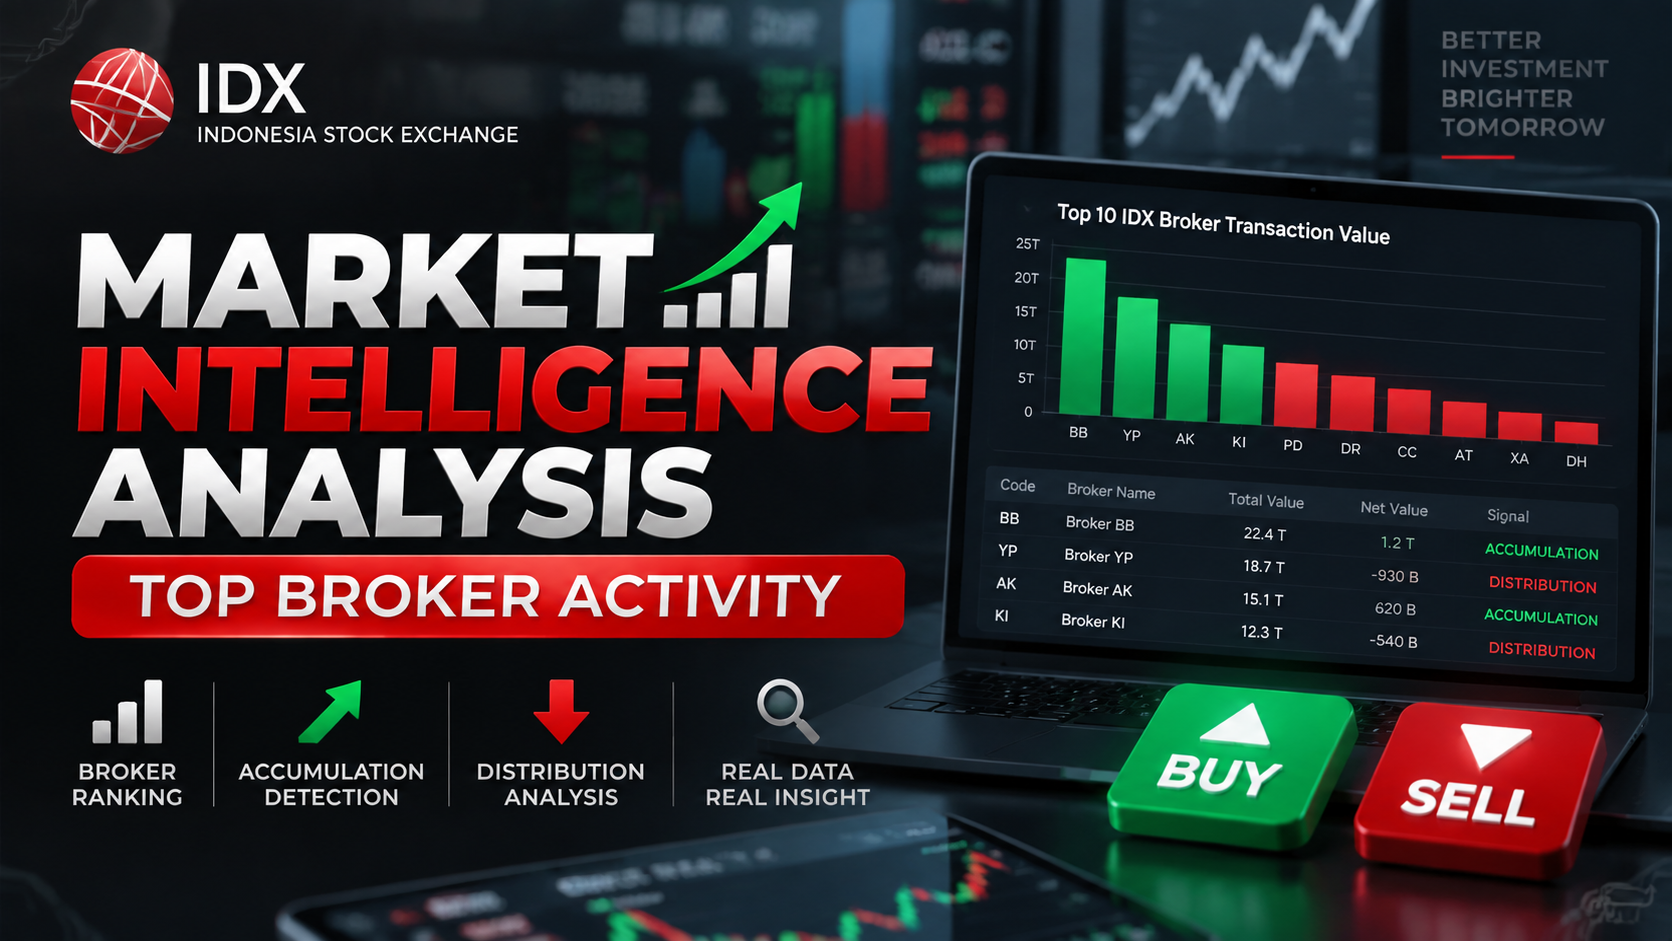
Understanding broker activity is an important aspect of stock market analysis because transaction behavior from market participants can provide additional insight into buying pressure, selling pressure, and market participation intensity. Stock movement is not only influenced by price changes but also by transaction concentration and broker activity distribution.
This project develops an IDX Market Intelligence Analysis System using Indonesia Stock Exchange API data to analyze broker transaction activity. The system focuses on identifying the most active brokers based on transaction value and evaluating simple accumulation or distribution signals.
The main objectives of this system are:
Retrieve top broker transaction data from IDX API
Process and clean broker transaction datasets
Rank brokers based on transaction value
Identify accumulation or distribution signals
Visualize the top broker activity using a transaction chart
The system is developed using Python with several analytical libraries including Requests for API communication, Pandas for data processing, NumPy for numerical operations, and Matplotlib for visualization.
The first stage prepares the analysis environment by importing required libraries and configuring IDX RapidAPI access. The system defines the API endpoint, authentication headers, and a reusable API request function to retrieve market data.
The API request function allows the system to retrieve different market datasets by sending endpoint requests and returning JSON responses.
Cell 1 — Import Library and API Setup
import requests
import pandas as pd
import numpy as np
import matplotlib.pyplot as plt


API_KEY = "YOUR_API_KEY"


BASE_URL = "https://indonesia-stock-exchange-idx.p.rapidapi.com"


HEADERS = {
    "Content-Type": "application/json",
    "x-rapidapi-host": "indonesia-stock-exchange-idx.p.rapidapi.com",
    "x-rapidapi-key": API_KEY
}


def get_api(endpoint):

    url = BASE_URL + endpoint

    response = requests.get(
        url,
        headers=HEADERS
    )

    print("Status :", response.status_code)

    return response.json()
This stage establishes the connection between Python and IDX API services for collecting broker market information.
The second stage retrieves top broker transaction data from IDX API. The system accesses the top broker endpoint using parameters including transaction sorting method, observation period, market type, and ordering preference.
The returned dataset contains broker transaction information that can be used to analyze market activity concentration.
Cell 2 — Retrieve Top Broker Data
broker_data = get_api(
    "/api/market-detector/top-broker?sort=TB_SORT_BY_TOTAL_VALUE&period=TB_PERIOD_LAST_1_DAY&marketType=MARKET_TYPE_ALL&order=ORDER_BY_ASC"
)


broker_list = broker_data["data"]["data"]["list"]


print(
    "Jumlah broker :",
    len(broker_list)
)
This module collects broker transaction records that become the foundation for further analysis.
The third stage performs data cleaning and transformation. The broker transaction data is converted into a Pandas DataFrame format to simplify processing.
Several numerical columns are converted from string format into numeric format, including:
Total transaction value
Net value
Buy value
Sell value
Total volume
Total frequency
Cell 3 — Broker Data Cleaning
broker_df = pd.DataFrame(
    broker_list
)


cols = [
    "total_value",
    "net_value",
    "buy_value",
    "sell_value",
    "total_volume",
    "total_frequency"
]


for col in cols:

    broker_df[col] = pd.to_numeric(
        broker_df[col],
        errors="coerce"
    )


broker_df.head()
This process ensures that transaction data can be analyzed mathematically and ranked accurately.
The fourth stage performs broker ranking analysis. The system sorts brokers based on total transaction value and creates a simple market activity indicator.
The signal classification uses net transaction value:
Positive net value → Accumulation
Negative net value → Distribution
This approach provides a basic interpretation of broker transaction behavior.
The final analysis table displays:
Broker code
Broker name
Total transaction value
Net value
Market activity signal
Cell 4 — Broker Ranking and Signal Detection
broker_rank = broker_df.sort_values(
    by="total_value",
    ascending=False
)


broker_rank["signal"] = np.where(
    broker_rank["net_value"] > 0,
    "ACCUMULATION",
    "DISTRIBUTION"
)


analysis = broker_rank[
    [
        "code",
        "name",
        "total_value",
        "net_value",
        "signal"
    ]
].head(10)


analysis
This module converts raw broker transaction data into a simple market intelligence report.
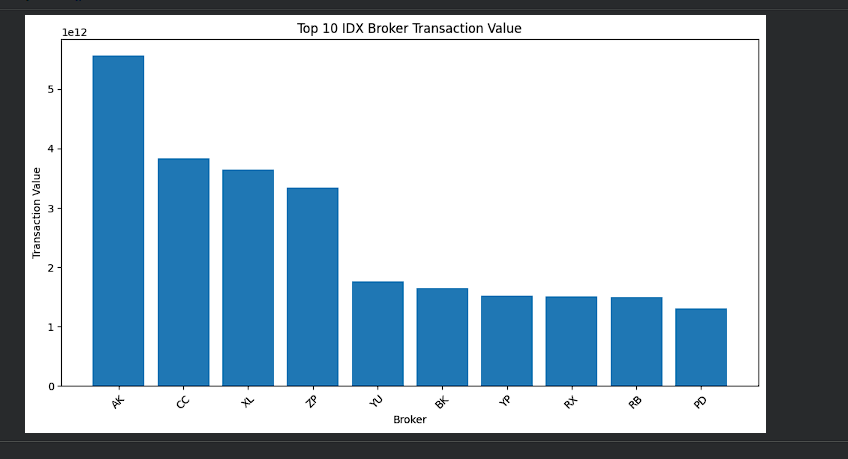
The final stage creates a visualization dashboard showing the top ten brokers based on transaction value. The bar chart provides a graphical comparison of broker activity intensity.
The visualization helps identify brokers with the highest contribution to market transaction value.
Cell 5 — Top Broker Visualization
top10 = broker_rank.head(10)


plt.figure(figsize=(12,6))


plt.bar(
    top10["code"],
    top10["total_value"]
)


plt.title(
    "Top 10 IDX Broker Transaction Value"
)


plt.xlabel(
    "Broker"
)


plt.ylabel(
    "Transaction Value"
)


plt.xticks(rotation=45)


plt.show()
This dashboard provides a visual overview of broker dominance based on transaction activity.
Conclusion
This project successfully developed an IDX Market Intelligence Analysis System using IDX API data to evaluate broker transaction activity and market participation behavior.
The system retrieves top broker data, cleans transaction records, ranks brokers based on transaction value, and identifies simple accumulation or distribution signals using net transaction flow.
The visualization dashboard improves interpretation by presenting the most active brokers based on transaction value. This approach helps transform raw market transaction data into a structured broker intelligence report.
However, broker activity analysis should not be used as a standalone investment decision method. Additional evaluation involving company fundamentals, valuation, technical indicators, market trends, and macroeconomic conditions is still required.
Overall, the IDX Market Intelligence Analysis System demonstrates how API-based financial data processing can support systematic broker monitoring and provide additional insight into market participant behavior.