
Stock analysis requires a combination of market behavior indicators, macroeconomic factors, and trading signals to evaluate potential investment opportunities. Traditional stock analysis often focuses only on price movement and financial performance, while market participant behavior and external economic conditions can also influence stock performance.
This project develops an IDX AI Stock Analyzer using Indonesia Stock Exchange API data to evaluate PT Bumi Resources Tbk (BUMI). The system combines several analytical components including:
Bandar accumulation analysis
Smart money detection
Foreign flow analysis
Forex impact analysis
Sector beneficiary analysis
Investment scoring model
Trading plan generation
The objective of this system is to transform market data into a structured analytical report that provides a comprehensive overview of stock conditions. The analyzer evaluates accumulation strength, confidence level, market risk, and potential trading strategy based on multiple indicators.
The system is developed using Python with API integration, Pandas for data processing, NumPy for numerical calculation, and visualization libraries for analytical reporting.
The first stage prepares the analytical environment and configures the IDX RapidAPI connection. The system defines the API endpoint, authentication header, and stock symbol used for analysis. In this project, the selected stock is BUMI.
Cell 1 — Library and API Configuration
import requests
import pandas as pd
import numpy as np
import matplotlib.pyplot as plt
import seaborn as sns
import json


BASE_URL = "https://indonesia-stock-exchange-idx.p.rapidapi.com"


API_KEY = "YOUR_API_KEY"


HEADERS = {
    "Content-Type": "application/json",
    "x-rapidapi-host": "indonesia-stock-exchange-idx.p.rapidapi.com",
    "x-rapidapi-key": API_KEY
}


symbol = "BUMI"


print("IDX ANALYTICAL SYSTEM READY")
print("Stock :", symbol)
This cell establishes the connection between Python and IDX API services and prepares the stock analysis environment.
The second stage retrieves bandar accumulation data. The system accesses IDX API to collect accumulation information based on a seven-day observation period. The collected data contains accumulation score, status, confidence level, recommendation, risk level, entry zone, and timeframe analysis.
Cell 2 — Bandar Accumulation Analysis
def get_bandar(symbol, days=7):

    url = f"{BASE_URL}/api/analysis/bandar/accumulation/{symbol}"

    params = {
        "days": days
    }

    response = requests.get(
        url,
        headers=HEADERS,
        params=params
    )

    return response.json()


bandar_data = get_bandar(symbol,7)


df_bandar = pd.DataFrame(
    bandar_data["data"]
)
This module identifies potential smart money activity by evaluating accumulation behavior from market participants.
The third stage converts bandar analysis results into an analytical dashboard. The system summarizes important indicators including accumulation score, confidence, recommendation, risk level, entry zone, and investment timeframe.
The module also evaluates supporting indicators such as:
Broker concentration
Buyer and seller activity
Net flow
Trading value
Volume change
Foreign flow
Accumulation days
Cell 3 — Smart Money Signal Dashboard
data = bandar_data["data"]


summary = pd.DataFrame({

    "Parameter":[
        "Symbol",
        "Company",
        "Accumulation Score",
        "Status",
        "Confidence",
        "Recommendation",
        "Risk Level",
        "Current Price",
        "Ideal Entry",
        "Max Entry",
        "Timeframe Short",
        "Timeframe Medium",
        "Timeframe Long"
    ],

    "Value":[
        data["symbol"],
        data["company_name"],
        data["accumulation_score"],
        data["status"],
        f'{data["confidence"]}%',
        data["recommendation"],
        data["risk_level"],
        data["entry_zone"]["current_price"],
        data["entry_zone"]["ideal_price"],
        data["entry_zone"]["max_price"],
        data["timeframe_analysis"]["short_term"],
        data["timeframe_analysis"]["medium_term"],
        data["timeframe_analysis"]["long_term"]
    ]

})


display(summary)
This dashboard transforms raw accumulation data into a simplified investment intelligence report.
The fourth stage analyzes forex impact on stock performance. The system evaluates USD/IDR movement, IDR strengthening or weakening conditions, current beneficiary sectors, and related stock categories.
The analysis also identifies whether exporters or importers receive potential benefits from currency movement.
Cell 4 — Forex IDR Impact Analysis
forex_data = forex_response.json()["data"]


forex_info = forex_data["forex"]["forex"]


idr_strength = forex_data["forex"]["idrStrengthening"]


beneficiary = forex_data["forex"]["currentBeneficiary"]


forex_summary = pd.DataFrame({

    "Parameter":[
        "Currency Pair",
        "Price USD/IDR",
        "Daily Change",
        "Change Percentage",
        "IDR Condition",
        "Current Beneficiary",
        "Market Summary",
        "Timestamp"
    ],

    "Value":[
        forex_info["symbol"],
        forex_info["price"],
        forex_info["change"],
        str(round(
            forex_info["changePercent"],2
        ))+"%",
        "IDR Menguat" if idr_strength else "IDR Melemah",
        beneficiary.upper(),
        forex_data["summary"],
        forex_data["timestamp"]
    ]

})


display(forex_summary)
This module provides macroeconomic context by connecting currency movement with potential sector impact.
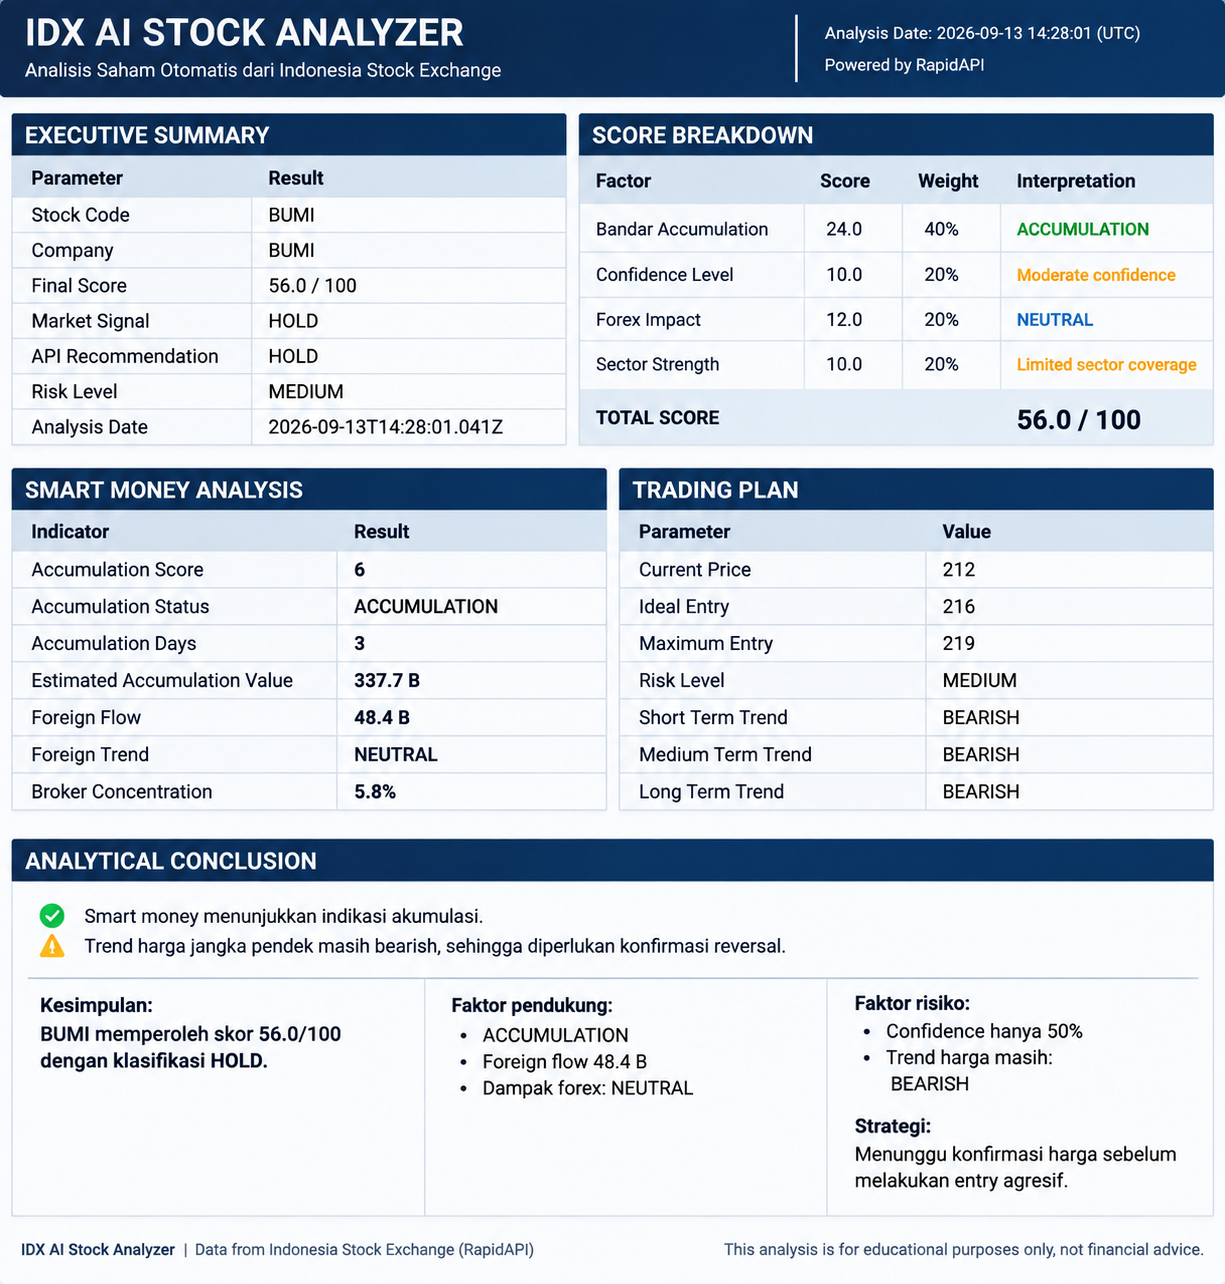
The final stage creates a professional investment dashboard by combining all analytical components. The system calculates a final score based on:
Bandar accumulation component
Confidence level
Forex impact
Sector strength
The scoring model provides an overall classification and generates a trading interpretation.
Cell 5 — Final AI Stock Analysis Dashboard
executive_summary = pd.DataFrame({

    "Parameter":[
        "Stock Code",
        "Company",
        "Final Score",
        "Market Signal",
        "API Recommendation",
        "Risk Level",
        "Analysis Date"
    ],

    "Result":[
        data["symbol"],
        data["company_name"],
        f"{round(final_score,2)} / 100",
        final_signal,
        data["recommendation"],
        data["risk_level"],
        data["analysis_date"]
    ]

})


display(executive_summary)


score_breakdown = pd.DataFrame({

    "Factor":[
        "Bandar Accumulation",
        "Confidence Level",
        "Forex Impact",
        "Sector Strength"
    ],

    "Weight":[
        "40%",
        "20%",
        "20%",
        "20%"
    ]

})


display(score_breakdown)


trading_plan = pd.DataFrame({

    "Parameter":[
        "Current Price",
        "Ideal Entry",
        "Maximum Entry",
        "Risk Level",
        "Short Term Trend",
        "Medium Term Trend",
        "Long Term Trend"
    ]

})


display(trading_plan)
This final dashboard combines smart money indicators, macroeconomic factors, and trading parameters into one structured report.
Conclusion
This project successfully developed an IDX AI Stock Analyzer using IDX API data to evaluate BUMI stock conditions through smart money detection, bandar accumulation analysis, forex impact assessment, and investment scoring.
The system provides a multi-factor evaluation approach by combining market participant behavior, foreign flow, currency movement, and sector impact. The accumulation module identifies potential smart money activity, while the forex analysis provides additional macroeconomic context that may influence stock performance.
The final dashboard generates a structured investment report containing:
Market signal
Final score
Risk assessment
Smart money indicators
Trading plan
Although this system provides a comprehensive analytical framework, the output should not be interpreted as a direct buy or sell recommendation. Further validation using financial fundamentals, valuation analysis, technical confirmation, and broader market conditions remains necessary.
Overall, the IDX AI Stock Analyzer demonstrates how API-based financial analytics and automated scoring models can support data-driven stock research and improve investment decision-making processes.