Cryptocurrency markets are characterized by frequent price fluctuations, changing market conditions, and events that may influence investor expectations. For traders and market analysts, understanding the relationship between Bitcoin and other cryptocurrencies can provide useful context for evaluating portfolio exposure and monitoring market behavior.
Bitcoin is often used as a reference asset when examining the performance of other cryptocurrencies. However, the relationship between Bitcoin and alternative cryptocurrencies, commonly known as altcoins, can change over time. Measuring the correlation between their returns helps analysts understand whether two assets have historically moved in similar or opposite directions during a particular observation period.
In addition to price relationships, cryptocurrency events can provide contextual information for market analysis. Project announcements, network upgrades, token-related developments, and other reported events may be relevant when investigating unusual market movements. Nevertheless, the presence of an event does not automatically establish that it caused a price change. Event dates, data quality, and source reliability must be checked before drawing conclusions.
Python provides a practical environment for combining these analytical tasks. By integrating financial data APIs with libraries such as Pandas, NumPy, Matplotlib, Seaborn, and yfinance, analysts can retrieve event information, calculate daily returns, measure correlations, visualize relationships, validate event dates, and export the resulting datasets.
This article presents Crypto Trader Intelligence, a Python-based analytical workflow that uses MarketFlow and CoinMarketCal for cryptocurrency event retrieval and Yahoo Finance through yfinance for historical price data. Bitcoin (BTC) serves as the base asset, while Ethereum (ETH), Solana (SOL), BNB, XRP, and Cardano (ADA) are included as comparison assets.
The system is organized into five computational cells covering configuration, data retrieval, validation, visualization, and reporting. It is designed to generate a structured report that distinguishes verified events from unavailable or unmatched event records and separates historical price correlation from event-based interpretation.
The primary objective is to support systematic cryptocurrency market research. Correlation values and event records are descriptive analytical outputs, not guaranteed price forecasts or automatic buy and sell signals.
2. Methodology
The Crypto Trader Intelligence workflow consists of five stages.
Cell 1 — Installation and configuration. The program imports the required libraries, requests API credentials, sets the reporting period using the Asia/Jakarta timezone, and defines Bitcoin as the base asset.
Cell 2 — Event and price retrieval. The system first attempts to retrieve cryptocurrency events from CoinMarketCal when an API key is provided. If no usable event records are returned, it attempts to retrieve events from MarketFlow. In parallel, it downloads historical price data for the selected cryptocurrencies from Yahoo Finance.
Cell 3 — Date and data-quality validation. The program identifies an available event-date column, normalizes dates to UTC, filters records to the reporting period, and checks that correlation values and observation counts fall within acceptable ranges.
Cell 4 — Dashboard visualization. The system creates a Bitcoin-to-altcoin correlation chart and a correlation heatmap when sufficient data are available. It also displays event records that pass the date filter.
Cell 5 — Final report and export. The program summarizes the event status, data sources, number of matching events, and correlation results. It then exports the event records, prices, daily returns, correlation table, raw event response, and report summary.
The analysis uses daily percentage returns rather than raw prices to calculate Pearson correlations. For assets \(X\) and \(Y\), the correlation coefficient is:
\[ r_{X,Y} = \frac{\operatorname{Cov}(R_X,R_Y)} {\sigma_{R_X}\sigma_{R_Y}} \]
where \(R_X\) and \(R_Y\) represent the daily returns of the two assets, and \(\sigma\) denotes their standard deviations.
The coefficient ranges from \(-1\) to \(+1\). Positive values indicate that returns tended to move in the same direction during the observed period, while negative values indicate a tendency to move in opposite directions. Values close to zero indicate a weaker linear relationship.
The original implementation uses a minimum of five paired daily-return observations for each correlation calculation. This is a technical inclusion threshold, not a guarantee of statistical reliability. The sample is relatively small, so the resulting coefficients should be interpreted cautiously.
The reporting period is automatically defined as the current date and the seven days preceding it. The historical price download uses a separate 30-day window to provide observations for the correlation analysis. Consequently, the event-monitoring period and price-correlation observation period are not identical.
3. Implementation and Python Code
Cell 1 — Installation and Configuration
The first cell imports the required Python libraries, requests the MarketFlow and optional CoinMarketCal API keys, and configures the API endpoint. The credentials are entered interactively using getpass, which avoids displaying the keys as ordinary input.
The program calculates the reporting period using the Asia/Jakarta timezone and defines BTC as the base asset. Six cryptocurrency trading pairs are configured for the price analysis.
Code — Cell 1
%pip -q install requests pandas numpy matplotlib seaborn yfinance

import os, json, getpass, warnings
import requests
import numpy as np
import pandas as pd
import matplotlib.pyplot as plt
import seaborn as sns
import yfinance as yf

from IPython.display import display
from datetime import datetime, timedelta
from zoneinfo import ZoneInfo

warnings.filterwarnings("ignore")

# API keys: jangan ditulis langsung di notebook yang dibagikan
RAPIDAPI_KEY = getpass.getpass(
    "RapidAPI Key (MarketFlow): "
).strip()

COINMARKETCAL_KEY = getpass.getpass(
    "CoinMarketCal API Key (opsional, Enter jika belum punya): "
).strip()

# Konfigurasi MarketFlow
HOST = "marketflow-all-in-one-market-finance-api.p.rapidapi.com"
BASE_URL = f"https://{HOST}"

HEADERS = {
    "x-rapidapi-key": RAPIDAPI_KEY,
    "x-rapidapi-host": HOST
}

# Periode laporan: 7 hari terakhir, termasuk hari ini
TODAY = datetime.now(ZoneInfo("Asia/Jakarta")).date()
START_DATE = TODAY - timedelta(days=7)
END_DATE = TODAY

BASE_COIN = "BTC"
TICKERS = [
    "BTC-USD", "ETH-USD", "SOL-USD",
    "BNB-USD", "XRP-USD", "ADA-USD"
]

print("CRYPTO TRADER INTELLIGENCE")
print(f"Periode: {START_DATE} sampai {END_DATE}")
print("Base asset:", BASE_COIN)
Cell 2 — Retrieving Cryptocurrency Events and Price Data
The second cell retrieves cryptocurrency event information and historical market prices. It defines a reusable marketflow_get() function that sends authenticated HTTP requests and checks for HTTP or API-level errors. The extract_list() function extracts event records from supported response structures without incorrectly treating metadata as event data.
The event retrieval process prioritizes CoinMarketCal when an API key is supplied. If no usable records are returned, the program attempts to retrieve events from MarketFlow using the /crypto-events endpoint. The selected source is recorded so that the final report can identify where the event data originated.
For the price analysis, the program downloads 30 days of daily adjusted prices for BTC, ETH, SOL, BNB, XRP, and ADA through Yahoo Finance. Daily returns are calculated using percentage changes, and Pearson correlations are computed between Bitcoin returns and each available altcoin's returns. Pairs with fewer than five valid observations are excluded.
Code — Cell 2
# ============================================================
# A. FUNGSI REQUEST
# ============================================================

def marketflow_get(path, params):
    response = requests.get(
        f"{BASE_URL}{path}",
        headers=HEADERS,
        params=params,
        timeout=30
    )
    response.raise_for_status()
    result = response.json()

    if isinstance(result, dict) and result.get("error"):
        raise RuntimeError(result["error"])

    return result


def extract_list(payload, keys):
    if isinstance(payload, list):
        return payload

    if isinstance(payload, dict):
        for key in keys:
            if isinstance(payload.get(key), list):
                return payload[key]

        # Jangan salah menganggap metadata sebagai event
        return []

    return []


# ============================================================
# B. CRYPTO EVENTS
# ============================================================

events_raw = None
events_df = pd.DataFrame()
events_source = None
event_status = "NOT_AVAILABLE"

# Prioritas 1: CoinMarketCal
if COINMARKETCAL_KEY:
    try:
        response = requests.get(
            "https://api.coinmarketcal.com/v2/events",
            headers={"x-api-key": COINMARKETCAL_KEY},
            params={
                "from": str(START_DATE),
                "to": str(END_DATE),
                "page": 1,
                "limit": 100
            },
            timeout=30
        )
        response.raise_for_status()
        events_raw = response.json()

        records = extract_list(
            events_raw, ["body", "events", "data", "results"]
        )

        if records:
            events_df = pd.json_normalize(records)
            events_source = "CoinMarketCal"
            event_status = "RECEIVED"
            print("✅ CoinMarketCal records:", len(events_df))
        else:
            print("⚠️ CoinMarketCal tidak mengembalikan daftar event.")

    except Exception as e:
        print("⚠️ CoinMarketCal gagal:", repr(e))

# Prioritas 2: MarketFlow
if events_df.empty:
    try:
        events_raw = marketflow_get(
            "/crypto-events",
            {
                "skip": 0,
                "source_reliable": "true",
                "important": "false",
                "start_date": str(START_DATE),
                "end_date": str(END_DATE)
            }
        )

        records = extract_list(events_raw, ["events", "data", "results"])
        candidate_df = pd.json_normalize(records)

        if not candidate_df.empty:
            events_df = candidate_df
            events_source = "MarketFlow"
            event_status = "RECEIVED"
            print("📥 MarketFlow records:", len(events_df))
        else:
            print("⚠️ MarketFlow tidak mengembalikan event.")

    except Exception as e:
        print("❌ MarketFlow events gagal:", repr(e))


# ============================================================
# C. KORELASI: YAHOO FINANCE
# ============================================================

prices = pd.DataFrame()
returns = pd.DataFrame()
corr_df = pd.DataFrame()
correlation_source = None

try:
    raw_prices = yf.download(
        TICKERS,
        period="30d",
        interval="1d",
        auto_adjust=True,
        progress=False,
        threads=True
    )

    if raw_prices.empty:
        raise ValueError("Data harga kosong.")

    if isinstance(raw_prices.columns, pd.MultiIndex):
        level0 = raw_prices.columns.get_level_values(0)
        level1 = raw_prices.columns.get_level_values(1)

        if "Close" in level0:
            prices = raw_prices.xs("Close", axis=1, level=0)
        elif "Close" in level1:
            prices = raw_prices.xs("Close", axis=1, level=1)
        else:
            raise ValueError("Kolom Close tidak ditemukan.")
    else:
        raise ValueError("Data beberapa aset tidak tersedia.")

    prices = prices.dropna(axis=1, how="all")

    if "BTC-USD" not in prices.columns:
        raise ValueError("Data BTC tidak ditemukan.")

    returns = prices.pct_change(fill_method=None)

    records = []
    for asset in prices.columns:
        if asset == "BTC-USD":
            continue

        pair = returns[["BTC-USD", asset]].dropna()
        if len(pair) < 5:
            continue

        value = pair["BTC-USD"].corr(pair[asset])

        if pd.notna(value):
            records.append({
                "asset": asset.replace("-USD", ""),
                "correlation": float(value),
                "observations": len(pair)
            })

    corr_df = pd.DataFrame(records)
    correlation_source = "Yahoo Finance — calculated"

    print("\n✅ Korelasi berhasil dihitung")
    print("Pasangan valid:", len(corr_df))

except Exception as e:
    print("\n❌ Pengambilan harga/korelasi gagal:", repr(e))

print("\nSUMBER DATA")
print("Event:", events_source or "Belum tersedia")
print("Korelasi:", correlation_source or "Belum tersedia")
Cell 3 — Event Date Validation and Data Quality Checks
The third cell validates the event dates and correlation results. The parse_event_date() function supports Unix timestamps expressed in seconds and date strings that can be interpreted by Pandas. Parsed dates are converted to UTC to establish a consistent basis for filtering.
The program searches for an event-date column among several candidate names, including date, date_public, date_start, published_at, publishedAt, and created_at. When a valid column is found, the dataset is filtered to the configured reporting period.
The event status is then updated according to the outcome. VERIFIED_PERIOD indicates that at least one event matches the period, while NO_MATCHING_EVENTS indicates that none of the retrieved records passes the date filter. Separate statuses identify cases where the event date column or event data is unavailable.
The cell also validates the correlation table by converting correlation values and observation counts to numeric types, removing invalid values, enforcing the theoretical correlation range of −1 to +1, and retaining pairs with at least five observations. Finally, the raw event response, historical prices, and daily returns are saved for subsequent inspection.
Code — Cell 3
# ============================================================
# A. NORMALISASI TANGGAL EVENT
# ============================================================

events_period_df = pd.DataFrame()

def parse_event_date(value):
    if pd.isna(value):
        return pd.NaT

    # Timestamp Unix dalam detik
    if isinstance(value, (int, float, np.integer, np.floating)):
        if not np.isfinite(value):
            return pd.NaT
        return pd.to_datetime(value, unit="s", utc=True, errors="coerce")

    # Tanggal ISO atau string tanggal lainnya
    return pd.to_datetime(value, utc=True, errors="coerce")


if not events_df.empty:
    # Cari kolom tanggal yang tersedia
    date_candidates = [
        "date", "date_public", "date_start",
        "published_at", "publishedAt", "created_at"
    ]

    date_col = next(
        (c for c in date_candidates if c in events_df.columns),
        None
    )

    if date_col:
        events_df["event_date_utc"] = events_df[date_col].apply(
            parse_event_date
        )

        start_utc = pd.Timestamp(START_DATE, tz="UTC")
        end_utc = (
            pd.Timestamp(END_DATE, tz="UTC")
            + pd.Timedelta(days=1)
        )

        events_period_df = events_df[
            events_df["event_date_utc"].ge(start_utc)
            & events_df["event_date_utc"].lt(end_utc)
        ].copy()

        event_status = (
            "VERIFIED_PERIOD"
            if not events_period_df.empty
            else "NO_MATCHING_EVENTS"
        )

        print("Sumber event:", events_source)
        print("Kolom tanggal:", date_col)
        print("Total record:", len(events_df))
        print("Event cocok periode:", len(events_period_df))

        valid_dates = events_df["event_date_utc"].dropna()
        if not valid_dates.empty:
            print("Tanggal paling lama:", valid_dates.min())
            print("Tanggal paling baru:", valid_dates.max())

    else:
        event_status = "DATE_COLUMN_NOT_FOUND"
        print("⚠️ Kolom tanggal event tidak dikenali.")
else:
    event_status = "NO_EVENT_DATA"
    print("⚠️ Data event tidak tersedia.")


# ============================================================
# B. VALIDASI KORELASI
# ============================================================

if not corr_df.empty:
    corr_df["correlation"] = pd.to_numeric(
        corr_df["correlation"], errors="coerce"
    )

    corr_df["observations"] = pd.to_numeric(
        corr_df["observations"], errors="coerce"
    )

    corr_df = corr_df.dropna(
        subset=["correlation", "observations"]
    )

    corr_df = corr_df[
        corr_df["correlation"].between(-1, 1)
        & (corr_df["observations"] >= 5)
    ]

    print("\nTabel korelasi valid:")
    display(corr_df.sort_values("correlation", ascending=False))

else:
    print("⚠️ Belum ada data korelasi valid.")


# Simpan respons mentah untuk audit
with open("crypto_events_raw.json", "w", encoding="utf-8") as f:
    json.dump(events_raw, f, ensure_ascii=False, indent=2, default=str)

prices.to_csv("crypto_prices.csv")
returns.to_csv("crypto_daily_returns.csv")
Cell 4 — Cryptocurrency Correlation Dashboard and Event Table
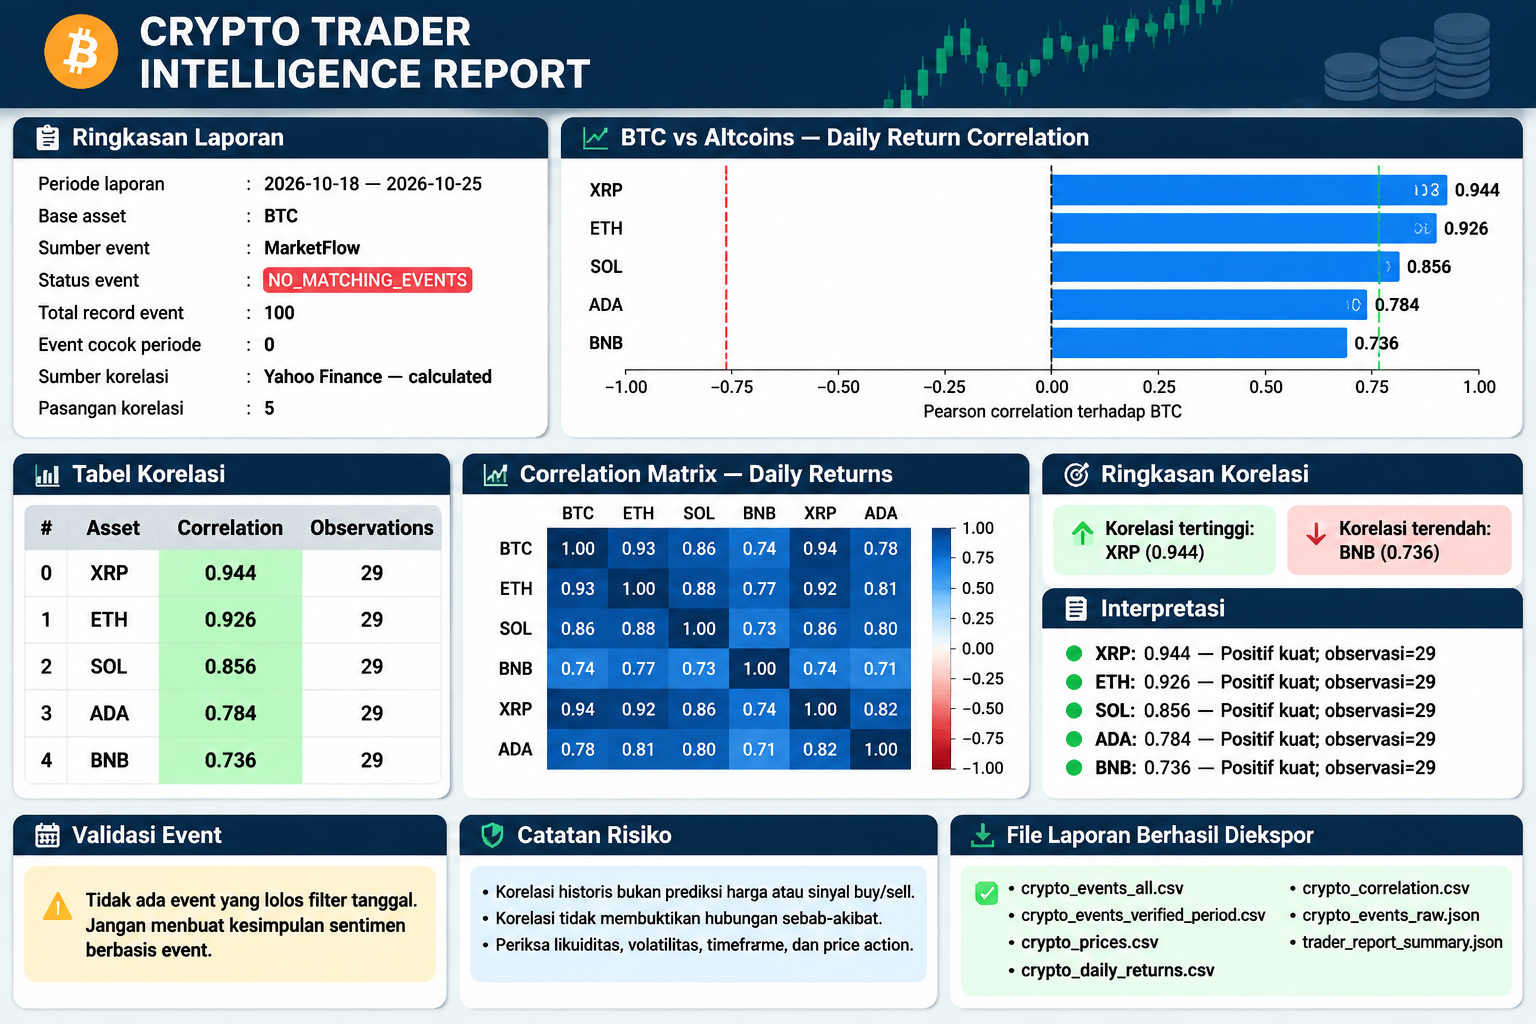
The fourth cell visualizes the correlation results. The horizontal bar chart displays the calculated relationship between Bitcoin's daily returns and those of the available altcoins. Reference lines at zero, +0.7, and −0.7 help distinguish the direction and approximate strength of the observed linear relationships.
A correlation heatmap is also generated when the returns dataset contains at least two assets. The heatmap displays the pairwise correlation matrix, allowing analysts to compare the relationships among all available cryptocurrencies rather than focusing exclusively on Bitcoin.
The event table displays selected fields from records that pass the reporting-period filter. Depending on the API response, these fields may include the event title, caption, symbol, associated coins, date, impact, source, and URL.
If no events match the reporting period, the program explicitly reports that condition instead of presenting unmatched historical records as current market catalysts.
Code — Cell 4
# ============================================================
# A. GRAFIK KORELASI
# ============================================================

if not corr_df.empty:
    plot_df = corr_df.sort_values("correlation")

    plt.figure(figsize=(9, 5))
    plt.barh(plot_df["asset"], plot_df["correlation"])
    plt.axvline(0, linestyle="--", linewidth=1)
    plt.axvline(0.7, linestyle=":", linewidth=1)
    plt.axvline(-0.7, linestyle=":", linewidth=1)
    plt.xlim(-1, 1)
    plt.xlabel("Pearson correlation terhadap BTC")
    plt.title("BTC vs Altcoins — Daily Return Correlation")
    plt.tight_layout()
    plt.show()

    # Heatmap return hanya jika tersedia
    if returns.shape[1] >= 2:
        plt.figure(figsize=(8, 6))
        sns.heatmap(
            returns.corr(),
            annot=True,
            fmt=".2f",
            vmin=-1,
            vmax=1,
            center=0
        )
        plt.title("Correlation Matrix — Daily Returns")
        plt.tight_layout()
        plt.show()
else:
    print("Grafik korelasi tidak dapat dibuat: data belum tersedia.")


# ============================================================
# B. EVENT TABLE
# ============================================================

if not events_period_df.empty:
    preferred = [
        "title", "caption", "symbol", "coins",
        "date", "event_date_utc", "impact",
        "source", "url"
    ]

    display_cols = [
        c for c in preferred if c in events_period_df.columns
    ]

    print("\nEvent yang cocok dengan periode:")
    display(events_period_df[display_cols].head(20))

else:
    print(
        "\n⚠️ Tidak ada event terverifikasi untuk periode laporan."
    )
    print(
        "Jangan menggunakan arsip lama sebagai katalis pasar terkini."
    )
Cell 5 — Final Report and Data Export
The fifth cell compiles the results into a final Crypto Trader Intelligence report. The report includes the reporting period, base asset, event source, event validation status, total event records, matching events, correlation source, and number of valid correlation pairs.
When correlation results are available, the program identifies the highest and lowest correlation coefficients and assigns descriptive labels based on predefined thresholds. The labels summarize the observed relationships but do not establish whether an asset will rise or fall in the future.
The report also distinguishes event validation from correlation analysis. If no events pass the date filter, the system warns against making sentiment conclusions based on those events. Regardless of the outcome, the program exports the datasets and summary to CSV and JSON files.
Code — Cell 5
print("=" * 65)
print("CRYPTO TRADER INTELLIGENCE REPORT")
print("=" * 65)

print(f"Periode laporan      : {START_DATE} — {END_DATE}")
print(f"Base asset           : {BASE_COIN}")
print(f"Sumber event         : {events_source or 'Tidak tersedia'}")
print(f"Status event         : {event_status}")
print(f"Total record event   : {len(events_df)}")
print(f"Event cocok periode  : {len(events_period_df)}")
print(f"Sumber korelasi      : {correlation_source or 'Tidak tersedia'}")
print(f"Pasangan korelasi    : {len(corr_df)}")

if not corr_df.empty:
    strongest = corr_df.loc[corr_df["correlation"].idxmax()]
    weakest = corr_df.loc[corr_df["correlation"].idxmin()]

    print("\nRINGKASAN KORELASI")
    print(
        f"Korelasi tertinggi: {strongest['asset']} "
        f"({strongest['correlation']:.3f})"
    )
    print(
        f"Korelasi terendah: {weakest['asset']} "
        f"({weakest['correlation']:.3f})"
    )

    print("\nInterpretasi:")
    for _, row in corr_df.sort_values(
        "correlation", ascending=False
    ).iterrows():
        r = row["correlation"]

        if r >= 0.7:
            label = "Positif kuat"
        elif r >= 0.3:
            label = "Positif sedang"
        elif r > -0.3:
            label = "Lemah"
        elif r > -0.7:
            label = "Negatif sedang"
        else:
            label = "Negatif kuat"

        print(
            f"- {row['asset']}: {r:.3f} — {label}; "
            f"observasi={int(row['observations'])}"
        )
else:
    print("\nKorelasi belum dapat disimpulkan.")

print("\nVALIDASI EVENT")
if events_period_df.empty:
    print(
        "Tidak ada event yang lolos filter tanggal. "
        "Jangan membuat kesimpulan sentimen berbasis event."
    )
else:
    print(
        f"{len(events_period_df)} event cocok dengan periode laporan."
    )

print("\nCATATAN RISIKO")
print("- Korelasi historis bukan prediksi harga atau sinyal buy/sell.")
print("- Korelasi tidak membuktikan hubungan sebab-akibat.")
print("- Periksa likuiditas, volatilitas, timeframe, dan price action.")

# Ekspor hasil
events_df.to_csv("crypto_events_all.csv", index=False)
events_period_df.to_csv("crypto_events_verified_period.csv", index=False)
corr_df.to_csv("crypto_correlation.csv", index=False)

with open("trader_report_summary.json", "w", encoding="utf-8") as f:
    json.dump({
        "start_date": str(START_DATE),
        "end_date": str(END_DATE),
        "base_asset": BASE_COIN,
        "event_source": events_source,
        "event_status": event_status,
        "total_event_records": len(events_df),
        "verified_period_events": len(events_period_df),
        "correlation_source": correlation_source,
        "correlation_pairs": corr_df.to_dict(orient="records")
    }, f, indent=2, ensure_ascii=False, default=str)

print("\nFile laporan berhasil diekspor.")
print("- crypto_events_all.csv")
print("- crypto_events_verified_period.csv")
print("- crypto_prices.csv")
print("- crypto_daily_returns.csv")
print("- crypto_correlation.csv")
print("- crypto_events_raw.json")
print("- trader_report_summary.json")
Result:
4. Results and Discussion
4.1. Cryptocurrency Event Monitoring
The event-monitoring component retrieves cryptocurrency event records from CoinMarketCal or MarketFlow, depending on the availability of the optional CoinMarketCal API key and the success of the requests.
The program distinguishes between the total number of retrieved records and the number that match the selected reporting period. This distinction is important because an API response may contain records that cannot be verified against the dates selected for the analysis.
The event_status variable summarizes the validation outcome. A status of VERIFIED_PERIOD indicates that at least one record passed the date filter, whereas NO_MATCHING_EVENTS indicates that no records matched. Other statuses identify unavailable data or an unrecognized date column.
If no matching events are found, the appropriate conclusion is that the retrieved dataset does not contain events that pass the configured filter. It does not establish that no cryptocurrency events occurred in the market.
4.2. Bitcoin and Altcoin Return Correlations
The correlation analysis compares Bitcoin's daily returns with those of Ethereum, Solana, BNB, XRP, and Cardano, provided that valid price observations are available.
The correlation coefficient measures the strength and direction of the linear relationship between two assets' daily returns. A positive coefficient indicates that the assets tended to move in the same direction during the observation period, while a negative coefficient indicates a tendency to move in opposite directions.
The correlation chart ranks the available altcoins according to their calculated coefficients. The heatmap provides a broader comparison by displaying the pairwise relationships among all available assets.
However, the analysis uses a relatively short historical price window. Correlation estimates from a small number of observations may change considerably as new data become available. They should therefore be treated as descriptive statistics rather than reliable forecasts of future price movements.
4.3. Event Validation and Data Quality
Event validation is a separate analytical step from price correlation. The program identifies candidate date fields, converts their values to UTC, and filters records according to the configured reporting period.
This procedure reduces the risk of interpreting unrelated historical records as current market catalysts. It also provides a transparent way to distinguish a successful data retrieval from a successful event-date match.
Nevertheless, date normalization alone does not verify the factual accuracy of an event. A more comprehensive implementation would also validate the event source, publication timestamp, event category, and underlying announcement.
The program saves the raw event response as JSON to support subsequent inspection. This is useful when an unexpected result occurs or when the API response needs to be checked against the normalized dataset.
4.4. Reporting and Exported Files
The final report consolidates the event-monitoring and correlation outputs into a single summary. It records the reporting period, base asset, event source, validation status, number of event records, number of matching events, correlation source, and number of valid asset pairs.
The exported files serve different purposes:
File | Purpose |
|---|---|
| Stores all retrieved event records. |
| Stores event records that match the selected period. |
| Stores historical cryptocurrency prices. |
| Stores calculated daily returns. |
| Stores correlation coefficients and observation counts. |
| Preserves the raw event API response. |
| Stores the main report parameters and correlation results. |
Together, these files provide a reproducible record of the analysis and make it easier to inspect the underlying data rather than relying exclusively on charts or summary statistics.
4.5. Limitations and Future Improvements
Several limitations should be considered when interpreting the results.
First, the event-monitoring period covers the seven days preceding the current date, including today, while the price-correlation analysis uses a separate 30-day window. These periods serve different analytical purposes and should not be treated as equivalent.
Second, the correlation calculation requires at least five paired daily-return observations. Although this threshold allows the program to calculate a coefficient, five observations are insufficient for a robust assessment of a potentially changing market relationship.
Third, the event extraction function recognizes only certain response structures and date-column names. If an API returns records in an unexpected structure, the program may fail to identify available events. In addition, CoinMarketCal and MarketFlow may use different field definitions, so the returned data should be inspected before being interpreted.
Fourth, a date match does not establish the causal relationship between an event and a price movement. Demonstrating such a relationship would require additional analysis, including event-window returns, comparison benchmarks, and controls for broader market movements.
Future improvements could include automatic pagination, stronger event-source verification, longer historical price windows, rolling correlations, volatility measurements, and event-study analysis. These extensions would improve the framework's ability to support systematic cryptocurrency research.
5. Conclusion
Crypto Trader Intelligence demonstrates how Python can integrate cryptocurrency event monitoring with historical price analysis to support a structured market research workflow.
The implementation retrieves event data from CoinMarketCal or MarketFlow, downloads historical cryptocurrency prices from Yahoo Finance, calculates daily returns, measures Bitcoin-to-altcoin correlations, validates event dates, generates visualizations, and exports the results to CSV and JSON files.
The workflow emphasizes the importance of separating event retrieval from event validation and historical correlation from investment prediction. This distinction helps prevent unmatched event records from being presented as current market catalysts and reduces the risk of treating historical statistical relationships as guaranteed future outcomes.
Nevertheless, the reliability of the results depends on API availability, data completeness, field definitions, and the length of the observation period. The correlation estimates should be interpreted cautiously, particularly when they are based on a limited number of daily observations.
Future development should prioritize data validation, longer observation periods, rolling correlation analysis, and more rigorous testing of event-related price movements. With these improvements, Crypto Trader Intelligence can provide a useful foundation for cryptocurrency market monitoring, quantitative exploration, and reproducible financial-data analysis.