Liquidity analysis is important in cryptocurrency trading because large concentrations of traded volume at specific price levels can provide useful information about where market activity is concentrated. Instead of relying only on price movement, a liquidity map allows traders to examine the distribution of volume across different BTCUSDT price levels and identify areas that may become important during future price movement.
This project develops a BTCUSDT Liquidity Trader Analysis System using the MarketFlow API. The system retrieves the BTCUSDT liquidity map, validates the API parameters, processes liquidity levels, aggregates volume at identical prices, ranks the most important liquidity concentrations, and generates a visual liquidity dashboard. It also retrieves SMA indicator information to validate whether the indicator is available for subsequent technical confirmation. btcusdt_marketflow_liquidity_tr…
The analysis is structured into five cells. The first cell configures the API and reusable request function. The second cell automatically validates the accepted liquidity-map parameter and retrieves SMA information. The third cell processes and aggregates the liquidity levels. The fourth cell generates the liquidity dashboard and price-volume distribution. The fifth cell converts the results into a trader intelligence report and establishes a bullish, bearish, or no-trade decision framework. btcusdt_marketflow_liquidity_tr… btcusdt_marketflow_liquidity_tr…
Cell 1 — Library Installation and API Configuration
The first cell imports the required Python libraries and establishes the MarketFlow API connection. Requests handles HTTP communication, NumPy supports numerical calculations, Pandas processes the liquidity dataset, Matplotlib provides visualization, and IPython Display presents the analytical tables.
The analysis is configured specifically for BTCUSDT, with a default liquidity limit of 100 and a 30-second API timeout. The RapidAPI key is first searched through the RAPIDAPI_KEY environment variable. If it is not available, the notebook requests the key through getpass(). A reusable get_api() function is also created to standardize API requests and error handling. btcusdt_marketflow_liquidity_tr…
import os
import json
import requests
import numpy as np
import pandas as pd
import matplotlib.pyplot as plt
from getpass import getpass
from IPython.display import display

HOST = "marketflow-all-in-one-market-finance-api.p.rapidapi.com"
BASE_URL = f"https://{HOST}"

SYMBOL = "BTCUSDT"
LIMIT = 100
TIMEOUT = 30

API_KEY = os.getenv("RAPIDAPI_KEY", "").strip()
if not API_KEY:
    API_KEY = getpass("Masukkan RapidAPI Key: ").strip()

if not API_KEY:
    raise ValueError("RapidAPI Key wajib diisi.")

HEADERS = {
    "x-rapidapi-host": HOST,
    "x-rapidapi-key": API_KEY
}

session = requests.Session()
session.headers.update(HEADERS)

def get_api(endpoint, params=None):
    try:
        response = session.get(
            BASE_URL + endpoint,
            params=params,
            timeout=TIMEOUT
        )
        print(f"{endpoint} -> HTTP {response.status_code}")
        response.raise_for_status()
        return response.json()
    except requests.RequestException as e:
        print("API ERROR:", str(e))
        return None
    except ValueError:
        print("ERROR: API tidak mengembalikan JSON.")
        return None

print("=" * 55)
print("BTCUSDT MARKETFLOW TRADING ANALYSIS")
print("=" * 55)
print("Symbol:", SYMBOL)
print("Liquidity limit:", LIMIT)
print("API Configuration: READY")
The main purpose of this cell is to establish a reliable API layer before any liquidity calculation is performed. The reusable session also avoids repeatedly recreating the HTTP connection configuration.
Cell 2 — Retrieve Liquidity Map and Validate SMA
The second cell retrieves the BTCUSDT liquidity map and validates which limit parameter values are accepted by the MarketFlow API. The code tests 50, 20, 10, 5, and None. If a request succeeds, the accepted value is stored in valid_limit and the returned liquidity dataset is stored in liquidity_raw. btcusdt_marketflow_liquidity_tr…
This automatic validation is useful because the API may reject unsupported limit values. Rather than forcing a specific value, the code allows the API response to determine the valid configuration.
The cell also retrieves the SMA indicator information from /tools/indicator/info/SMA. The returned metadata can confirm the indicator name, category, required parameters, and default parameters. btcusdt_marketflow_liquidity_tr…
# CELL 2 - LIQUIDITY MAP PARAMETER AUTO-DETECTION

import requests
import json
import time

LIQUIDITY_URL = BASE_URL + "/tools/crypto/liquidity-map"
SMA_URL = BASE_URL + "/tools/indicator/info/SMA"

liquidity_raw = None
sma_info_raw = None
valid_limit = None

TEST_LIMITS = [50, 20, 10, 5, None]

print("=" * 65)
print("BTCUSDT LIQUIDITY MAP - LIMIT VALIDATION")
print("=" * 65)

for limit in TEST_LIMITS:

    params = {"symbol": SYMBOL}
    if limit is not None:
        params["limit"] = limit

    try:
        response = requests.get(
            LIQUIDITY_URL,
            headers=HEADERS,
            params=params,
            timeout=30
        )

        print(f"\nTesting limit={limit}: HTTP {response.status_code}")

        try:
            payload = response.json()
        except ValueError:
            print("Non-JSON response:", response.text[:300])
            break

        if response.status_code == 200:
            if isinstance(payload, dict) and (
                payload.get("error") or payload.get("success") is False
            ):
                print("Application error:", str(payload)[:400])
                break

            liquidity_raw = payload
            valid_limit = limit
            print("SUCCESS - Accepted limit:", limit)
            break

        print("Response:", str(payload)[:400])

        if response.status_code != 400:
            print("Non-validation error. Stopping tests.")
            break

        message = str(payload).lower()
        if "limit" not in message and "parameter options" not in message:
            print("Error may concern another parameter. Stopping.")
            break

        time.sleep(0.5)

    except requests.RequestException as e:
        print("Connection error:", e)
        break

print("\n" + "=" * 65)
print("SMA INDICATOR INFO")
print("=" * 65)

try:
    sma_response = requests.get(
        SMA_URL,
        headers=HEADERS,
        timeout=30
    )
    print("SMA HTTP STATUS:", sma_response.status_code)

    if sma_response.ok:
        sma_info_raw = sma_response.json()
        print(json.dumps(sma_info_raw, indent=2)[:1500])
    else:
        print(sma_response.text[:500])

except requests.RequestException as e:
    print("SMA ERROR:", e)

print("\n" + "=" * 65)
print("FINAL RESULTS")
print("=" * 65)

print("Liquidity:", "SUCCESS" if liquidity_raw is not None else "FAILED")
print("Accepted limit:", valid_limit)
print("SMA:", "SUCCESS" if sma_info_raw is not None else "FAILED")

if liquidity_raw is not None:
    print("\nLIQUIDITY JSON PREVIEW:")
    print(json.dumps(
        liquidity_raw,
        indent=2,
        ensure_ascii=False,
        default=str
    )[:6000])
The important analytical output from this cell is the accepted liquidity-map configuration and the availability of SMA metadata. The SMA information itself does not provide actual SMA values. That distinction becomes important later because the final trading framework requires actual SMA values for confirmation.
Cell 3 — Liquidity Data Processing and Aggregation
The third cell transforms the raw API response into a structured liquidity DataFrame. The API response is expected to contain a levels array, with each level containing at least price and volume. The code validates these required fields and converts them into numeric variables. Invalid, infinite, negative-price, and negative-volume records are removed. btcusdt_marketflow_liquidity_tr…
The system then aggregates multiple observations occurring at the same price level. For each price, it calculates total volume and the number of observations. It also calculates each price level's percentage contribution to total liquidity, relative strength compared with the strongest level, and rank. btcusdt_marketflow_liquidity_tr…
# CELL 3 - LIQUIDITY DATA PROCESSING

import numpy as np
import pandas as pd
from IPython.display import display

print("=" * 65)
print("BTCUSDT LIQUIDITY DATA PROCESSING")
print("=" * 65)

if not isinstance(liquidity_raw, dict):
    raise ValueError("Liquidity response tidak valid.")

levels = liquidity_raw.get("levels", [])

if not isinstance(levels, list) or not levels:
    raise ValueError("Tidak ada data levels dari API.")

raw_df = pd.DataFrame(levels)

required = {"price", "volume"}
if not required.issubset(raw_df.columns):
    raise ValueError(
        f"Kolom wajib tidak tersedia: {required - set(raw_df.columns)}"
    )

raw_df["price"] = pd.to_numeric(
    raw_df["price"], errors="coerce"
)
raw_df["volume"] = pd.to_numeric(
    raw_df["volume"], errors="coerce"
)

raw_df = raw_df.replace(
    [np.inf, -np.inf], np.nan
).dropna(subset=["price", "volume"])

raw_df = raw_df[
    (raw_df["price"] > 0) &
    (raw_df["volume"] >= 0)
].copy()

if raw_df.empty:
    raise ValueError("Tidak ada data numerik valid.")

# Aggregate volume at identical price levels
liquidity_df = (
    raw_df.groupby("price", as_index=False)
    .agg(
        volume=("volume", "sum"),
        observations=("volume", "size")
    )
    .sort_values("price")
    .reset_index(drop=True)
)

total_volume = liquidity_df["volume"].sum()
max_volume = liquidity_df["volume"].max()

liquidity_df["share_pct"] = (
    liquidity_df["volume"] / total_volume * 100
    if total_volume > 0 else 0.0
)

liquidity_df["relative_strength"] = (
    liquidity_df["volume"] / max_volume * 100
    if max_volume > 0 else 0.0
)

liquidity_df["rank"] = (
    liquidity_df["volume"]
    .rank(method="dense", ascending=False)
    .astype(int)
)

liquidity_df = liquidity_df.sort_values(
    "volume", ascending=False
).reset_index(drop=True)

print("Symbol:", liquidity_raw.get("symbol"))
print("API limit:", liquidity_raw.get("limit"))
print("API weight:", liquidity_raw.get("weight"))
print("Raw records:", len(raw_df))
print("Unique price levels:", len(liquidity_df))
print("Total volume (API units):", round(total_volume, 4))
print("Price range:", raw_df.price.min(), "-", raw_df.price.max())

print("\nTOP 20 LIQUIDITY LEVELS")
display(liquidity_df.head(20).round(3))

print("\nLiquidity zones from API:",
      len(liquidity_raw.get("liquidity_zones", [])))

liquidity_df.to_csv(
    "BTCUSDT_liquidity_processed.csv",
    index=False
)
The aggregation is important because liquidity observations may contain multiple records at the same price. Summing the volume at identical prices produces a more useful representation of total liquidity concentration.
Three derived metrics are particularly useful:
\[ Share_{i} = \frac{Volume_i} {\sum Volume} \times100 \]
This measures the percentage contribution of each price level to total liquidity.
The relative-strength metric is:
\[ RelativeStrength_i = \frac{Volume_i} {Volume_{max}} \times100 \]
Therefore, the strongest liquidity level receives a relative strength of 100%.
The ranking then orders the levels according to aggregated volume. The processed dataset is saved as BTCUSDT_liquidity_processed.csv. btcusdt_marketflow_liquidity_tr…
Cell 4 — Trading Liquidity Dashboard
The fourth cell converts the processed liquidity dataset into visual information. The first chart displays the top 20 liquidity levels as horizontal bars, allowing the largest concentrations to be compared directly.
The second chart presents the relationship between BTCUSDT price and aggregated liquidity volume across the entire available price range. The strongest liquidity level is highlighted to make the dominant concentration easier to identify. btcusdt_marketflow_liquidity_tr…
# CELL 4 - LIQUIDITY VISUAL DASHBOARD

import matplotlib.pyplot as plt

print("=" * 65)
print("BTCUSDT LIQUIDITY DASHBOARD")
print("=" * 65)

top20 = liquidity_df.nlargest(20, "volume")
top20 = top20.sort_values("volume")

fig, ax = plt.subplots(figsize=(13, 9))

bars = ax.barh(
    top20["price"].map(lambda x: f"{x:,.2f}"),
    top20["volume"],
    color="steelblue",
    alpha=0.85
)

ax.set_title(
    "BTCUSDT | TOP 20 LIQUIDITY LEVELS",
    fontsize=15,
    fontweight="bold"
)
ax.set_xlabel("Aggregated Volume (API Units)")
ax.set_ylabel("BTCUSDT Price (USDT)")
ax.grid(axis="x", alpha=0.25)

for bar in bars:
    ax.text(
        bar.get_width(),
        bar.get_y() + bar.get_height() / 2,
        f" {bar.get_width():,.2f}",
        va="center",
        fontsize=9
    )

ax.set_xlim(0, max(top20["volume"]) * 1.18)
plt.tight_layout()
plt.show()

# Price-volume distribution
sorted_df = liquidity_df.sort_values("price")

fig, ax = plt.subplots(figsize=(14, 6))

ax.plot(
    sorted_df["price"],
    sorted_df["volume"],
    color="darkorange",
    linewidth=1.5
)

ax.fill_between(
    sorted_df["price"],
    sorted_df["volume"],
    alpha=0.2,
    color="darkorange"
)

strongest = liquidity_df.iloc[0]

ax.axvline(
    strongest["price"],
    color="red",
    linestyle="--",
    label=f"Strongest: {strongest['price']:,.2f}"
)

ax.set_title("BTCUSDT | LIQUIDITY DISTRIBUTION")
ax.set_xlabel("BTCUSDT Price (USDT)")
ax.set_ylabel("Aggregated Volume (API Units)")
ax.grid(alpha=0.25)
ax.legend()

plt.tight_layout()
plt.show()

print("\nTOP 10 IMPORTANT LEVELS")
display(
    liquidity_df[
        ["rank", "price", "volume",
         "share_pct", "relative_strength"]
    ].head(10).round(3)
)
The first visualization answers a simple question: which price levels contain the largest liquidity concentrations?
The second visualization provides a broader view of how liquidity is distributed throughout the observed price range. The strongest level is identified directly from the maximum aggregated volume. The final table combines ranking, absolute volume, percentage contribution, and relative strength into one compact analytical output.
Cell 5 — Trader Intelligence and Decision Report
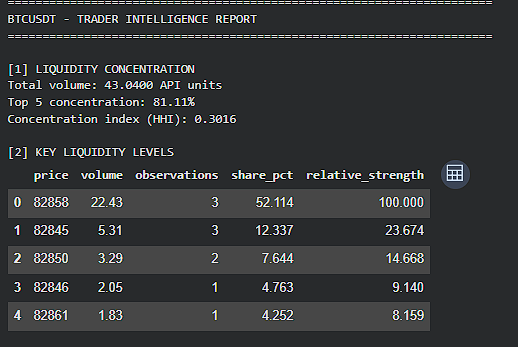
The fifth cell converts the liquidity data into a trader-oriented report. It calculates the concentration of liquidity in the top five price levels and an HHI-based concentration index.
The top-five concentration is calculated as:
\[ Top5\ Concentration = \frac{\sum_{i=1}^{5}Volume_i} {Total\ Volume} \times100 \]
The HHI is calculated as:
\[ HHI = \sum_i \left( \frac{Volume_i} {Total\ Volume} \right)^2 \]
These metrics provide additional information about whether liquidity is broadly distributed or concentrated in a smaller number of price levels. btcusdt_marketflow_liquidity_tr…
# CELL 5 - TRADER INTELLIGENCE REPORT

print("=" * 70)
print("BTCUSDT - TRADER INTELLIGENCE REPORT")
print("=" * 70)

top5 = liquidity_df.nlargest(5, "volume").copy()

top5_concentration = top5["volume"].sum() / total_volume * 100 \
    if total_volume > 0 else np.nan

hhi = (
    ((liquidity_df["volume"] / total_volume) ** 2).sum()
    if total_volume > 0 else np.nan
)

print("\n[1] LIQUIDITY CONCENTRATION")
print(f"Total volume: {total_volume:,.4f} API units")
print(f"Top 5 concentration: {top5_concentration:.2f}%")
print(f"Concentration index (HHI): {hhi:.4f}")

print("\n[2] KEY LIQUIDITY LEVELS")
display(
    top5[
        ["price", "volume", "observations",
         "share_pct", "relative_strength"]
    ].round(3)
)

print("\n[3] MARKET PRICE POSITION")

# Optional: isi dengan harga BTCUSDT aktual yang terverifikasi.
CURRENT_PRICE = None

if CURRENT_PRICE is not None and CURRENT_PRICE > 0:
    reference = float(CURRENT_PRICE)

    above = liquidity_df[
        liquidity_df["price"] > reference
    ].sort_values("price")

    below = liquidity_df[
        liquidity_df["price"] < reference
    ].sort_values("price", ascending=False)

    print(f"Reference price: {reference:,.2f}")

    print("\nNearest liquidity above:")
    display(above.head(5))

    print("\nNearest liquidity below:")
    display(below.head(5))

    if not above.empty:
        print(
            "Volume at levels above reference:",
            round(above["volume"].sum(), 4)
        )

    if not below.empty:
        print(
            "Volume at levels below reference:",
            round(below["volume"].sum(), 4)
        )
else:
    print("Current market price: NOT PROVIDED")
    print("Above/below market classification unavailable.")

print("\n[4] SMA INDICATOR VALIDATION")

indicator = (
    sma_info_raw.get("indicator", {})
    if isinstance(sma_info_raw, dict) else {}
)

print("Indicator:", indicator.get("name", "Unavailable"))
print("Category:", indicator.get("category", "Unavailable"))
print("Required:", indicator.get("requiredParams", []))
print("Defaults:", indicator.get("defaultParams", {}))
print("Actual SMA values: NOT AVAILABLE")

print("\n[5] TRADING DECISION FRAMEWORK")

print("""
BULLISH SCENARIO
- Identify liquidity below and above current price.
- Wait for confirmed bullish market structure.
- Evaluate sweep-and-reclaim or breakout-and-retest.
- Confirm with actual SMA and traded volume.
- Set stop-loss using structural invalidation.

BEARISH SCENARIO
- Identify nearby liquidity concentrations.
- Wait for confirmed bearish market structure.
- Evaluate failed breakout or breakdown-and-retest.
- Confirm with actual SMA and traded volume.
- Set stop-loss using structural invalidation.

NO TRADE
- No verified current market price.
- No actual SMA values.
- No confirmation from OHLCV and volume.
- No defensible entry, stop-loss or target.
""")

print("\n[6] DATA LIMITATIONS")
print("- Volume unit not independently verified.")
print("- liquidity_zones may be empty.")
print("- No long/short side in returned levels.")
print("- Liquidity levels may change over time.")
print("- No timestamp attached to individual levels.")

print("\nFINAL STATUS: LIQUIDITY ANALYSIS COMPLETE")
print("DIRECTIONAL SIGNAL: NOT CONFIRMED")

top5.to_csv("BTCUSDT_top5_levels.csv", index=False)
The most important part of this cell is the market-price position analysis. In the current implementation, CURRENT_PRICE = None, meaning the system intentionally does not classify liquidity as being above or below the current BTCUSDT market price. The code therefore reports that the current market price is not provided and that above/below classification is unavailable. btcusdt_marketflow_liquidity_tr…
The SMA section similarly confirms the indicator metadata but explicitly reports that actual SMA values are not available. Therefore, SMA cannot yet be used as a technical confirmation variable. btcusdt_marketflow_liquidity_tr…
The decision framework consequently separates three scenarios:
Bullish: liquidity is mapped relative to verified market price, bullish structure is confirmed, and sweep/reclaim or breakout/retest behavior is supported by SMA and volume.
Bearish: nearby liquidity concentrations are identified, bearish structure is confirmed, and failed breakout or breakdown/retest behavior receives confirmation from SMA and volume.
No Trade: the required market price, SMA, OHLCV, or volume confirmation is unavailable.
This is an important methodological limitation because liquidity concentration alone does not establish market direction.
Result:
Conclusion
The BTCUSDT Liquidity Trader Analysis System provides a structured framework for analyzing liquidity concentration using MarketFlow API data. The system automatically validates the liquidity-map parameter, retrieves BTCUSDT liquidity levels, processes price and volume information, aggregates volume at identical price levels, calculates liquidity share and relative strength, ranks important levels, and visualizes the resulting liquidity structure.
The analysis also introduces concentration metrics through the top-five liquidity concentration and HHI. These metrics provide additional information about how strongly liquidity is concentrated across the observed price range. The dashboard then highlights the most important liquidity levels and provides a price-volume distribution that can be used as a reference for subsequent market-structure analysis.
However, the current system does not provide a confirmed directional trading signal. The uploaded code explicitly sets CURRENT_PRICE = None, actual SMA values are unavailable, and the returned liquidity data do not independently verify the volume unit, provide long/short side information, or attach timestamps to individual liquidity levels. btcusdt_marketflow_liquidity_tr… btcusdt_marketflow_liquidity_tr… btcusdt_marketflow_liquidity_tr…
Therefore, the appropriate interpretation is that this project functions as a BTCUSDT liquidity intelligence and market-screening system, not an automated entry model. To develop a defensible trading signal, the liquidity map should be combined with a verified current or candle-level BTCUSDT price, actual OHLCV volume, SMA values, market structure, and clearly defined risk-management rules. The final output of the current implementation correctly remains “DIRECTIONAL SIGNAL: NOT CONFIRMED.”