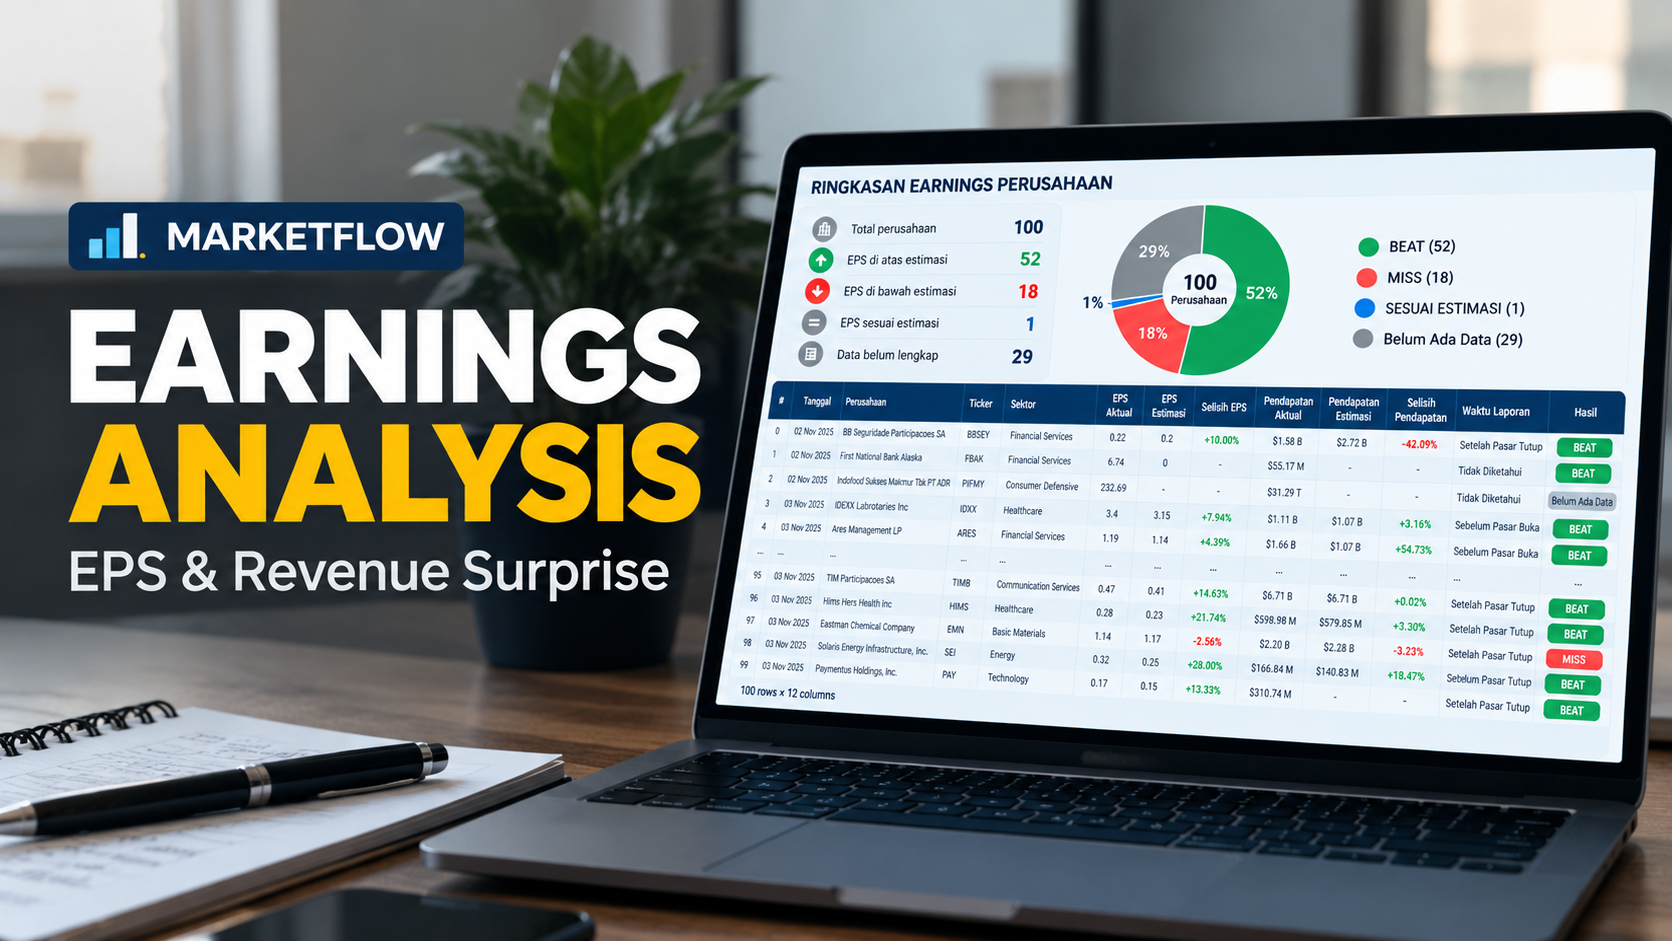
Earnings analysis is an important part of financial market research because quarterly company results provide information about actual business performance compared with market expectations. Two important metrics in earnings analysis are Earnings per Share (EPS) and revenue. Comparing actual results with analyst estimates allows the analysis to identify whether company performance exceeds, falls below, or meets expectations.
This project develops a MarketFlow Earnings Analysis System using the MarketFlow API. The system retrieves detailed earnings information for a selected ticker and earnings events within a specified period. The data is then converted into structured DataFrames and processed to calculate EPS surprise, revenue surprise, earnings classification, reporting time, and summary statistics.
The analysis uses AMG.US as the selected ticker and retrieves earnings events from November 2, 2025 to November 9, 2025. The final output presents a simplified earnings table containing company information, EPS performance, revenue performance, reporting time, and earnings classification.
Cell 1 — Import Library and API Configuration
The first cell imports the required Python libraries and configures the MarketFlow API connection. Pandas is used for data processing, Requests for API communication, and IPython Display for presenting DataFrames.
The API configuration contains the MarketFlow base URL and authentication headers. In the original notebook, the API key is stored in the configuration. For security, the key below is represented as YOUR_API_KEY.
# ============================================================
# CELL 1 — IMPORT LIBRARY + API CONFIGURATION
# ============================================================

import requests
import pandas as pd
import json
from IPython.display import display


BASE_URL = "https://marketflow-all-in-one-market-finance-api.p.rapidapi.com"

API_KEY = "YOUR_API_KEY"


HEADERS = {
    "x-rapidapi-key": API_KEY,
    "x-rapidapi-host": "marketflow-all-in-one-market-finance-api.p.rapidapi.com"
}


print("Library dan konfigurasi API berhasil dimuat.")
Cell 2 — Earnings Details
The second cell retrieves detailed earnings information for the selected ticker. The endpoint /earnings-details/{ticker} is used with AMG.US as the ticker and English as the requested language.
The response is converted into JSON and displayed so its structure can be inspected before further processing.
# ============================================================
# CELL 2 — EARNINGS DETAILS
# ============================================================

ticker = "AMG.US"


url = f"{BASE_URL}/earnings-details/{ticker}"


params = {
    "lang": "en"
}


response = requests.get(
    url,
    headers=HEADERS,
    params=params,
    timeout=30
)


print("Status Code:", response.status_code)


response.raise_for_status()


earnings_detail_json = response.json()


print("Tipe response:", type(earnings_detail_json))


earnings_detail_json
Cell 3 — Earnings Events
The third cell retrieves earnings events within the specified analysis period.
The selected period is November 2, 2025 through November 9, 2025. The API response is stored as JSON and will be normalized into a DataFrame in the next cell.
# ============================================================
# CELL 3 — EARNINGS EVENTS
# ============================================================

url = f"{BASE_URL}/earnings-events"


params = {
    "skip": 0,
    "start_date": "2025-11-02",
    "end_date": "2025-11-09"
}


response = requests.get(
    url,
    headers=HEADERS,
    params=params,
    timeout=30
)


print("Status Code:", response.status_code)


response.raise_for_status()


earnings_events_json = response.json()


print("Tipe response:", type(earnings_events_json))


earnings_events_json
Cell 4 — Convert JSON to DataFrame
The fourth cell converts the JSON responses into Pandas DataFrames.
Because API responses can have different structures, the json_to_dataframe() function checks whether the response is a list or dictionary. For dictionary responses, it searches several possible keys such as data, results, events, earnings, and items.
This approach allows the earnings detail and earnings event datasets to be processed using a common function.
# ============================================================
# CELL 4 — KONVERSI JSON KE DATAFRAME
# ============================================================

def json_to_dataframe(data):

    # Jika response langsung berupa list
    if isinstance(data, list):

        return pd.json_normalize(data)


    # Jika response berupa dictionary
    elif isinstance(data, dict):

        # Cari kemungkinan key utama
        possible_keys = [
            "data",
            "results",
            "events",
            "earnings",
            "items"
        ]


        for key in possible_keys:

            if key in data and isinstance(data[key], list):

                return pd.json_normalize(data[key])


        # Jika tidak ada list, normalize seluruh dict
        return pd.json_normalize(data)


    else:

        return pd.DataFrame()


# Earnings Detail

df_detail = json_to_dataframe(
    earnings_detail_json
)


# Earnings Events

df_events = json_to_dataframe(
    earnings_events_json
)


print("=== EARNINGS DETAIL ===")

print("Shape :", df_detail.shape)

print("Kolom :", df_detail.columns.tolist())

display(df_detail.head())


print("\n=== EARNINGS EVENTS ===")

print("Shape :", df_events.shape)

print("Kolom :", df_events.columns.tolist())

display(df_events.head())
Cell 5 — Earnings Cleaning and Analysis
The fifth cell performs the main earnings analysis.
First, EPS and revenue variables are converted into numeric format. The earnings date is also converted into datetime format.
The system then calculates EPS Surprise using the difference between actual EPS and estimated EPS. The percentage surprise is calculated relative to the absolute estimated EPS.
The earnings result is classified into three main categories:
BEAT when actual EPS is higher than estimated EPS
MISS when actual EPS is lower than estimated EPS
SESUAI ESTIMASI when actual EPS equals estimated EPS
Belum Ada Data when the required EPS data is unavailable
The same approach is applied to revenue to calculate revenue surprise.
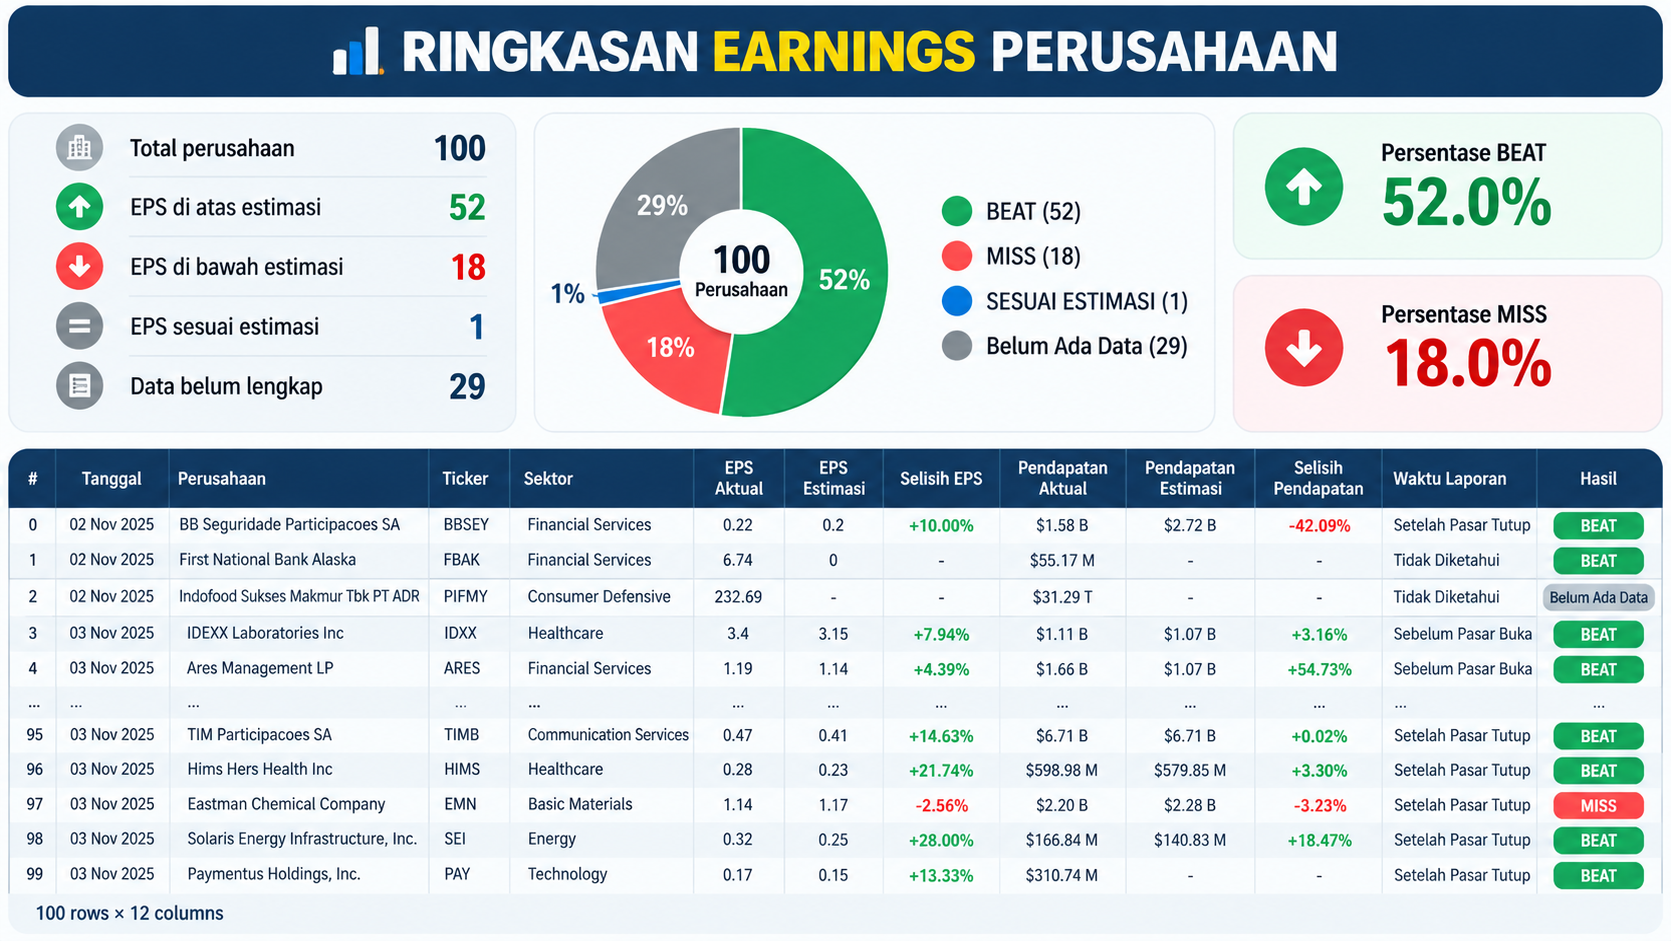
The code also converts the earnings reporting code bmo into Sebelum Pasar Buka and amc into Setelah Pasar Tutup.
Finally, the system creates a simplified earnings table and calculates the number and percentage of companies classified as BEAT, MISS, or consistent with estimates.
# ============================================
# CELL 5 — ANALISIS EARNINGS YANG MUDAH DIBACA
# ============================================

analysis = df_events.copy()


# --------------------------------------------
# 1. Bersihkan dan ubah tipe data
# --------------------------------------------

numeric_cols = [
    "eps_actual",
    "eps_estimate",
    "revenue_actual",
    "revenue_estimate"
]


for col in numeric_cols:

    if col in analysis.columns:

        analysis[col] = pd.to_numeric(
            analysis[col],
            errors="coerce"
        )


if "date" in analysis.columns:

    analysis["date"] = pd.to_datetime(
        analysis["date"],
        errors="coerce"
    )


# --------------------------------------------
# 2. Hitung EPS Surprise
# --------------------------------------------

analysis["eps_surprise"] = (
    analysis["eps_actual"]
    - analysis["eps_estimate"]
)


# Hindari inf jika EPS estimate = 0

analysis["eps_surprise_pct"] = (
    analysis["eps_surprise"]
    / analysis["eps_estimate"].abs()
    * 100
)


analysis.loc[
    analysis["eps_estimate"].isna()
    | (analysis["eps_estimate"] == 0),
    "eps_surprise_pct"
] = pd.NA


# --------------------------------------------
# 3. Klasifikasi hasil earnings
# --------------------------------------------

def classify_earnings(row):

    actual = row["eps_actual"]

    estimate = row["eps_estimate"]


    if pd.isna(actual) or pd.isna(estimate):

        return "Belum Ada Data"


    if actual > estimate:

        return "BEAT"


    elif actual < estimate:

        return "MISS"


    else:

        return "SESUAI ESTIMASI"


analysis["hasil"] = analysis.apply(
    classify_earnings,
    axis=1
)


# --------------------------------------------
# 4. Revenue Surprise
# --------------------------------------------

analysis["revenue_surprise"] = (
    analysis["revenue_actual"]
    - analysis["revenue_estimate"]
)


analysis["revenue_surprise_pct"] = (
    analysis["revenue_surprise"]
    / analysis["revenue_estimate"].abs()
    * 100
)


analysis.loc[
    analysis["revenue_estimate"].isna()
    | (analysis["revenue_estimate"] == 0),
    "revenue_surprise_pct"
] = pd.NA


# --------------------------------------------
# 5. Ubah kode waktu earnings
# --------------------------------------------

def translate_hour(x):

    if x == "bmo":

        return "Sebelum Pasar Buka"


    elif x == "amc":

        return "Setelah Pasar Tutup"


    else:

        return "Tidak Diketahui"


analysis["waktu_laporan"] = (
    analysis["hour"]
    .apply(translate_hour)
)


# --------------------------------------------
# 6. Format angka agar mudah dibaca
# --------------------------------------------

def format_money(value):

    if pd.isna(value):

        return "-"


    abs_value = abs(value)


    if abs_value >= 1_000_000_000_000:

        return f"${value/1_000_000_000_000:.2f} T"


    elif abs_value >= 1_000_000_000:

        return f"${value/1_000_000_000:.2f} B"


    elif abs_value >= 1_000_000:

        return f"${value/1_000_000:.2f} M"


    elif abs_value >= 1_000:

        return f"${value/1_000:.2f} K"


    else:

        return f"${value:,.2f}"


def format_eps(value):

    if pd.isna(value):

        return "-"


    return f"{value:.4f}".rstrip("0").rstrip(".")


def format_pct(value):

    if pd.isna(value):

        return "-"


    return f"{value:+.2f}%"


# --------------------------------------------
# 7. Buat tabel sederhana
# --------------------------------------------

result = pd.DataFrame({

    "Tanggal":
        analysis["date"].dt.strftime("%d %b %Y"),

    "Perusahaan":
        analysis["name"],

    "Ticker":
        analysis["symbol"],

    "Sektor":
        analysis["sector"],

    "EPS Aktual":
        analysis["eps_actual"].apply(format_eps),

    "EPS Estimasi":
        analysis["eps_estimate"].apply(format_eps),

    "Selisih EPS":
        analysis["eps_surprise_pct"].apply(format_pct),

    "Pendapatan Aktual":
        analysis["revenue_actual"].apply(format_money),

    "Pendapatan Estimasi":
        analysis["revenue_estimate"].apply(format_money),

    "Selisih Pendapatan":
        analysis["revenue_surprise_pct"].apply(format_pct),

    "Waktu Laporan":
        analysis["waktu_laporan"],

    "Hasil":
        analysis["hasil"]

})


# --------------------------------------------
# 8. Statistik ringkas
# --------------------------------------------

total = len(analysis)


beat = (
    analysis["hasil"] == "BEAT"
).sum()


miss = (
    analysis["hasil"] == "MISS"
).sum()


inline = (
    analysis["hasil"] == "SESUAI ESTIMASI"
).sum()


no_data = (
    analysis["hasil"] == "Belum Ada Data"
).sum()


print("=" * 65)

print("           RINGKASAN EARNINGS PERUSAHAAN")

print("=" * 65)


print(
    f"Total perusahaan          : {total}"
)

print(
    f"EPS di atas estimasi      : {beat}"
)

print(
    f"EPS di bawah estimasi     : {miss}"
)

print(
    f"EPS sesuai estimasi       : {inline}"
)

print(
    f"Data belum lengkap        : {no_data}"
)


print("-" * 65)


if total > 0:

    print(
        f"Persentase BEAT           : "
        f"{beat/total*100:.1f}%"
    )


    print(
        f"Persentase MISS           : "
        f"{miss/total*100:.1f}%"
    )


print("=" * 65)


# --------------------------------------------
# 9. Tampilkan tabel utama
# --------------------------------------------

display(result)
Result:
Conclusion
This project develops a MarketFlow Earnings Analysis system that transforms raw earnings API data into a structured and easier-to-read earnings report.
The workflow begins with earnings detail and earnings event retrieval, followed by JSON normalization and DataFrame conversion. The analysis then calculates EPS surprise and revenue surprise, classifies earnings results into BEAT, MISS, or sesuai estimasi, translates reporting times, and formats financial values for easier interpretation.
The final output provides a consolidated view containing the reporting date, company, ticker, sector, actual and estimated EPS, EPS surprise, actual and estimated revenue, revenue surprise, reporting time, and earnings result. The system also generates summary statistics showing the total number of companies and the distribution of earnings results.
This framework can therefore be used as a structured starting point for earnings-event monitoring. However, the earnings classification itself only describes the difference between actual and estimated results. It does not by itself measure the subsequent stock-price reaction or determine an investment decision.