
Cryptocurrency market analysis requires a combination of price evaluation, momentum measurement, volatility assessment, and market structure identification. Price movement alone cannot fully describe market conditions because traders also need technical indicators such as moving averages, RSI, support and resistance levels, and volatility measurements.
This project develops a BTCUSDT Market Analysis System using MarketFlow API data to automatically analyze Bitcoin market conditions. The system retrieves BTCUSDT historical price data, processes market information, calculates technical indicators, generates visualization dashboards, and provides an automated market interpretation report.
The analysis workflow consists of five main stages:
API configuration and market data connection
BTCUSDT historical data retrieval
Data preprocessing and technical indicator calculation
Market dashboard visualization
Automatic BTC market interpretation
The system is developed using Python with Requests for API communication, Pandas for data processing, NumPy for numerical calculations, and Matplotlib for visualization. The API retrieves BTCUSDT daily data from MarketFlow API using the Binance BTCUSDT symbol. btcusdt_market_analysis_api
Cell 1 — Import Library and API Configuration
The first cell prepares the Python environment and establishes the API connection.
The system imports the required libraries:
Requests for API data retrieval
Pandas for dataframe processing
NumPy for numerical operations
Matplotlib for visualization
The API configuration defines the MarketFlow endpoint, authentication headers, timeframe, date range, and BTCUSDT symbol. btcusdt_market_analysis_api
import requests
import pandas as pd
import numpy as np
import matplotlib.pyplot as plt


API_KEY = "YOUR_API_KEY"


API_URL = (
    "https://marketflow-all-in-one-market-finance-api.p.rapidapi.com"
    "/v2/chart/range"
)


headers = {
    "x-rapidapi-host":
    "marketflow-all-in-one-market-finance-api.p.rapidapi.com",

    "x-rapidapi-key":
    API_KEY
}


params = {
    "timezone": "Asia/Jakarta",
    "timeframe": "D",
    "to": "2025-12-31",
    "from": "2025-01-01",
    "symbol": "BINANCE:BTCUSDT"
}


print("API Connected")
Cell 2 — BTCUSDT Market Data Retrieval
The second cell retrieves BTCUSDT historical market data from MarketFlow API.
The response is converted into a Pandas DataFrame. The system checks the API response structure and automatically selects the correct data source before creating the dataframe.
The output contains historical price information required for technical analysis. btcusdt_market_analysis_api
# ==========================================================
# GET DATA FROM MARKETFLOW API
# ==========================================================

response = requests.get(
    API_URL,
    headers=headers,
    params=params
)


print("Status API :", response.status_code)


data = response.json()


# Cek struktur response

print("\nKEY RESPONSE:")
print(data.keys())


print("\nFULL RESPONSE SAMPLE:")
print(str(data)[:1000])


# ==========================================================
# CREATE DATAFRAME
# ==========================================================

if "data" in data:

    df = pd.DataFrame(data["data"])


elif "result" in data:

    df = pd.DataFrame(data["result"])


else:

    df = pd.DataFrame(data)


print("\nDATAFRAME CREATED")

print(df.head())

print("\nCOLUMN:")
print(df.columns)
Cell 3 — Data Processing and Technical Indicator Calculation
The third cell performs data preprocessing and calculates technical indicators.
The system automatically detects price columns:
Open
High
Low
Close
Volume
Timestamp
After preprocessing, the system calculates:
Daily return
Moving Average 20 (MA20)
Moving Average 50 (MA50)
RSI 14
30-day support
30-day resistance
These indicators are used to evaluate BTCUSDT market momentum and price structure. btcusdt_market_analysis_api btcusdt_market_analysis_api btcusdt_market_analysis_api
# ==========================================================
# DATA PROCESSING
# ==========================================================


# lihat struktur data

print("Jumlah kolom :", len(df.columns))
print("Nama kolom :", df.columns.tolist())


# ==============================
# Cari kolom harga otomatis
# ==============================

price_columns = {
    "open": None,
    "high": None,
    "low": None,
    "close": None,
    "volume": None,
    "timestamp": None
}


for col in df.columns:

    c = col.lower()

    if "time" in c or "date" in c:
        price_columns["timestamp"] = col

    elif c == "open":
        price_columns["open"] = col

    elif c == "high":
        price_columns["high"] = col

    elif c == "low":
        price_columns["low"] = col

    elif c == "close":
        price_columns["close"] = col

    elif "volume" in c:
        price_columns["volume"] = col


print("\nMapping kolom:")
print(price_columns)


# ==============================
# Rename sesuai kebutuhan
# ==============================

rename_dict = {
    v:k
    for k,v in price_columns.items()
    if v is not None
}


df = df.rename(
    columns=rename_dict
)


# ==============================
# Timestamp
# ==============================

if "timestamp" in df.columns:

    df["timestamp"] = pd.to_datetime(
        df["timestamp"],
        errors="coerce"
    )


# ==============================
# Convert numeric
# ==============================

for col in [
    "open",
    "high",
    "low",
    "close",
    "volume"
]:

    if col in df.columns:

        df[col] = pd.to_numeric(
            df[col],
            errors="coerce"
        )


# ==============================
# Technical Indicator
# ==============================


df["daily_return"] = (
    df["close"].pct_change()
)


df["MA20"] = (
    df["close"]
    .rolling(20)
    .mean()
)


df["MA50"] = (
    df["close"]
    .rolling(50)
    .mean()
)


# RSI

delta = df["close"].diff()

gain = delta.clip(lower=0)

loss = -delta.clip(upper=0)


avg_gain = gain.rolling(14).mean()

avg_loss = loss.rolling(14).mean()


rs = avg_gain / avg_loss


df["RSI"] = (
    100-(100/(1+rs))
)


df.head()

# ==========================================================
# SORT DATA CHRONOLOGICALLY
# ==========================================================

df = df.sort_values(
    "timestamp"
).reset_index(drop=True)


df.head()

# ==========================================================
# SUPPORT & RESISTANCE
# ==========================================================


support = df["low"].rolling(
    30
).min()


resistance = df["high"].rolling(
    30
).max()


df["support_30D"] = support

df["resistance_30D"] = resistance


df.tail()
Cell 4 — BTCUSDT Market Dashboard Visualization
The fourth cell creates a visualization dashboard.
The dashboard contains:
BTC price trend with MA20 and MA50
Support and resistance levels
RSI momentum indicator
Trading volume analysis
Daily return distribution
These visualizations provide a comprehensive overview of BTCUSDT market behavior. btcusdt_market_analysis_api
# ==========================================================
# BTCUSDT MARKET ANALYSIS DASHBOARD
# ==========================================================


import matplotlib.pyplot as plt


# ==========================================================
# 1. PRICE TREND + MOVING AVERAGE
# ==========================================================


plt.figure(figsize=(14,6))


plt.plot(
    df["timestamp"],
    df["close"],
    label="BTC Close Price"
)


plt.plot(
    df["timestamp"],
    df["MA20"],
    label="MA 20"
)


plt.plot(
    df["timestamp"],
    df["MA50"],
    label="MA 50"
)


plt.title(
    "BTCUSDT Price Trend with Moving Average"
)


plt.xlabel("Date")

plt.ylabel("Price (USD)")


plt.legend()

plt.grid()

plt.show()


# ==========================================================
# 2. SUPPORT & RESISTANCE
# ==========================================================


plt.figure(figsize=(14,6))


plt.plot(
    df["timestamp"],
    df["close"],
    label="BTC Price"
)


plt.plot(
    df["timestamp"],
    df["support_30D"],
    label="30 Day Support"
)


plt.plot(
    df["timestamp"],
    df["resistance_30D"],
    label="30 Day Resistance"
)


plt.title(
    "BTC Support and Resistance Level"
)


plt.ylabel("Price USD")


plt.legend()

plt.grid()

plt.show()


# ==========================================================
# 3. RSI MOMENTUM
# ==========================================================


plt.figure(figsize=(14,4))


plt.plot(
    df["timestamp"],
    df["RSI"],
    label="RSI 14"
)


plt.axhline(
    70,
    linestyle="--",
    label="Overbought (70)"
)


plt.axhline(
    30,
    linestyle="--",
    label="Oversold (30)"
)


plt.title(
    "BTC RSI Momentum Indicator"
)


plt.ylabel("RSI")


plt.legend()

plt.grid()

plt.show()


# ==========================================================
# 4. VOLUME ANALYSIS
# ==========================================================


plt.figure(figsize=(14,4))


plt.bar(
    df["timestamp"],
    df["volume"]
)


plt.title(
    "BTC Trading Volume"
)


plt.xlabel("Date")

plt.ylabel("Volume BTC")


plt.grid()

plt.show()


# ==========================================================
# 5. RETURN DISTRIBUTION
# ==========================================================


plt.figure(figsize=(10,4))


plt.hist(
    df["daily_return"].dropna(),
    bins=50
)


plt.title(
    "BTC Daily Return Distribution"
)


plt.xlabel(
    "Daily Return"
)


plt.ylabel(
    "Frequency"
)


plt.grid()

plt.show()
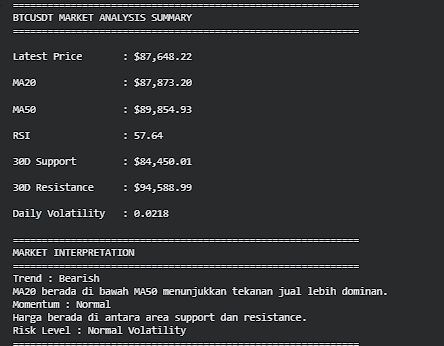
Cell 5 — Automatic BTC Market Interpretation
The final cell generates an automated market summary.
The system evaluates:
Latest BTC price
MA20 and MA50 trend
RSI momentum
Support and resistance position
Daily volatility
The interpretation classifies:
Trend condition
Momentum condition
Price position
Risk level
btcusdt_market_analysis_api
RESULT:
# ==========================================================
# AUTOMATIC BTC MARKET ANALYSIS SUMMARY
# ==========================================================


latest = df.iloc[-1]


price = latest["close"]

ma20 = latest["MA20"]

ma50 = latest["MA50"]

rsi = latest["RSI"]


support = latest["support_30D"]

resistance = latest["resistance_30D"]


volatility = (
    df["daily_return"]
    .std()
)


print("="*60)

print("BTCUSDT MARKET ANALYSIS SUMMARY")

print("="*60)


print(
    f"""
Latest Price       : ${price:,.2f}

MA20               : ${ma20:,.2f}

MA50               : ${ma50:,.2f}

RSI                : {rsi:.2f}

30D Support        : ${support:,.2f}

30D Resistance     : ${resistance:,.2f}

Daily Volatility   : {volatility:.4f}
"""
)


print("="*60)

print("MARKET INTERPRETATION")

print("="*60)


# Trend Analysis

if ma20 > ma50:

    print(
        "Trend : Bullish"
    )

    print(
        "MA20 berada di atas MA50 menunjukkan momentum jangka pendek lebih kuat dibanding trend menengah."
    )


else:

    print(
        "Trend : Bearish"
    )

    print(
        "MA20 berada di bawah MA50 menunjukkan tekanan jual lebih dominan."
    )


# RSI Analysis

if rsi > 70:

    print(
        "Momentum : Overbought"
    )

elif rsi < 30:

    print(
        "Momentum : Oversold"
    )

else:

    print(
        "Momentum : Normal"
    )


# Position terhadap support resistance

if price >= resistance*0.98:

    print(
        "Harga mendekati area resistance 30 hari."
    )


elif price <= support*1.02:

    print(
        "Harga mendekati area support 30 hari."
    )


else:

    print(
        "Harga berada di antara area support dan resistance."
    )


# Volatility

if volatility > 0.03:

    print(
        "Risk Level : High Volatility"
    )

else:

    print(
        "Risk Level : Normal Volatility"
    )


print("="*60)
Conclusion
This project successfully develops a BTCUSDT Market Analysis System using API-based historical market data and technical analysis indicators.
The system integrates market data retrieval, preprocessing, technical indicator calculation, visualization, and automated interpretation into a complete Bitcoin analysis workflow.
The technical engine evaluates BTC market conditions using moving averages, RSI, support and resistance levels, trading volume, and volatility. The dashboard provides a structured visualization of price behavior, momentum, and risk conditions.
The automatic interpretation module converts technical indicators into a simplified market overview by identifying trend direction, momentum status, price position, and volatility level.
However, this system should not be considered a standalone trading decision tool. Additional evaluation such as macroeconomic conditions, liquidity analysis, risk management, and broader cryptocurrency market conditions remains necessary.
Overall, the BTCUSDT Market Analysis API system demonstrates how automated data processing and technical indicators can support systematic cryptocurrency market monitoring and analysis.