
Markets do not move randomly. At different times, money flows into different sectors. Some sectors become stronger, while others lose momentum.
For investors, understanding sector movement is useful, but it is not enough. A good investment workflow also needs risk control. That is why this notebook combines Sector Rotation and Risk Reward Analysis in one simple dashboard.
This project shows how Python can be used to read market sector conditions, calculate risk-reward data, and display the results in a structured format.
Cell 1 — Import Library
import requests
import pandas as pd
import time
from IPython.display import display
Explanation
Cell 1 imports the main libraries used in the notebook.
The notebook uses requests to connect with the API, pandas to organize data into tables, time to handle delay when needed, and display to show dataframe results clearly in Google Colab.
Cell 2 — Konfigurasi Project
RAPIDAPI_KEY = "YOUR_API_KEY"

BASE_URL = "https://indonesia-stock-exchange-idx.p.rapidapi.com"

HEADERS = {
    "Content-Type": "application/json",
    "x-rapidapi-host": "indonesia-stock-exchange-idx.p.rapidapi.com",
    "x-rapidapi-key": RAPIDAPI_KEY
}

STOCK_SYMBOL = "BBCA"
DAYS = 30
PORTFOLIO_SIZE = 100_000_000
RISK_PERCENT = 2
Explanation
Cell 2 sets up the project configuration.
This cell defines the API key, base URL, request headers, stock symbol, analysis period, portfolio size, and risk percentage.
The selected stock symbol is BBCA, with a 30-day analysis period and a portfolio size of 100 million. The risk percentage is set to 2%, which means the risk calculation is based on controlled portfolio exposure.
Cell 3 — Function API Aman
def fetch_api(endpoint, params=None, retries=3, delay=3):
    url = f"{BASE_URL}{endpoint}"

    for attempt in range(retries):
        response = requests.get(url, headers=HEADERS, params=params)

        if response.status_code == 200:
            return response.json()

        if response.status_code == 429:
            print(f"Rate limit terkena. Menunggu {delay} detik...")
            time.sleep(delay)
            delay *= 2
            continue

        print("Error:", response.status_code)
        print(response.text)
        return None

    return None


def to_dataframe(response):
    if response is None:
        return pd.DataFrame()

    if isinstance(response, list):
        return pd.DataFrame(response)

    if isinstance(response, dict):
        data = response.get("data", response)

        if isinstance(data, list):
            return pd.DataFrame(data)

        if isinstance(data, dict):
            for key, value in data.items():
                if isinstance(value, list):
                    return pd.DataFrame(value)

            return pd.json_normalize(data)

    return pd.DataFrame()
Explanation
Cell 3 creates two helper functions.
The first function, fetch_api(), is used to call API endpoints safely. It supports retry logic and handles rate-limit responses.
The second function, to_dataframe(), helps convert different API response formats into pandas dataframes.
This makes the notebook more flexible because API responses may come as lists, dictionaries, nested data, or empty responses.
Cell 4 — Ambil & Gabungkan Data
print("Sector Rotation Structure:")
print(sector_rotation.keys() if isinstance(sector_rotation, dict) else type(sector_rotation))

print("\nRisk Reward Structure:")
print(risk_reward.keys() if isinstance(risk_reward, dict) else type(risk_reward))
Explanation
Cell 4 checks the structure of the Sector Rotation and Risk Reward API responses.
The notebook prints the available keys if the response is a dictionary. If not, it prints the data type.
This step helps users understand the structure of the API result before displaying it in the dashboard.
Cell 5 — Tampilkan Dashboard Sederhana
from IPython.display import display
import pandas as pd

print("=" * 80)
print("📊 IDX RETAIL ANALYSIS DASHBOARD")
print("=" * 80)

# ==================================================
# SECTOR ROTATION
# ==================================================
sector_data = api_result["getSectorRotation"]["data"]

sector_df = pd.DataFrame(
    sector_data["all_sectors"]
)[[
    "sector_name",
    "momentum_score",
    "status",
    "avg_return_today",
    "foreign_flow",
    "recommendation",
    "companies_count"
]]

sector_df = sector_df.sort_values(
    by="momentum_score",
    ascending=False
)

print("\n🔄 SECTOR ROTATION RANKING")
display(sector_df)

# ==================================================
# TOP 5 SECTORS
# ==================================================
print("\n🏆 TOP SECTORS")

top_sector = sector_df.head(5)

display(top_sector)

# ==================================================
# RISK REWARD
# ==================================================
risk_reward = api_result["calculateRiskReward"]

print("\n💰 RISK REWARD ANALYSIS")

risk_df = pd.json_normalize(risk_reward)

display(risk_df)

# ==================================================
# MARKET SUMMARY
# ==================================================
summary = sector_data["summary"]

print("\n📈 MARKET SUMMARY")

summary_df = pd.DataFrame([{
    "Market Phase": sector_data["market_phase"],
    "Total Sectors": summary["total_sectors"],
    "Bullish": summary["bullish_sectors"],
    "Bearish": summary["bearish_sectors"],
    "Neutral": summary["neutral_sectors"]
}])

display(summary_df)

# ==================================================
# PROJECT SUMMARY
# ==================================================
print("\n📋 PROJECT CONFIGURATION")

config_df = pd.DataFrame([{
    "Symbol": STOCK_SYMBOL,
    "Days": DAYS,
    "Portfolio Size": PORTFOLIO_SIZE,
    "Risk %": RISK_PERCENT
}])

display(config_df)
Explanation
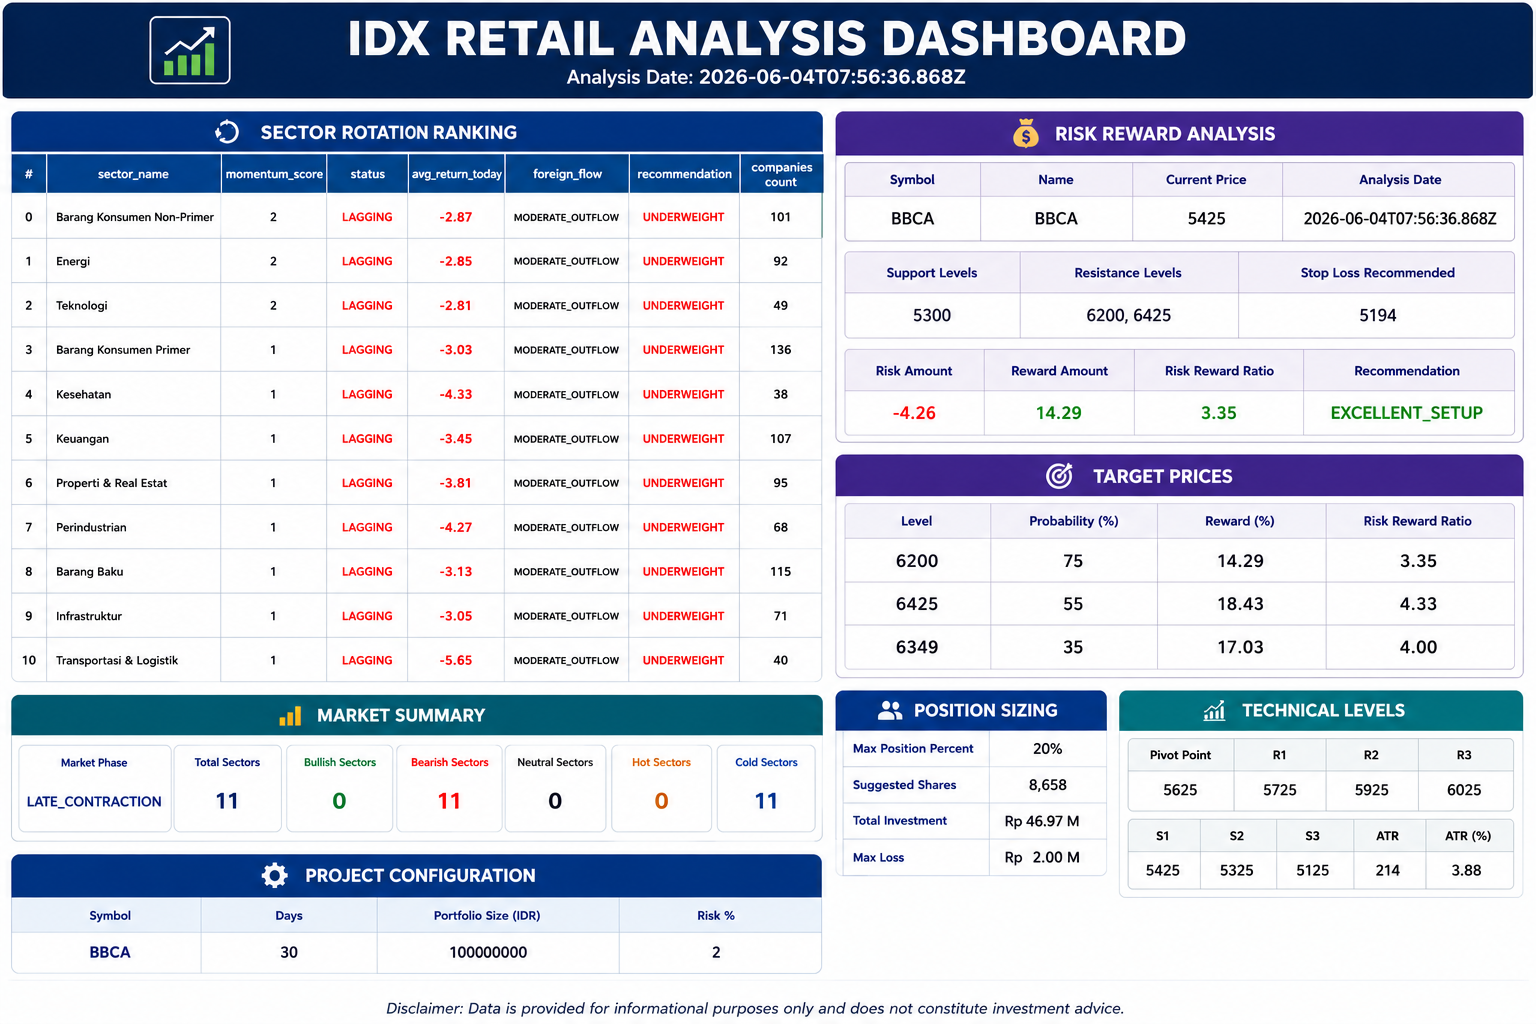
Cell 5 creates the final dashboard.
The dashboard displays sector rotation ranking, top sectors, risk reward analysis, market summary, and project configuration.
Sector data is sorted by momentum_score, allowing users to quickly identify sectors with stronger momentum. The risk reward data is normalized into a dataframe, making it easier to review potential trading risk and reward.
This final dashboard turns raw API data into practical investment information.
Result:
Overall Workflow
This notebook starts by importing the required Python libraries.
Then, it configures the project settings, including API credentials, stock symbol, portfolio size, and risk percentage.
After that, the notebook defines reusable functions for safe API requests and dataframe conversion.
Next, it checks the structure of the Sector Rotation and Risk Reward responses.
Finally, it builds a simple dashboard that displays sector rankings, top sectors, risk-reward data, market summary, and project configuration.
Why This Case Matters
Sector rotation helps investors understand where market strength is moving.
When a sector shows strong momentum, it may indicate increasing investor interest or stronger market participation. However, momentum alone is not enough.
Risk Reward Analysis helps investors evaluate whether a trade idea is worth taking based on potential gain and possible loss.
By combining both views, investors can avoid relying only on market excitement and start using a more structured investment process.
Conclusion
This notebook demonstrates how to use Python for Sector Rotation and Risk Reward Analysis.
The workflow helps investors monitor sector momentum, identify leading sectors, review market conditions, and evaluate risk-reward data from a single dashboard.
For investors, analysts, and fintech developers, this project provides a practical foundation for building a simple investment intelligence dashboard using Python and IDX API.