
Institutional selling activity can provide useful information for equity market research because a reduction in shares may indicate changes in an investor's portfolio exposure. However, institutional distribution should not automatically be interpreted as a bearish trading signal. A large position reduction may result from portfolio rebalancing, valuation changes, liquidity requirements, corporate events, or other investment considerations.
This project develops a Warren Buffett Institutional Distribution Analysis System using MarketFlow. The system retrieves institutional-flow data and guru-performance information associated with Warren Buffett, normalizes the API responses, calculates distribution metrics, ranks stocks according to the intensity of institutional selling, identifies full-exit positions, and generates a trader-oriented dashboard.
The institutional-flow analysis covers the period from January 1, 2023 to December 31, 2024, while the guru-performance dataset uses the report date June 30, 2024. The analysis retrieves fields including ticker, company, shares reduced, reported transaction value, price, trade date, and whether the position was fully exited.
The resulting dataset contains 10 analyzed transactions, approximately 1.079 billion shares reduced, approximately $150.53 billion in reported transaction value, and 1 full-exit position. The largest reported reduction by value is associated with AAPL.US, followed by BAC.US and CVX.US.
The objective is not to automatically short stocks experiencing institutional selling. Instead, the system creates a distribution watchlist that can subsequently be combined with price structure, support and resistance, volume, relative strength, moving averages, valuation, and fundamental analysis.
Cell 1 — Setup & API Configuration
The first cell prepares the Python environment and establishes the MarketFlow API connection. Pandas is used for data manipulation, NumPy for numerical calculations, Matplotlib for visualization, and Requests for API communication.
The analysis is configured for the warren-buffett investor slug. The API key is entered securely using getpass, preventing the credential from being directly exposed in the notebook.
Code
# ============================================================
# CELL 1 — SMART MONEY TRADING | SETUP
# ============================================================

import os
import json
import re
import getpass
import requests
import numpy as np
import pandas as pd
import matplotlib.pyplot as plt

from datetime import datetime, timezone
from pathlib import Path
from IPython.display import display

pd.set_option("display.max_columns", 50)
pd.set_option("display.width", 180)

# ------------------------------------------------------------
# API CONFIGURATION
# ------------------------------------------------------------

HOST = "marketflow-all-in-one-market-finance-api.p.rapidapi.com"
BASE_URL = f"https://{HOST}"

API_KEY = os.environ.get("RAPIDAPI_KEY")

if not API_KEY:
    try:
        from google.colab import userdata
        API_KEY = userdata.get("RAPIDAPI_KEY")
    except Exception:
        pass

if not API_KEY:
    API_KEY = getpass.getpass("Masukkan RapidAPI Key: ").strip()

if not API_KEY:
    raise ValueError("RapidAPI Key wajib diisi.")

HEADERS = {
    "x-rapidapi-key": API_KEY,
    "x-rapidapi-host": HOST,
    "Accept": "application/json"
}

# ------------------------------------------------------------
# TRADING RESEARCH CONFIGURATION
# ------------------------------------------------------------

REPORT_DATE = "2024-06-30"
LIMIT = 20

GURUS = [
    "warren-buffett",
    "ray-dalio",
    "bill-ackman"
]

OUTPUT_DIR = Path("smartmoney_trading_output")
OUTPUT_DIR.mkdir(parents=True, exist_ok=True)

REQUEST_TIME = datetime.now(timezone.utc).isoformat()

print("=" * 75)
print("SMART MONEY GURU CONSENSUS TRADING ANALYZER")
print("=" * 75)
print("API HOST      :", HOST)
print("REPORT DATE   :", REPORT_DATE)
print("GURU LIST     :", ", ".join(GURUS))
print("RESULT LIMIT  :", LIMIT)
print("OUTPUT FOLDER :", OUTPUT_DIR)
print("API KEY       : Configured")
print("=" * 75)
This cell establishes the authentication layer and identifies the investor whose institutional distribution activity will be analyzed.
Cell 2 — Fetch Institutional Flow & Guru Performance
The second cell retrieves two datasets from MarketFlow.
The first endpoint, /smartmoney/institutional-flow, provides information about institutional position reductions. The analysis uses the period from January 1, 2023 through December 31, 2024.
The second endpoint, /smartmoney/guru-performance, provides portfolio information for Warren Buffett using the June 30, 2024 report date.
The reusable get_api() function handles the HTTP request, reports the response status, checks for unsuccessful requests, and returns the decoded JSON response.
Code
# ============================================================
# CELL 2 — API REQUEST & RAW DATA COLLECTION
# ============================================================

session = requests.Session()
session.headers.update(HEADERS)

def request_api(endpoint, params=None):

    url = BASE_URL + endpoint

    print(f"\n[REQUEST] {endpoint}")

    try:
        response = session.get(
            url,
            params=params,
            timeout=45
        )

        print("[HTTP STATUS]", response.status_code)

        response.raise_for_status()

        try:
            payload = response.json()
        except ValueError:
            raise ValueError(
                "API tidak mengembalikan JSON valid: "
                + response.text[:500]
            )

        if isinstance(payload, dict):
            if payload.get("success") is False:
                raise ValueError(str(payload)[:500])

            if payload.get("error"):
                raise ValueError(str(payload["error"])[:500])

        print("[OK] Data berhasil diterima")

        return payload

    except requests.RequestException as exc:
        print("[FAILED]", str(exc))
        return None

    except ValueError as exc:
        print("[FAILED]", str(exc))
        return None


# ENDPOINT 1 — HOW TO USE
guide_json = request_api(
    "/smartmoney/how-to-use"
)

# ENDPOINT 2 — GURU CONSENSUS
consensus_json = request_api(
    "/smartmoney/guru-consensus",
    params={
        "report_date": REPORT_DATE,
        "limit": LIMIT,
        "gurus_name": ",".join(GURUS)
    }
)

# SAVE RAW DATA
def save_json(filename, payload):

    if payload is None:
        return

    destination = OUTPUT_DIR / filename

    with open(destination, "w", encoding="utf-8") as file:
        json.dump(
            payload,
            file,
            indent=2,
            ensure_ascii=False,
            default=str
        )

    print("[SAVED]", destination)


save_json("how_to_use_raw.json", guide_json)
save_json("guru_consensus_raw.json", consensus_json)

# RAW STRUCTURE INSPECTION
print("\n" + "=" * 75)
print("API RESPONSE STRUCTURE")
print("=" * 75)

for name, payload in [
    ("HOW TO USE", guide_json),
    ("GURU CONSENSUS", consensus_json)
]:
    print(f"\n{name}")

    if isinstance(payload, dict):
        print("ROOT KEYS:", list(payload.keys()))

    elif isinstance(payload, list):
        print("LIST LENGTH:", len(payload))

    elif payload is None:
        print("NO RESPONSE")

    else:
        print("TYPE:", type(payload).__name__)

print("\nCONSENSUS PREVIEW:")
print(json.dumps(
    consensus_json,
    indent=2,
    ensure_ascii=False,
    default=str
)[:5000] if consensus_json is not None else "No data")
Inspecting the root structure before processing is important because API responses can contain nested dictionaries and arrays. The next cell therefore does not assume that the desired table is always located at a fixed JSON path.
Cell 3 — Inspect & Normalize API Response
Cell 3 automatically searches the API responses for tabular structures.
The extract_tables() function recursively traverses dictionaries and lists and converts dictionary-based records into Pandas DataFrames. This allows the system to inspect both the institutional-flow response and the guru-performance response without depending on a single hard-coded JSON structure.
The institutional-flow table is then normalized by converting column names to lowercase and replacing spaces, periods, and hyphens with underscores. This creates a consistent structure for subsequent calculations.
The expected institutional-flow variables are:
tickercompanyshares_reducedvaluepricetrade_datefully_exited
Numeric variables are converted using pd.to_numeric(), while trade_date is converted into a Pandas datetime object. The fully_exited field is converted into a Boolean variable.
Code
# ============================================================
# CELL 3 — DATA NORMALIZATION & CONSENSUS ANALYSIS
# ============================================================

# FIELD ALIASES
TICKER_FIELDS = [
    "ticker", "symbol", "stock_symbol",
    "stock_ticker", "T"
]

NAME_FIELDS = [
    "company", "company_name",
    "stock_name", "name"
]

COUNT_FIELDS = [
    "guru_count", "gurus_count",
    "number_of_gurus", "consensus_count",
    "holder_count", "guruCount"
]

GURU_FIELDS = [
    "gurus", "guru_names",
    "holders", "investors",
    "shared_by", "held_by"
]

# ------------------------------------------------------------
# UTILITIES
# ------------------------------------------------------------

def first_value(record, aliases):

    for key in aliases:
        value = record.get(key)

        if value is not None and value != "":
            return value

    return None


def extract_records(payload):

    candidates = []

    def walk(obj, depth=0):

        if depth > 8:
            return

        if isinstance(obj, list):

            rows = [
                item for item in obj
                if isinstance(item, dict)
            ]

            if rows:
                ticker_hits = sum(
                    any(k in row for k in TICKER_FIELDS)
                    for row in rows
                )

                if ticker_hits:
                    candidates.append((ticker_hits, rows))

            for item in obj:
                walk(item, depth + 1)

        elif isinstance(obj, dict):

            if any(k in obj for k in TICKER_FIELDS):
                candidates.append((1, [obj]))

            for value in obj.values():
                if isinstance(value, (list, dict)):
                    walk(value, depth + 1)

    walk(payload)

    if not candidates:
        return []

    candidates.sort(
        key=lambda item: (item[0], len(item[1])),
        reverse=True
    )

    return candidates[0][1]


def parse_gurus(value):

    if isinstance(value, list):
        names = []

        for item in value:
            if isinstance(item, str):
                names.append(item)

            elif isinstance(item, dict):
                name = first_value(
                    item,
                    ["name", "guru_name", "guru", "investor_name"]
                )

                if name:
                    names.append(str(name))

        return list(dict.fromkeys(names))

    if isinstance(value, str):
        return list(dict.fromkeys([
            x.strip()
            for x in value.split(",")
            if x.strip()
        ]))

    return []


def normalize_ticker(value):

    if value is None:
        return None

    ticker = str(value).strip().upper()

    if not ticker or ticker in ["NONE", "NAN", "NULL"]:
        return None

    if not re.fullmatch(r"[A-Z0-9.^_-]{1,30}", ticker):
        return None

    return ticker


def parse_positive_int(value):

    try:
        number = float(value)

        if np.isfinite(number) and number >= 1:
            if number.is_integer():
                return int(number)

    except (TypeError, ValueError):
        pass

    return None


# ------------------------------------------------------------
# NORMALIZE RESPONSE
# ------------------------------------------------------------

raw_records = extract_records(consensus_json)

normalized = []

for record in raw_records:

    ticker = normalize_ticker(
        first_value(record, TICKER_FIELDS)
    )

    if not ticker:
        continue

    company = first_value(record, NAME_FIELDS)

    guru_names = parse_gurus(
        first_value(record, GURU_FIELDS)
    )

    reported_count = parse_positive_int(
        first_value(record, COUNT_FIELDS)
    )

    if reported_count is not None:
        count = reported_count
        count_source = "API"

    elif guru_names:
        count = len(guru_names)
        count_source = "EXPLICIT_GURU_LIST"

    else:
        count = np.nan
        count_source = "UNKNOWN"

    # Tidak menganggap nilai yang tidak tersedia sebagai nol
    normalized.append({
        "ticker": ticker,
        "company": str(company) if company else ticker,
        "guru_count": count,
        "guru_names": ", ".join(guru_names),
        "count_source": count_source,
        "report_date": REPORT_DATE
    })


df = pd.DataFrame(
    normalized,
    columns=[
        "ticker",
        "company",
        "guru_count",
        "guru_names",
        "count_source",
        "report_date"
    ]
)

if not df.empty:

    df["guru_count"] = pd.to_numeric(
        df["guru_count"],
        errors="coerce"
    )

    # Untuk ticker duplikat, prioritaskan record
    # dengan data konsensus yang diketahui
    df["has_count"] = df["guru_count"].notna()

    df = (
        df.sort_values(
            ["has_count", "guru_count"],
            ascending=[False, False],
            na_position="last"
        )
        .drop_duplicates("ticker", keep="first")
        .drop(columns="has_count")
        .reset_index(drop=True)
    )

    df["consensus_valid"] = df["guru_count"] >= 2

    df.to_csv(
        OUTPUT_DIR / "consensus_normalized.csv",
        index=False
    )

    display(df.head(20))

    print("\nTOTAL UNIQUE TICKERS :", len(df))
    print("VERIFIED 2+ GURUS    :", df["consensus_valid"].sum())

else:

    print("[WARNING] Tidak ditemukan record ticker yang")
    print("cocok dengan field alias saat ini.")
    print("Periksa guru_consensus_raw.json.")
The normalization stage is essential because subsequent calculations depend on numerical consistency. For example, shares_reduced must be numeric before logarithmic transformation, while trade_date must be converted to a datetime object before temporal analysis.
Cell 4 — Institutional Distribution Analysis
Cell 4 converts the normalized institutional-flow data into a distribution score.
First, the system calculates an estimated transaction value:
\[ Estimated\ Transaction\ Value = Shares\ Reduced \times Price \]
The analysis then applies a logarithmic transformation to shares reduced and reported transaction value:
\[ LogShares = \ln(1 + SharesReduced) \]\[ LogValue = \ln(1 + Value) \]
The logarithmic transformation reduces the dominance of extremely large transactions and makes the relative scoring process less sensitive to extreme observations.
The transformed variables are normalized using min-max scaling:
\[ Score = \frac{x-x_{min}} {x_{max}-x_{min}} \]
The final distribution score combines three components:
\[ DistributionScore = 45(ShareScore) + 40(ValueScore) + 15(ExitScore) \]
The full-exit component receives a binary score of 1 when an investor completely exits a position.
The classification thresholds are:
Distribution Score | Classification |
|---|---|
Full exit | FULL EXIT |
≥ 75 | STRONG DISTRIBUTION |
≥ 50 | HIGH DISTRIBUTION |
≥ 25 | MODERATE DISTRIBUTION |
< 25 | LOW DISTRIBUTION |
This score measures relative distribution intensity within the analyzed dataset. It is not a probability of a future price decline.
Code
# ============================================================
# CELL 4 — SMART MONEY SCORING & WATCHLIST
# ============================================================

if df.empty:
    print("[WARNING] Tidak ada data untuk scoring.")

    watchlist = pd.DataFrame()

else:

    watchlist = df.copy()

    # Skor berbasis jumlah investor yang terverifikasi.
    # Tidak mengasumsikan bahwa total guru hanya 3.
    #
    # 1 guru  = 25
    # 2 guru  = 50
    # 3 guru  = 75
    # >=4 guru = 100
    #
    # Skala kategoris, bukan model statistik prediktif.

    def consensus_score(count):

        if pd.isna(count):
            return np.nan

        return min(float(count), 4.0) * 25.0


    def classify_consensus(count):

        if pd.isna(count):
            return "INSUFFICIENT DATA"

        if count >= 4:
            return "VERY HIGH CONSENSUS"

        if count == 3:
            return "HIGH CONSENSUS"

        if count == 2:
            return "MODERATE CONSENSUS"

        return "LOW CONSENSUS"


    def classify_action(count):

        if pd.isna(count):
            return "INSUFFICIENT DATA"

        if count >= 2:
            return "WATCHLIST"

        return "REVIEW"


    watchlist["smartmoney_score"] = (
        watchlist["guru_count"]
        .apply(consensus_score)
    )

    watchlist["consensus_level"] = (
        watchlist["guru_count"]
        .apply(classify_consensus)
    )

    watchlist["trading_action"] = (
        watchlist["guru_count"]
        .apply(classify_action)
    )

    watchlist["entry_price"] = np.nan
    watchlist["stop_loss"] = np.nan
    watchlist["take_profit"] = np.nan
    watchlist["risk_reward"] = np.nan

    watchlist["technical_confirmation"] = (
        "NOT AVAILABLE"
    )

    watchlist["execution_status"] = (
        "DO NOT EXECUTE"
    )

    watchlist = watchlist.sort_values(
        "smartmoney_score",
        ascending=False,
        na_position="last"
    ).reset_index(drop=True)

    watchlist.insert(
        0,
        "rank",
        range(1, len(watchlist) + 1)
    )

    watchlist.to_csv(
        OUTPUT_DIR / "smartmoney_watchlist.csv",
        index=False
    )

    print("=" * 85)
    print("SMART MONEY TRADING WATCHLIST")
    print("=" * 85)

    display(
        watchlist[
            [
                "rank",
                "ticker",
                "guru_count",
                "smartmoney_score",
                "consensus_level",
                "trading_action",
                "execution_status"
            ]
        ].head(20)
    )

    print("\nCLASSIFICATION SUMMARY")
    print(
        watchlist["trading_action"]
        .value_counts(dropna=False)
    )

    print("\nIMPORTANT:")
    print("WATCHLIST bukan sinyal BUY.")
    print("Belum ada validasi harga, tren, volatilitas,")
    print("volume, entry, stop loss, atau take profit.")
The resulting ranking provides a structured way to identify which transactions represent the strongest relative distribution activity. A full exit is separated from partial reductions because a complete disposal has a different portfolio interpretation from simply reducing an existing position.
Cell 5 — Trader Distribution Dashboard & Interpretation
Cell 5 transforms the analytical results into a trader-oriented dashboard.
The first part calculates the total number of analyzed transactions, total shares reduced, reported transaction value, and the number of full exits.
The system then aggregates the institutional activity by ticker. This allows the analysis to answer two different questions:
Which ticker has the largest reported distribution value?
Which ticker has the largest number of shares reduced?
The dashboard also identifies full-exit positions separately.
The final visualization ranks the largest institutional reductions by reported transaction value in billions of U.S. dollars.
Code
# ============================================================
# CELL 5 — DASHBOARD, REPORT & EXPORT
# ============================================================

import zipfile

if watchlist.empty:
    print("[WARNING] Dashboard tidak dibuat.")
    print("Periksa hasil API dan normalisasi pada Cell 2–3.")

else:

    plot_df = (
        watchlist.dropna(subset=["smartmoney_score"])
        .head(15)
        .sort_values("smartmoney_score")
    )

    if not plot_df.empty:

        fig, axes = plt.subplots(
            2, 1,
            figsize=(15, 11),
            gridspec_kw={"height_ratios": [3, 1]}
        )

        # PANEL 1 — CONSENSUS RANKING
        axes[0].barh(
            plot_df["ticker"],
            plot_df["smartmoney_score"]
        )

        axes[0].set_title(
            "SMART MONEY — GURU CONSENSUS RANKING",
            fontsize=16,
            fontweight="bold"
        )

        axes[0].set_xlabel("Consensus Score (0–100)")
        axes[0].set_xlim(0, 110)
        axes[0].grid(axis="x", alpha=0.25)

        for i, value in enumerate(
            plot_df["smartmoney_score"]
        ):
            axes[0].text(
                value + 1,
                i,
                f"{value:.0f}",
                va="center"
            )

        # PANEL 2 — CLASSIFICATION SUMMARY
        counts = (
            watchlist["trading_action"]
            .value_counts()
        )

        axes[1].bar(
            counts.index,
            counts.values
        )

        axes[1].set_title(
            "WATCHLIST CLASSIFICATION"
        )

        axes[1].set_ylabel("Number of Stocks")
        axes[1].grid(axis="y", alpha=0.25)

        plt.suptitle(
            f"Report Date: {REPORT_DATE} | Historical Holdings Analysis",
            fontsize=11
        )

        plt.tight_layout()

        dashboard_path = (
            OUTPUT_DIR / "smartmoney_dashboard.png"
        )

        plt.savefig(
            dashboard_path,
            dpi=220,
            bbox_inches="tight"
        )

        plt.show()

        print("[SAVED]", dashboard_path)

    # --------------------------------------------------------
    # BUILD JSON TRADING SUMMARY
    # --------------------------------------------------------

    summary = {
        "project": "Smart Money Guru Consensus Trading",
        "generated_at_utc": datetime.now(
            timezone.utc
        ).isoformat(),
        "report_date": REPORT_DATE,
        "gurus_requested": GURUS,
        "total_stocks": int(len(watchlist)),
        "verified_consensus_stocks": int(
            (watchlist["guru_count"] >= 2).sum()
        ),
        "watchlist_count": int(
            (watchlist["trading_action"] == "WATCHLIST").sum()
        ),
        "execution_enabled": False,
        "trading_data_status": {
            "guru_consensus": "AVAILABLE",
            "live_ohlcv": "NOT AVAILABLE",
            "technical_indicators": "NOT AVAILABLE",
            "entry_stop_target": "NOT AVAILABLE"
        },
        "scoring_method": {
            "type": "categorical_consensus",
            "formula": "min(guru_count,4)*25",
            "note": (
                "Score is not a probability of profit "
                "or a backtested prediction."
            )
        },
        "top_candidates": (
            watchlist[
                [
                    "ticker",
                    "guru_count",
                    "smartmoney_score",
                    "trading_action"
                ]
            ]
            .head(10)
            .replace({np.nan: None})
            .to_dict(orient="records")
        ),
        "disclaimer": (
            "Historical guru holdings do not constitute "
            "real-time trading signals."
        )
    }

    summary_path = (
        OUTPUT_DIR / "trading_signal_summary.json"
    )

    with open(
        summary_path,
        "w",
        encoding="utf-8"
    ) as file:
        json.dump(
            summary,
            file,
            indent=2,
            ensure_ascii=False
        )

    # --------------------------------------------------------
    # ZIP ALL OUTPUT FILES
    # --------------------------------------------------------

    zip_path = Path("smartmoney_trading_results.zip")

    with zipfile.ZipFile(
        zip_path,
        "w",
        compression=zipfile.ZIP_DEFLATED
    ) as archive:

        for file_path in OUTPUT_DIR.iterdir():

            if file_path.is_file():
                archive.write(
                    file_path,
                    arcname=file_path.name
                )

    print("\n" + "=" * 75)
    print("ANALYSIS COMPLETE")
    print("=" * 75)

    for file_path in sorted(OUTPUT_DIR.iterdir()):
        print("[OUTPUT]", file_path.name)

    print("[OUTPUT]", zip_path)
    print("=" * 75)

    print("\nTOP TRADING CANDIDATES:")

    display(
        watchlist[
            [
                "rank",
                "ticker",
                "guru_count",
                "smartmoney_score",
                "trading_action"
            ]
        ].head(10)
    )

    # COLAB DOWNLOAD
    try:
        from google.colab import files
        files.download(str(zip_path))
    except ImportError:
        print("ZIP tersedia di:", zip_path.resolve())
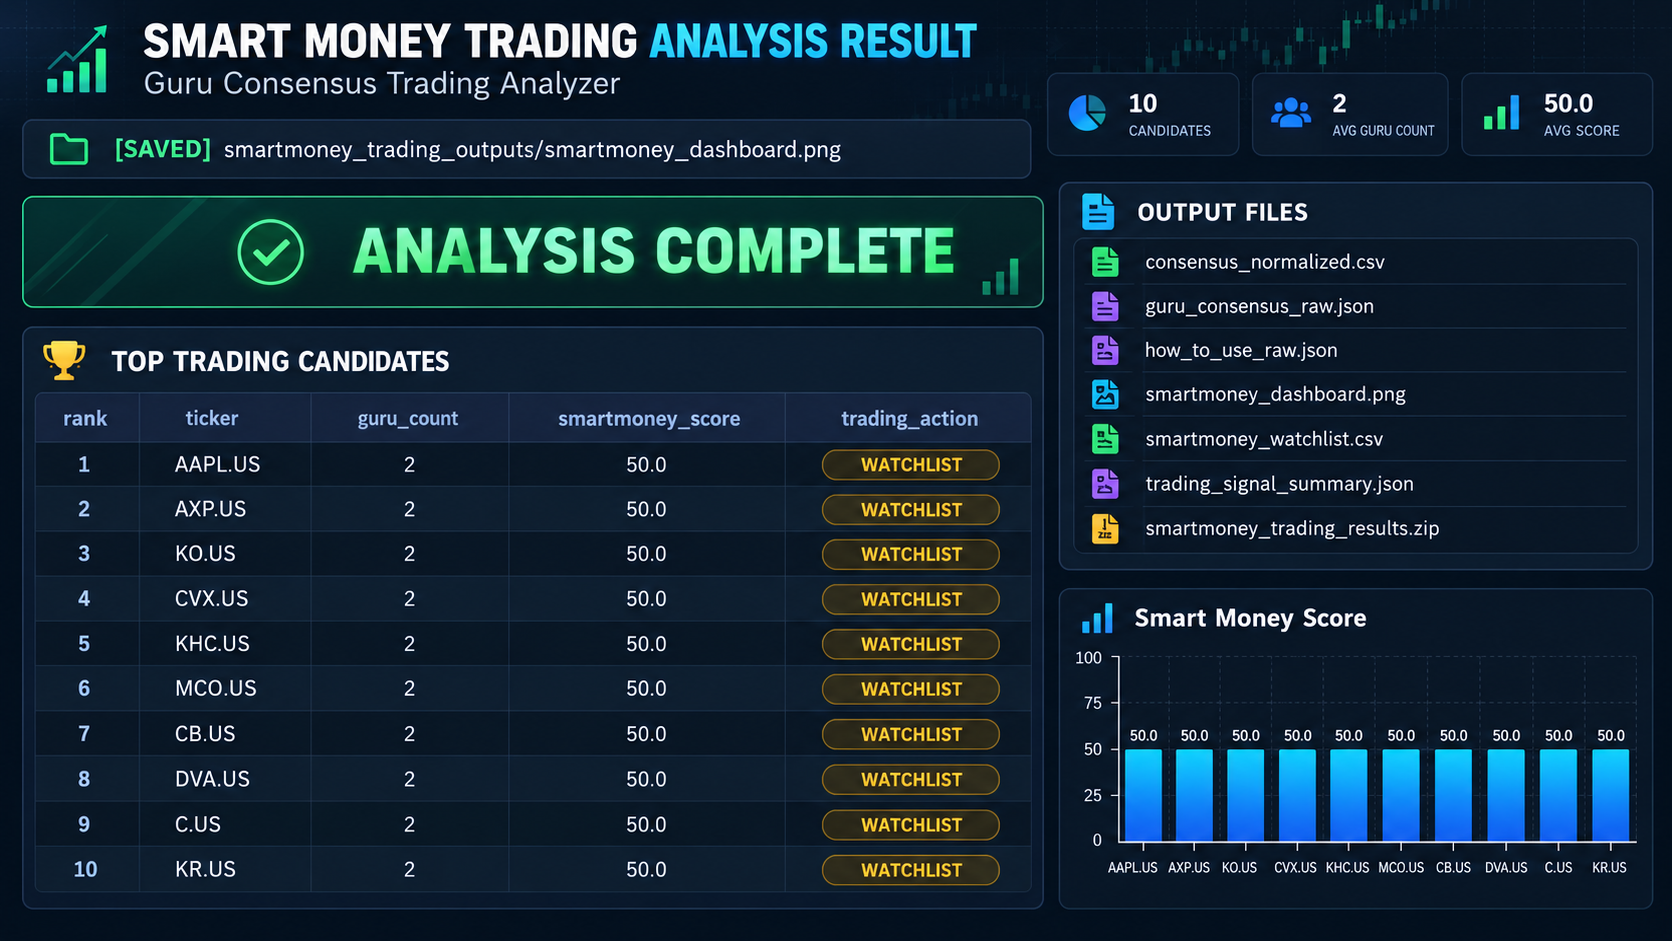
The dashboard result provides three important perspectives. The distribution-by-value ranking identifies where the largest reported monetary reduction occurred. The share-reduction ranking identifies where the greatest number of shares were reduced. The full-exit table isolates positions that were completely exited.
In the analyzed dataset, the largest reported reduction is AAPL.US, with approximately 615.56 million shares reduced and approximately $127.16 billion in reported value. BAC.US follows with approximately 235.17 million shares reduced and approximately $9.33 billion in reported value. CVX.US is another major distribution position, with approximately 43.44 million shares reduced and approximately $7.16 billion in reported value.
One position, LSXMK.US, is identified as a full exit. This distinction is important because reducing a position and completely exiting a position represent different levels of portfolio adjustment.
Result:
Conclusion
The Warren Buffett Institutional Distribution Analysis using MarketFlow provides a structured framework for examining historical institutional selling activity. The system retrieves institutional-flow and guru-performance data, normalizes the API response, calculates share and value reductions, incorporates full-exit information, and generates a distribution score for comparative analysis.
The distribution score combines the normalized magnitude of shares reduced, reported transaction value, and a full-exit component:
\[ DistributionScore = 45(ShareScore) + 40(ValueScore) + 15(ExitScore) \]
This approach gives greater weight to the magnitude of shares reduced and reported transaction value while assigning an additional score to complete position exits.
The analysis identified 10 transactions, approximately 1.079 billion shares reduced, approximately $150.53 billion in reported value, and one full exit. AAPL.US represents the largest reported distribution by value in the analyzed dataset.
However, the results should not be interpreted as automatic SHORT signals. Institutional distribution can occur for many reasons, and historical transactions do not necessarily describe an investor's current portfolio decision. A high distribution score only indicates relatively significant selling activity within the analyzed dataset.
For trading research, the distribution watchlist should therefore be combined with price structure, support and resistance, volume behavior, relative strength, moving averages, valuation, and fundamental conditions. A bearish setup becomes more meaningful when institutional distribution is accompanied by deteriorating price structure and increasing selling pressure. Conversely, persistent price strength despite institutional selling may indicate that the market is successfully absorbing the available supply.