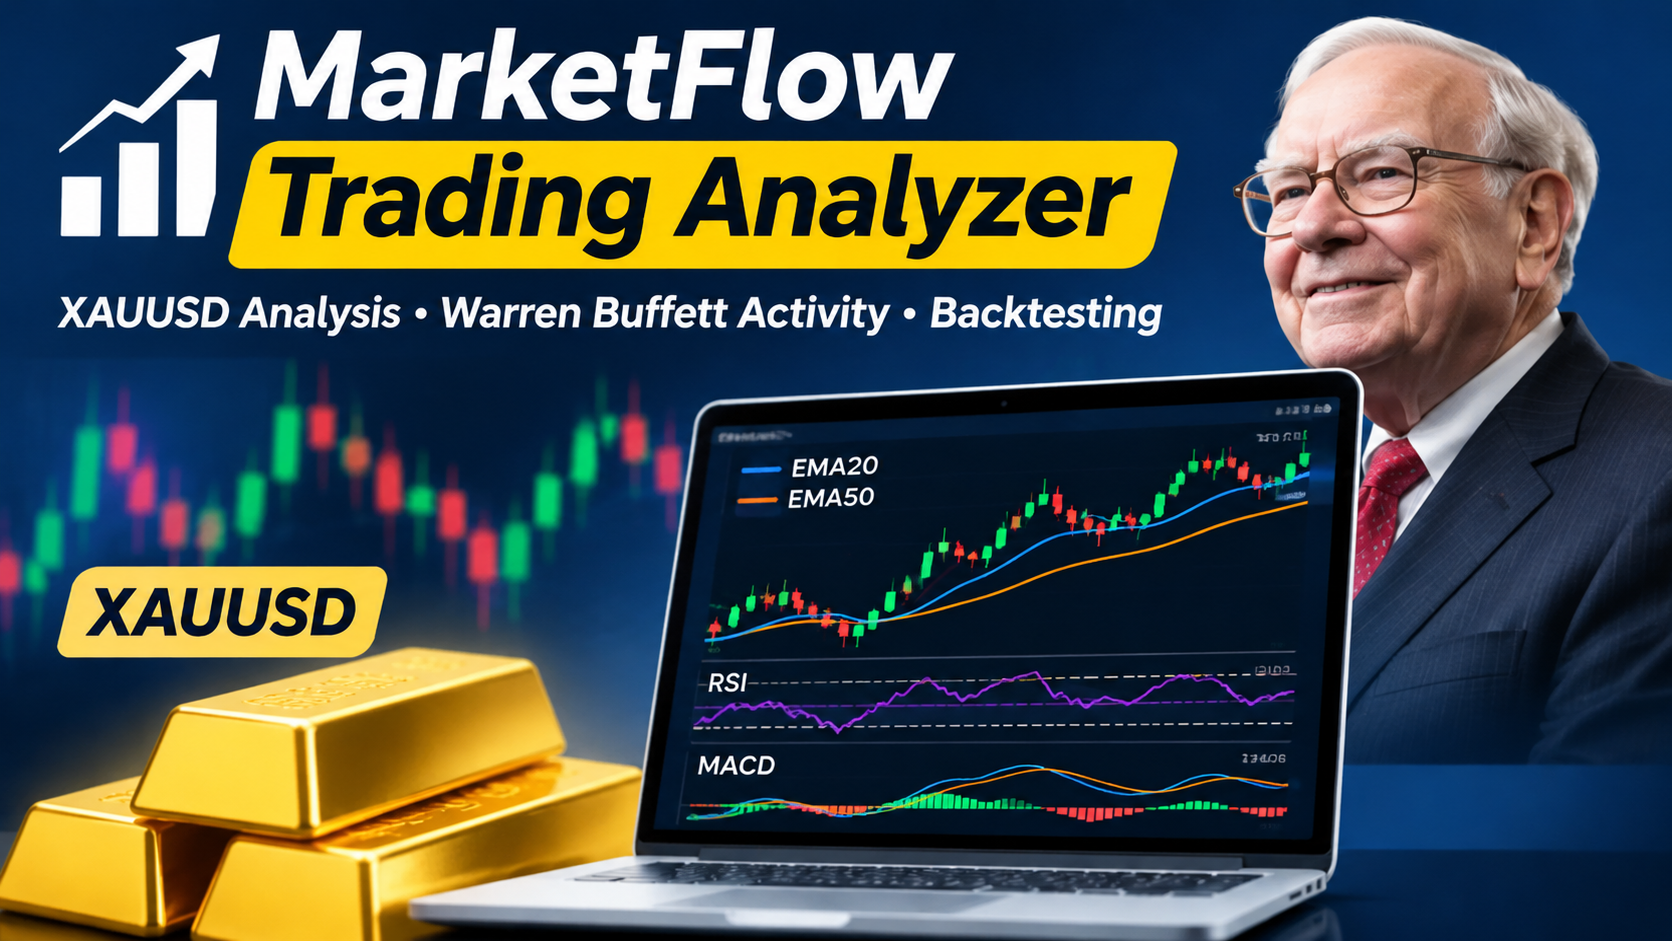
Financial markets are influenced by various factors, including macroeconomic conditions, monetary policies, geopolitical developments, institutional investment decisions, and changes in market sentiment. Gold (XAUUSD) is one of the financial instruments frequently monitored by traders because of its sensitivity to global economic uncertainty and its role as a safe-haven asset.
Analyzing gold price movements requires a systematic approach that can identify market direction, evaluate momentum, measure volatility, and determine potential trading opportunities. Technical analysis provides several tools for examining historical price behavior. Indicators such as the Exponential Moving Average (EMA), Relative Strength Index (RSI), Moving Average Convergence Divergence (MACD), and Average True Range (ATR) are commonly applied to assess market trends and trading conditions.
EMA20 and EMA50 provide information about the relationship between shorter-term and longer-term price trends. RSI measures the strength of recent price movements, while MACD evaluates momentum through the relationship between exponential moving averages. ATR provides an estimate of market volatility that can be incorporated into risk management calculations.
In addition to technical market conditions, institutional investment activity provides another perspective for examining financial markets. Reported transactions associated with prominent investors, including Warren Buffett, can be analyzed to identify the distribution of reported BUY and SELL activities. Combining these datasets allows an analytical system to examine market price behavior alongside reported investor transactions.
This article presents MarketFlow Trading Analyzer, a Python-based analytical framework developed using the MarketFlow All-in-One Market Finance API through RapidAPI. The system focuses on OANDA:XAUUSD using the Daily timeframe and retrieves 100 historical price candles for technical analysis.
The framework calculates EMA20, EMA50, RSI14, MACD, MACD signal, MACD histogram, and ATR14. These indicators are integrated into a rule-based trading signal engine that classifies market conditions into BUY, SELL, and HOLD signals.
The system also incorporates Warren Buffett transaction activity using the investor identifier warren-buffett. BUY and SELL records are retrieved for the period April 1, 2025, to July 1, 2025. These records are processed separately and summarized according to transaction type.
Furthermore, the framework includes an ATR-based risk management mechanism, position sizing based on a predefined percentage of initial capital, and historical backtesting. Strategy performance is evaluated using net profit or loss, total return, maximum drawdown, and position entries.
The primary objective is to demonstrate how Python and financial APIs can be integrated into an automated financial analysis framework that combines technical market analysis, institutional transaction monitoring, trading signal generation, risk management, and performance visualization.
2. Methodology
The MarketFlow Trading Analyzer consists of five computational cells. Each cell performs a specific function within the financial analysis workflow.
Cell | Main function |
|---|---|
Cell 1 | Library installation, API authentication, and trading configuration. |
Cell 2 | XAUUSD historical price data retrieval and OHLC normalization. |
Cell 3 | Technical indicator calculations and trading signal generation. |
Cell 4 | Warren Buffett BUY and SELL transaction retrieval and analysis. |
Cell 5 | Trading decision, ATR-based risk management, backtesting, dashboard, and data export. |
2.1. System Configuration and API Integration
The system uses Python libraries including Requests, Pandas, NumPy, Matplotlib, and Tabulate.
The MarketFlow API is accessed through RapidAPI. Authentication is handled using the getpass module to avoid displaying the API key directly in the notebook.
The trading configuration uses the OANDA:XAUUSD instrument, Daily timeframe, and Asia/Jakarta timezone. The system retrieves 100 historical price candles.
The initial capital is configured at USD 10,000, with a predefined risk percentage of 1% per trading position. The technical indicator parameters include EMA20, EMA50, RSI14, and ATR14.
Code — Cell 1: Configuration and API Setup
# ============================================================# CELL 1: MARKETFLOW TRADING ANALYZER# Configuration & API Setup# ============================================================!pip -q install pandas numpy matplotlib requests tabulateimport requestsimport pandas as pdimport numpy as npimport matplotlib.pyplot as pltimport jsonimport warningsfrom getpass import getpassfrom datetime import datetimewarnings.filterwarnings("ignore")# API CONFIGURATIONAPI_HOST = "marketflow-all-in-one-market-finance-api.p.rapidapi.com"BASE_URL = f"https://{API_HOST}"RAPIDAPI_KEY = getpass("Masukkan RapidAPI Key: ")HEADERS = { "x-rapidapi-key": RAPIDAPI_KEY, "x-rapidapi-host": API_HOST}# MARKET CONFIGURATIONSYMBOL = "OANDA:XAUUSD"TIMEFRAME = "D"TIMEZONE = "Asia/Jakarta"PRICE_RANGE = 100# TRADE ACTIVITY CONFIGURATION2.2. Market Data Acquisition and OHLC Normalization
The second stage retrieves historical XAUUSD price data through the /v2/chart/price API endpoint.
The request includes four parameters: historical candle range, timeframe, timezone, and trading symbol.
The find_ohlc_records() function searches the nested JSON response to identify records containing Open, High, Low, and Close values. The system supports alternative field names, including o, h, l, and c.
The normalize_ohlc() function subsequently converts the retrieved information into a structured Pandas DataFrame. It also performs numeric conversion, timestamp normalization, chronological sorting, duplicate removal, and missing-value handling.
This process produces a standardized OHLC dataset for subsequent technical analysis.
Code — Cell 2: Market Data Acquisition
# ============================================================# CELL 2: MARKET DATA ACQUISITION# ============================================================def api_get(endpoint, params): url = f"{BASE_URL}{endpoint}" response = requests.get( url, headers=HEADERS, params=params, timeout=30 ) response.raise_for_status() return response.json()def find_ohlc_records(obj): """Mencari kumpulan data OHLC dalam respons JSON.""" aliases = { "open": ["open", "o"], "high": ["high", "h"], "low": ["low", "l"], "close": ["close", "c"] } if isinstance(obj, dict): keys = {str(k).lower() for k in obj.keys()} if all(any(a in keys for a in v) for v in aliases.values()): return [obj] for value in obj.values(): result = find_ohlc_records(value) if result:2.3. Technical Analysis Engine
The third stage calculates technical indicators using the historical XAUUSD closing prices.
Exponential Moving Average (EMA)
EMA20 and EMA50 are calculated using exponentially weighted moving averages. EMA20 represents the shorter-term price trend, while EMA50 represents the longer-term trend.
Relative Strength Index (RSI)
RSI14 measures the relative strength of upward and downward price movements. The implementation uses exponentially smoothed average gains and losses.
Moving Average Convergence Divergence (MACD)
MACD is calculated using the difference between EMA12 and EMA26. A nine-period EMA is then applied to generate the MACD signal line. The difference between MACD and its signal line produces the MACD histogram.
Average True Range (ATR)
ATR14 measures price volatility using three components: the high-low range, the absolute difference between the current high and previous close, and the absolute difference between the current low and previous close.
The technical analysis engine subsequently identifies market trend and momentum conditions.
The BUY signal requires EMA20 above EMA50, closing price above EMA20, RSI between 50 and 70, and MACD above its signal line.
The SELL signal requires EMA20 below EMA50, closing price below EMA20, RSI between 30 and 50, and MACD below its signal line.
If neither condition is fulfilled, the system assigns HOLD.
Code — Cell 3: Technical Analysis Engine
# ============================================================# CELL 3: TECHNICAL ANALYSIS ENGINE# ============================================================# EMAdf["EMA20"] = df["close"].ewm( span=EMA_FAST, adjust=False).mean()df["EMA50"] = df["close"].ewm( span=EMA_SLOW, adjust=False).mean()# RSI 14delta = df["close"].diff()gain = delta.clip(lower=0)loss = -delta.clip(upper=0)avg_gain = gain.ewm( alpha=1/RSI_PERIOD, min_periods=RSI_PERIOD, adjust=False).mean()avg_loss = loss.ewm( alpha=1/RSI_PERIOD, min_periods=RSI_PERIOD, adjust=False).mean()rs = avg_gain / avg_loss.replace(0, np.nan)df["RSI"] = 100 - (100 / (1 + rs))2.4. Warren Buffett Trade Activity Analysis
The fourth stage retrieves reported BUY and SELL transaction records associated with Warren Buffett.
The investor identifier is configured as warren-buffett, and the reporting period covers April 1, 2025, to July 1, 2025.
The /trade-activity endpoint is requested twice: once for BUY transactions and once for SELL transactions. Each request uses a maximum limit of 100 records.
The extract_activity() function searches the API response for transaction records, including nested JSON structures. Retrieved records are normalized into Pandas DataFrames and combined into one transaction dataset.
The system then calculates the number and percentage distribution of BUY and SELL records.
This analysis provides an additional view of reported investor activity alongside the technical condition of XAUUSD. However, the investor transaction dataset and gold price dataset represent different financial instruments and should be interpreted as separate analytical information rather than evidence of a direct causal relationship.
Code — Cell 4: Trade Activity Analysis
# ============================================================# CELL 4: TRADE ACTIVITY ANALYSIS# ============================================================activity_results = []for trade_type in ["buy", "sell"]: print(f"Downloading {trade_type.upper()} activity...") response = api_get( "/trade-activity", { "skip": 0, "trade_type": trade_type, "limit": TRADE_LIMIT, "slug": INVESTOR, "time_range": f"{TRADE_START}:{TRADE_END}" } ) activity_results.append({ "type": trade_type.upper(), "response": response })def extract_activity(obj): """Ekstraksi daftar transaksi dari JSON.""" if isinstance(obj, list): if obj and all(isinstance(x, dict) for x in obj): return obj for item in obj:2.5. Trading Decision, Risk Management, and Backtesting
The fifth stage integrates the latest technical analysis results into a trading decision dashboard.
The current closing price becomes the reference entry price. The system calculates the cash risk allowance using 1% of the initial capital.
The ATR-based stop distance is calculated as:
\[ Stop\ Distance=ATR\times ATR\ Multiplier \]
Position size is determined using:
\[ Position\ Size=\frac{Risk\ Amount}{Stop\ Distance} \]
For BUY signals, the stop-loss is positioned below the entry price, while the take-profit is positioned above it. For SELL signals, the levels are reversed.
The take-profit distance is set at twice the stop-loss distance, producing a nominal 1:2 risk-reward distance ratio.
The backtesting module shifts the trading signal by one candle to avoid using the current candle's signal for the same candle's return. It then calculates strategy returns and cumulative equity.
The performance evaluation includes:
Initial capital.
Final equity.
Net profit or loss.
Total return.
Maximum drawdown.
Number of position entries.
The module also compares the strategy equity curve against a buy-and-hold benchmark.
Code — Cell 5: Trading Decision, Backtest, and Dashboard
# ============================================================# CELL 5: TRADING DECISION & DASHBOARD# ============================================================# 1. LATEST MARKET CONDITIONlatest = df.iloc[-1]price = float(latest["close"])atr = float(latest["ATR"])signal = latest["SIGNAL"]# 2. RISK MANAGEMENTrisk_amount = INITIAL_CAPITAL * RISK_PERCENTif pd.notna(atr) and atr > 0: stop_distance = ATR_MULTIPLIER * atr position_size = risk_amount / stop_distanceelse: stop_distance = np.nan position_size = np.nanif signal == "BUY": entry = price stop_loss = entry - stop_distance take_profit = entry + (stop_distance * 2)Result:
3. Results and Discussion
3.1. XAUUSD Market Data Retrieval
The market data acquisition module retrieves historical price information for OANDA:XAUUSD using the MarketFlow API.
The system requests 100 Daily candles and extracts the OHLC information required for technical analysis.
The retrieved data are normalized into a structured DataFrame containing opening prices, highest prices, lowest prices, closing prices, and timestamps when available.
The resulting dataset provides the foundation for calculating technical indicators and identifying market conditions.
3.2. Technical Indicator Analysis
The technical analysis engine calculates five principal indicator outputs: EMA20, EMA50, RSI14, MACD, and ATR14.
EMA20 and EMA50 are used to identify the relationship between shorter-term and longer-term price trends. When EMA20 is above EMA50, the system identifies a bullish trend. Conversely, when EMA20 is below EMA50, the system identifies a bearish trend.
RSI14 provides information about market momentum. The system uses RSI values between 50 and 70 as part of its BUY conditions and values between 30 and 50 as part of its SELL conditions.
MACD provides additional momentum confirmation by comparing the MACD line with its signal line.
ATR14 measures market volatility and becomes an input for the stop-loss and take-profit calculations.
The combination of these indicators provides a structured framework for identifying potential market opportunities.
3.3. Trading Signal Generation
The signal engine generates three possible classifications: BUY, SELL, and HOLD.
A BUY signal is generated when the bullish EMA structure, price position, RSI condition, and MACD confirmation occur simultaneously.
A SELL signal is generated when the corresponding bearish conditions are satisfied.
When the required conditions are not fulfilled, the system assigns HOLD.
This approach uses multiple technical indicators to establish signal confirmation rather than relying on a single indicator.
However, the generated signals represent rule-based technical classifications and do not guarantee profitable trading outcomes.
3.4. Warren Buffett Trade Activity
The investor activity module retrieves reported BUY and SELL transaction records associated with Warren Buffett.
The transaction data are processed separately and combined into a unified dataset.
The system calculates the total number of retrieved transactions and the percentage distribution of BUY and SELL records.
This analysis provides an additional financial information component within the MarketFlow Trading Analyzer dashboard.
It is important to note that Warren Buffett's reported transactions relate to securities associated with the investor dataset, whereas the technical analysis focuses on gold. Their integration is intended for broader financial monitoring rather than direct trading signal confirmation for XAUUSD.
3.5. Risk Management and Trading Decision
The risk management module calculates the predefined cash risk using 1% of the initial capital.
With an initial capital of USD 10,000, the nominal risk allowance is USD 100 per position.
The stop-loss distance is calculated using twice the ATR14 value. The take-profit distance is set at twice the stop-loss distance.
The resulting position size is calculated by dividing the nominal cash risk by the stop-loss distance.
These calculations provide a framework for evaluating potential entry, stop-loss, and take-profit levels.
Nevertheless, the calculated position size represents a simplified price-unit calculation. Actual XAUUSD position sizing must account for broker contract specifications, tick value, lot size, and account currency.
3.6. Backtesting Performance
The backtesting module evaluates the historical behavior of the trading signal rules using the retrieved price data.
The system shifts the signal by one candle before calculating strategy returns. This avoids applying the current candle's signal to the same candle's return.
The strategy equity curve is calculated through the cumulative product of historical strategy returns.
The performance evaluation includes:
Performance metric | Analytical purpose |
|---|---|
Initial Capital | Starting account balance. |
Final Equity | Account value at the end of the simulation. |
Net Profit/Loss | Difference between final equity and initial capital. |
Total Return | Percentage change in account equity. |
Maximum Drawdown | Largest percentage decline from a previous equity peak. |
Position Entries | Number of transitions from no position into an active position. |
The system also compares strategy equity with a buy-and-hold benchmark.
This comparison provides an additional perspective on how the trading rules behave relative to holding the underlying asset throughout the historical period.
Important methodological limitation: The supplied backtest is a simplified return-based simulation. It does not execute the ATR stop-loss and take-profit levels within historical candles, and it does not include spread, slippage, commission, or swap costs. Therefore, the results should not be interpreted as a complete simulation of the risk management mechanism or actual broker execution.
3.7. Trading Dashboard and Visualization
The final visualization module generates a three-panel financial dashboard.
MarketFlow Trading Dashboard
XAUUSD Price & Trading Signals
Displays historical closing prices, EMA20, EMA50, and BUY/SELL markers.
Relative Strength Index
Displays RSI14 with reference levels at 30, 50, and 70.
Backtest Equity Curve
Compares strategy equity with the buy-and-hold benchmark.
Warren Buffett Trade Activity
Separately compares the number of reported BUY and SELL records.
The visualizations are generated using Matplotlib and displayed directly in the notebook.
3.8. Data Export and Reporting
The system exports three principal CSV files:
File | Description |
|---|---|
| Historical prices, technical indicators, market conditions, and trading signals. |
| Historical strategy positions, returns, and equity values. |
| Retrieved Warren Buffett transaction records. |
These files allow the analytical results to be examined independently and used in subsequent financial research.
3.9. Limitations and Future Improvements
Several limitations should be considered when interpreting the analytical results.
First, the historical market data are limited to 100 Daily candles. A longer historical period would provide a broader basis for strategy evaluation.
Second, the trading signal engine uses fixed indicator parameters. EMA20, EMA50, RSI14, and ATR14 are not optimized for different market regimes.
Third, the backtesting module does not implement actual stop-loss and take-profit execution, despite calculating these levels for the latest trading decision.
Fourth, the model does not incorporate realistic transaction costs, including spread, slippage, commission, and swap.
Fifth, the investor activity dataset represents a separate analytical component and is not integrated into the XAUUSD signal calculation.
Future improvements could include:
Longer historical price datasets.
ATR-based stop-loss and take-profit execution in backtesting.
Realistic transaction cost modeling.
Risk-adjusted performance measurements.
Win rate and profit factor calculations.
Out-of-sample and walk-forward testing.
Automated market data updates.
Integration of institutional investor activity with broader market research.
These developments could improve the analytical depth and practical relevance of the framework.
4. Conclusion
This article presents MarketFlow Trading Analyzer, a Python-based financial analysis framework that integrates XAUUSD technical analysis, Warren Buffett transaction monitoring, trading signal generation, risk management, and historical backtesting.
The system retrieves historical gold price data through the MarketFlow All-in-One Market Finance API and calculates EMA20, EMA50, RSI14, MACD, and ATR14 to identify market trends and momentum conditions.
The technical analysis engine generates BUY, SELL, and HOLD classifications based on predefined indicator conditions. The risk management module calculates potential entry prices, stop-loss levels, take-profit levels, and position sizes using ATR-based volatility measurements and a predefined capital risk percentage.
In addition, the framework retrieves Warren Buffett BUY and SELL transaction records and summarizes their distribution to provide supplementary investor activity information.
The backtesting module evaluates historical strategy returns, equity development, net profit or loss, total return, maximum drawdown, and position entries. The final dashboard combines price analysis, technical indicators, strategy performance, and investor transaction activity.
Overall, MarketFlow Trading Analyzer provides an integrated foundation for automated financial analysis using Python and financial APIs. Although the current implementation offers a structured approach to market monitoring and strategy evaluation, further development is necessary to improve backtesting realism, transaction cost modeling, historical coverage, and risk-adjusted performance measurement.