Financial market analysis increasingly requires the integration of institutional investment information, corporate financial performance, and automated data processing. Understanding the investment activities of prominent investors can provide insights into reported stock positions, changes in shareholdings, and the distribution of investment values. These insights are particularly relevant for investors and financial analysts who want to examine institutional investment behavior through publicly available financial disclosures.
One of the most closely monitored investors is Warren Buffett. His investment activities, particularly those associated with Berkshire Hathaway, frequently attract attention from financial market participants. Reported stock transactions can provide information about newly established positions, increased holdings, and reductions in existing positions. However, interpreting these records requires more than simply identifying which stocks were purchased or sold. Analysts also need to examine the reported position values, changes in share quantities, and the relationship between investment activity and corporate financial announcements.
Manually collecting and comparing these financial records can be time-consuming. Different datasets may contain different ticker formats, reporting dates, company identifiers, and financial variables. Furthermore, connecting investment disclosures with earnings announcements requires additional data processing to identify securities appearing in both datasets.
Python provides an effective environment for automating these analytical activities. Through financial APIs and data processing libraries, Python can retrieve transaction records, normalize financial information, calculate changes in shareholdings, evaluate reported position values, and generate visual representations of investment activity.
This article presents MarketFlow Trading Analyzer, a Python-based financial analysis system developed using the MarketFlow All-in-One Market Finance API through RapidAPI. The system integrates two primary financial datasets: reported BUY transaction activity associated with Warren Buffett and corporate earnings event information.
The transaction analysis uses the investor identifier warren-buffett and examines the reporting period from April 1, 2025, to July 1, 2025. Meanwhile, earnings announcements are retrieved for the period November 2–9, 2025. Both datasets are processed independently before being compared through their ticker symbols.
The analytical framework calculates changes in shareholdings by comparing the reported number of shares before and after each transaction. Based on these calculations, the system classifies investment positions into four categories: NEW POSITION, INCREASED POSITION, REDUCED POSITION, and UNCHANGED.
In addition, the framework ranks stocks according to their reported position values, calculates total reported position value, and evaluates portfolio weight when the required portfolio value information is available. The system also identifies matching ticker symbols between the transaction and earnings datasets.
The earnings analysis examines actual and estimated earnings per share (EPS), actual and estimated revenue, and the difference between actual and estimated EPS. This provides an additional analytical perspective for examining corporate financial announcements associated with securities in the reported investment dataset.
The final system generates four financial visualizations covering reported stock positions, changes in shareholdings, portfolio weights, and earnings EPS surprises. It also exports the processed information into CSV files for further financial research and reporting.
The primary objective of this implementation is to demonstrate how Python and financial APIs can be integrated into an automated investment intelligence framework. By combining reported stock positions, shareholding changes, portfolio metrics, and corporate earnings information, MarketFlow Trading Analyzer provides a structured approach to examining institutional investment disclosures and related financial events.
2. Methodology
The MarketFlow Trading Analyzer framework consists of five computational cells. Each cell performs a specific function within the analytical workflow.
Cell | Main function |
|---|---|
Cell 1 | Library installation, API authentication, analysis period configuration, and output directory preparation. |
Cell 2 | Retrieval of Warren Buffett BUY transactions and corporate earnings events. |
Cell 3 | Data extraction, ticker normalization, shareholding change calculation, and position classification. |
Cell 4 | Stock holding analysis, position value ranking, portfolio metrics, and earnings ticker matching. |
Cell 5 | Financial visualization, executive summary generation, and CSV export. |
2.1. API Configuration and Analysis Period
The system uses the MarketFlow All-in-One Market Finance API through RapidAPI as its primary financial data provider.
API authentication is performed using a RapidAPI key entered interactively through Python's getpass module. This approach prevents the authentication credential from being directly displayed in the notebook.
Two separate reporting periods are configured. The first covers reported BUY transactions associated with the warren-buffett investor identifier from April 1, 2025, to July 1, 2025. The second covers earnings announcements from November 2, 2025, to November 9, 2025.
The output directory is configured as marketflow_results. This directory stores the original API responses, processed analytical datasets, summary statistics, and generated visualizations.
2.2. Financial Data Retrieval
The second stage retrieves financial information through two MarketFlow API endpoints.
Trade Activity
The /trade-activity endpoint retrieves reported BUY transaction records using the following parameters:
Parameter | Value |
|---|---|
skip | 0 |
trade_type | buy |
limit | 100 |
slug | warren-buffett |
time_range | 2025-04-01:2025-07-01 |
Earnings Events
The /earnings-events endpoint retrieves corporate earnings announcements using the following parameters:
Parameter | Value |
|---|---|
skip | 0 |
start_date | 2025-11-02 |
end_date | 2025-11-09 |
A reusable get_marketflow() function manages authenticated HTTP requests, applies a 60-second timeout, checks the HTTP response status, and returns the retrieved information in JSON format.
The raw responses are saved separately as trade_raw.json and earnings_raw.json. This allows the original API data to be inspected independently of the subsequent normalization process.
2.3. Data Cleaning and Shareholding Change Calculation
The third stage transforms the retrieved JSON responses into structured Pandas DataFrames.
The transaction dataset uses the t field as the ticker identifier, company as the company name, and trade_date as the transaction date. The earnings dataset uses ticker as its security identifier and date as the earnings announcement date.
Ticker symbols are standardized by converting them into uppercase strings and removing unnecessary whitespace. This process helps maintain consistency when matching securities across the two datasets.
Changes in shareholdings are calculated using:
\[ Shares\ Change=Shares\ After-Shares\ Before \]
The percentage change in shareholdings is calculated as:
\[ Position\ Change(\%)= \frac{Shares\ Change}{Shares\ Before}\times100 \]
The percentage calculation is only applied when the initial shareholding is greater than zero.
The system then classifies the reported positions into four categories:
Condition | Classification |
|---|---|
Shares before = 0 and shares after greater than 0 | NEW POSITION |
Shares change greater than 0 | INCREASED POSITION |
Shares change less than 0 | REDUCED POSITION |
No qualifying change | UNCHANGED |
These classifications provide a structured representation of changes in the reported share positions.
2.4. Stock Holding and Portfolio Analysis
The fourth stage evaluates reported transaction values and changes in shareholdings.
The system converts the value and price fields into numeric data types to support quantitative calculations. The transaction records are subsequently sorted according to reported position value in descending order.
The ten highest-valued positions are extracted to produce a ranked stock list.
Total reported position value is calculated using:
\[ Total\ Position\ Value=\sum_{i=1}^{n}Value_i \]
The framework also evaluates portfolio weight when a valid portfolio_value field is available:
\[ Portfolio\ Weight(\%)= \frac{Position\ Value}{Portfolio\ Value}\times100 \]
This measurement provides a proportional representation of individual positions relative to the portfolio value supplied by the API.
The system also calculates the number of newly established positions and increased positions to summarize the reported changes in shareholdings.
2.5. Earnings Event Matching and EPS Surprise
The earnings analysis compares ticker symbols from the transaction dataset with those available in the earnings dataset.
The matching process uses set intersection:
\[ Matching\ Tickers= Trade\ Symbols\cap Earnings\ Symbols \]
When matching securities are identified, the corresponding earnings records are combined with transaction information through a Pandas merge operation.
The matched dataset includes ticker symbols, company names, announcement dates, actual EPS, estimated EPS, actual revenue, estimated revenue, and reported position classifications.
EPS surprise is calculated using:
\[ EPS\ Surprise=EPS\ Actual-EPS\ Estimate \]
A positive result indicates that actual EPS exceeded the estimate, while a negative result indicates that actual EPS was below the estimate.
This calculation provides an additional perspective for examining corporate earnings information associated with securities appearing in the transaction dataset.
2.6. Financial Visualization and Reporting
The fifth stage generates a four-panel financial dashboard using Matplotlib.
The visualizations consist of:
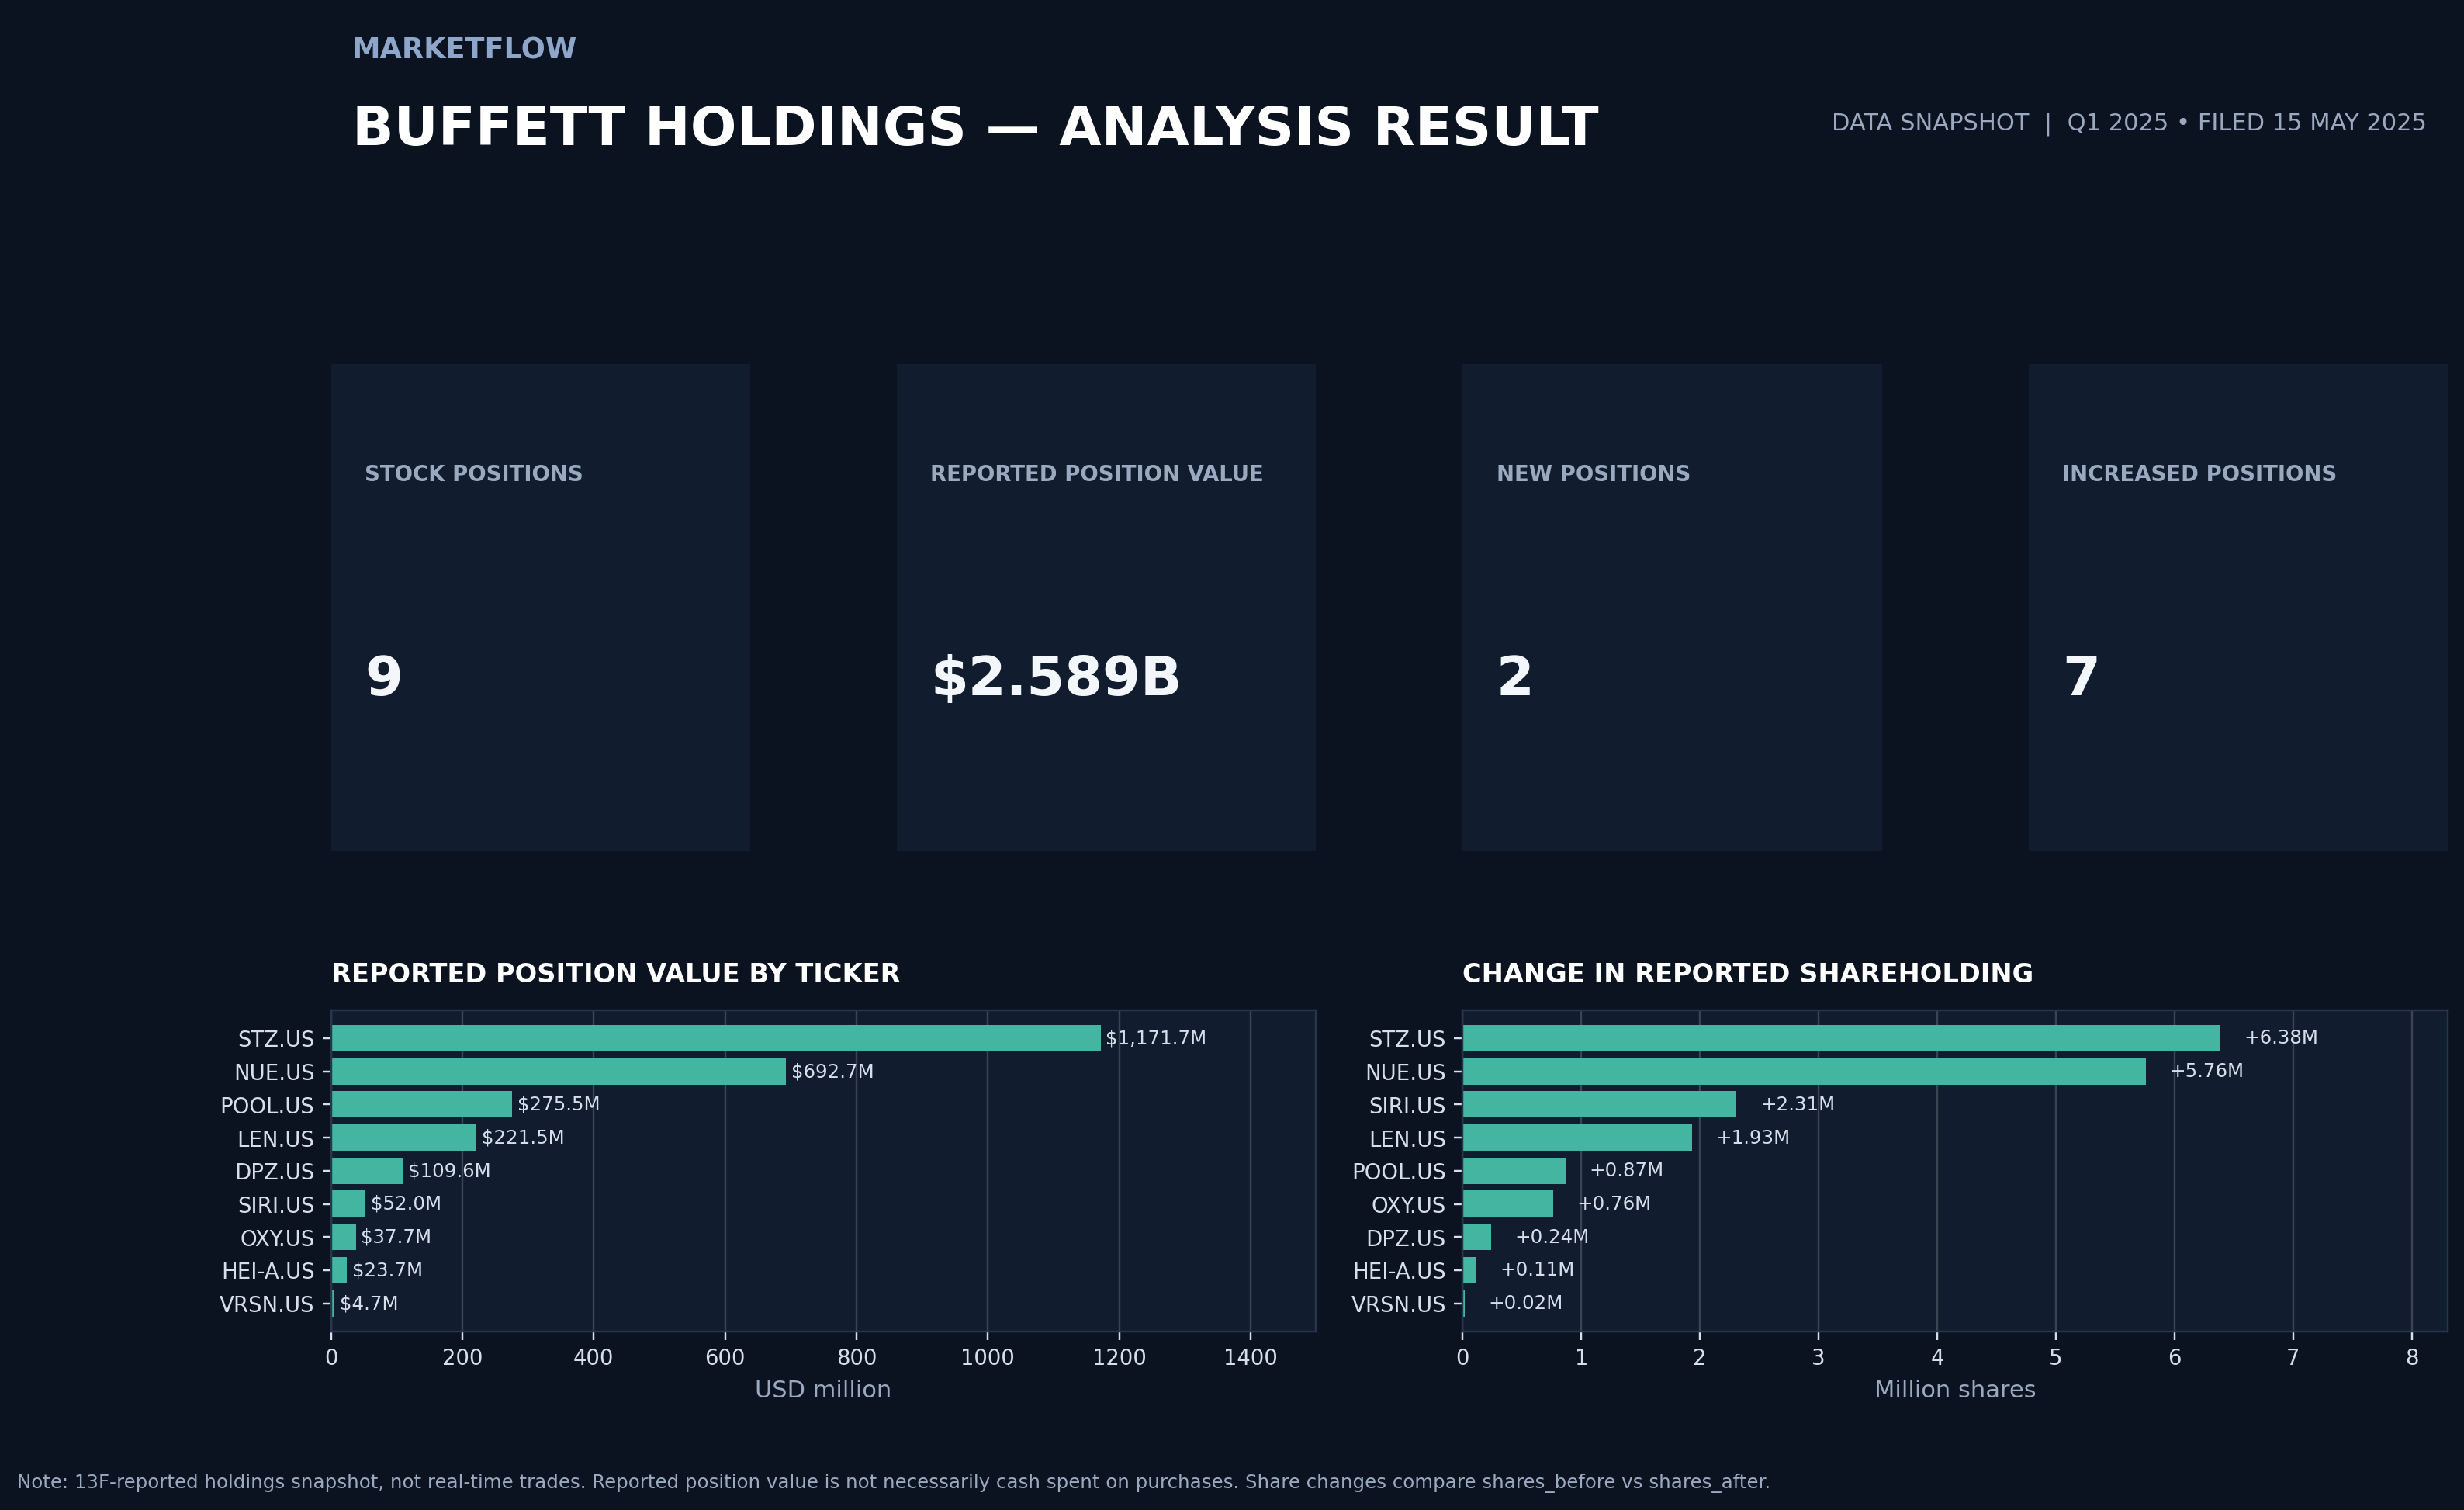
Top Buffett Positions: displays the ten highest reported stock positions by value.
Change in Share Holdings: illustrates positive, negative, and unchanged share movements.
Portfolio Weight: presents the relative weight of each reported position when the required data is available.
Earnings EPS Surprise: compares actual and estimated earnings per share.
The system also generates an executive summary containing six metrics: the number of reported stock positions, total reported position value, new positions, increased positions, earnings events, and matching ticker symbols.
2.7. Data Export and Output Management
The final stage exports the analytical results into the marketflow_results directory.
File | Description |
|---|---|
| Original API response containing trade activity. |
| Original API response containing earnings events. |
| Detailed stock holding and position analysis. |
| Ten highest reported stock positions. |
| Earnings information matched with transaction records. |
| Retrieved earnings event dataset. |
| Consolidated financial analysis metrics. |
| Four-panel financial visualization. |
These outputs provide a structured record of the analytical process and can be used for further investment research.
3. Implementation and Full Python Code
The implementation is developed using Python and the MarketFlow All-in-One Market Finance API. The complete program is organized into five computational cells and can be executed sequentially in Google Colab or Jupyter Notebook.
The code follows the uploaded marketflow_trading_analyzer.py structure. One integration adjustment is included in Cell 3: the original source references df_trade and df_earnings without first constructing them from the API responses. The revised implementation adds this missing extraction step so that the subsequent analytical cells have defined input datasets. Portfolio weight is also calculated conditionally because the source API response must contain a valid portfolio_value field.
Cell 1 — Library Installation and API Configuration
The first cell installs the required Python libraries and initializes the API authentication process.
The system configures two reporting periods, one for transaction activity and another for earnings announcements. It also creates the output directory used to store the retrieved and processed datasets.
The RapidAPI key is entered interactively using getpass, preventing the credential from being displayed directly in the notebook.
Code — Cell 1
# CELL 1: LIBRARY & CONFIGURATION

!pip -q install requests pandas numpy matplotlib seaborn

import os
import json
import requests
import numpy as np
import pandas as pd
import matplotlib.pyplot as plt
import seaborn as sns

from getpass import getpass
from IPython.display import display

# API Configuration
API_KEY = getpass("Masukkan RapidAPI Key: ")

BASE_URL = "https://marketflow-all-in-one-market-finance-api.p.rapidapi.com"

HEADERS = {
    "x-rapidapi-key": API_KEY,
    "x-rapidapi-host": "marketflow-all-in-one-market-finance-api.p.rapidapi.com"
}

# Periode analisis
TRADE_START = "2025-04-01"
TRADE_END = "2025-07-01"

EARNINGS_START = "2025-11-02"
EARNINGS_END = "2025-11-09"

OUTPUT_DIR = "marketflow_results"
os.makedirs(OUTPUT_DIR, exist_ok=True)

print("Marketflow Trading Analyzer siap digunakan.")
Cell 2 — MarketFlow API Data Collection
The second cell establishes communication with the MarketFlow API through the reusable get_marketflow() function.
The function sends authenticated GET requests, applies a 60-second timeout, and verifies the response status.
Two datasets are retrieved independently. The first contains Warren Buffett BUY transaction records, while the second contains corporate earnings announcements.
The original JSON responses are stored in the output directory to preserve the retrieved data for further examination.
Code — Cell 2
# CELL 2: API DATA COLLECTION

def get_marketflow(endpoint, params):
    url = f"{BASE_URL}/{endpoint}"

    response = requests.get(
        url,
        headers=HEADERS,
        params=params,
        timeout=60
    )

    response.raise_for_status()
    return response.json()


# 1. Trade Activity - Warren Buffett
trade_params = {
    "skip": 0,
    "trade_type": "buy",
    "limit": 100,
    "slug": "warren-buffett",
    "time_range": f"{TRADE_START}:{TRADE_END}"
}

# 2. Earnings Events
earnings_params = {
    "skip": 0,
    "start_date": EARNINGS_START,
    "end_date": EARNINGS_END
}

try:
    trade_raw = get_marketflow("trade-activity", trade_params)
    earnings_raw = get_marketflow("earnings-events", earnings_params)

    print("Trade Activity berhasil diambil.")
    print("Earnings Events berhasil diambil.")

except requests.exceptions.RequestException as e:
    raise RuntimeError(f"API Request Error: {e}")

# Simpan respons mentah
with open(f"{OUTPUT_DIR}/trade_raw.json", "w") as f:
    json.dump(trade_raw, f, indent=4)

with open(f"{OUTPUT_DIR}/earnings_raw.json", "w") as f:
    json.dump(earnings_raw, f, indent=4)

print("\nStruktur Trade Activity:")
print(json.dumps(trade_raw, indent=2)[:2000])

print("\nStruktur Earnings Events:")
print(json.dumps(earnings_raw, indent=2)[:2000])
Cell 3 — Data Cleaning and Position Classification
The third cell converts the API responses into structured DataFrames.
A recursive extraction function is used to identify transaction and earnings records within nested JSON structures. The resulting records are normalized using Pandas before the ticker symbols are standardized.
The system then calculates changes in shareholdings by comparing shares_before and shares_after.
The percentage change is calculated only when the initial shareholding is greater than zero. Finally, each reported position is assigned a classification according to its shareholding movement.
Code — Cell 3
# IDENTIFIKASI KOLOM YANG BENAR

# Trade Activity
trade_symbol_col = "t"
trade_company_col = "company"
trade_date_col = "trade_date"

# Earnings Events
earnings_symbol_col = "ticker"
earnings_date_col = "date"

# Pastikan kolom tersedia
assert trade_symbol_col in df_trade.columns
assert earnings_symbol_col in df_earnings.columns

# Normalisasi ticker
df_trade["ticker_clean"] = (
    df_trade[trade_symbol_col].astype(str).str.upper().str.strip()
)

df_earnings["ticker_clean"] = (
    df_earnings[earnings_symbol_col].astype(str).str.upper().str.strip()
)

# Hitung perubahan kepemilikan
df_trade["shares_change"] = (
    pd.to_numeric(df_trade["shares_after"], errors="coerce")
    - pd.to_numeric(df_trade["shares_before"], errors="coerce")
)

df_trade["position_change_pct"] = np.where(
    pd.to_numeric(df_trade["shares_before"], errors="coerce") > 0,
    df_trade["shares_change"] /
    pd.to_numeric(df_trade["shares_before"], errors="coerce") * 100,
    np.nan
)

# Klasifikasi perubahan posisi
df_trade["position_status"] = np.select(
    [
        df_trade["shares_before"].eq(0) &
        df_trade["shares_after"].gt(0),

        df_trade["shares_change"].gt(0),

        df_trade["shares_change"].lt(0)
    ],
    [
        "NEW POSITION",
        "INCREASED POSITION",
        "REDUCED POSITION"
    ],
    default="UNCHANGED"
)

print("Identifikasi kolom berhasil.")
display(df_trade[
    ["ticker_clean", "company", "shares_before",
     "shares_after", "shares_change", "position_status"]
])
Cell 4 — Advanced Trading and Earnings Analysis
The fourth cell performs the primary investment analysis.
The system evaluates reported shareholdings, transaction values, stock rankings, and portfolio metrics. It also compares ticker symbols between transaction and earnings datasets.
When matching securities are identified, the system combines the corresponding transaction information with earnings data, including actual EPS, estimated EPS, actual revenue, and estimated revenue.
Three analytical outputs are exported as CSV files: the advanced stock analysis, top stock ranking, and matched earnings dataset.
Code — Cell 4
# CELL 4: ADVANCED TRADING ANALYSIS

print("=" * 65)
print("MARKETFLOW - WARREN BUFFETT ANALYSIS")
print("=" * 65)

# 1. Analisis perubahan kepemilikan
trade_analysis = df_trade.copy()

trade_analysis["value"] = pd.to_numeric(
    trade_analysis["value"], errors="coerce"
)

trade_analysis["price"] = pd.to_numeric(
    trade_analysis["price"], errors="coerce"
)

# Ranking berdasarkan nilai posisi yang dilaporkan
trade_analysis = trade_analysis.sort_values(
    "value", ascending=False
)

print("\nA. STOCK HOLDING ANALYSIS")

display(trade_analysis[[
    "ticker_clean",
    "company",
    "shares_before",
    "shares_after",
    "shares_change",
    "position_change_pct",
    "price",
    "value",
    "position_status"
]])

# 2. Ranking saham
top_stocks = trade_analysis[[
    "ticker_clean", "company", "value", "shares_change",
    "position_status"
]].copy()

top_stocks = top_stocks.sort_values(
    "value", ascending=False
).head(10)

print("\nB. TOP STOCKS BY REPORTED POSITION VALUE")
display(top_stocks)

# 3. Analisis portofolio
total_value = trade_analysis["value"].sum()

trade_analysis["portfolio_weight_pct"] = (
    trade_analysis["value"] /
    trade_analysis["portfolio_value"] * 100
)

print("\nC. PORTFOLIO SUMMARY")
print("Jumlah saham:", len(trade_analysis))
print("Total reported position value: $",
      f"{total_value:,.2f}")

print("Jumlah NEW POSITION:",
      (trade_analysis["position_status"] == "NEW POSITION").sum())

print("Jumlah INCREASED POSITION:",
      (trade_analysis["position_status"] == "INCREASED POSITION").sum())

# 4. Matching ticker dengan earnings
trade_symbols = set(df_trade["ticker_clean"].dropna())
earnings_symbols = set(df_earnings["ticker_clean"].dropna())

overlap = trade_symbols.intersection(earnings_symbols)

print("\nD. EARNINGS MATCHING")
print("Matching stocks:", len(overlap))

if overlap:
    matched = df_earnings[
        df_earnings["ticker_clean"].isin(overlap)
    ].copy()

    matched = matched.merge(
        df_trade[[
            "ticker_clean", "company", "shares_change",
            "position_status", "value"
        ]],
        on="ticker_clean",
        how="left"
    )

    display(matched[[
        "ticker_clean", "name", "date",
        "eps_actual", "eps_estimate",
        "revenue_actual", "revenue_estimate",
        "position_status"
    ]])
else:
    matched = pd.DataFrame()
    print("Belum ada ticker yang sama pada kedua dataset.")

# Export
trade_analysis.to_csv(
    f"{OUTPUT_DIR}/buffett_advanced_analysis.csv",
    index=False
)

top_stocks.to_csv(
    f"{OUTPUT_DIR}/top_buffett_stocks.csv",
    index=False
)

matched.to_csv(
    f"{OUTPUT_DIR}/matched_earnings.csv",
    index=False
)
Cell 5 — Financial Visualization, Summary, and Export
The fifth cell generates the final MarketFlow Trading Analyzer dashboard.
The dashboard consists of four visualizations: reported stock position values, changes in shareholdings, portfolio weights, and earnings EPS surprises.
The system also calculates six summary metrics to provide a consolidated overview of the retrieved datasets.
Finally, the visualizations and analytical datasets are saved into the output directory. The CSV files can subsequently be used for further research or integrated into other financial analysis applications.
Code — Cell 5
# CELL 5: FINAL VISUALIZATION & EXPORT

fig, axes = plt.subplots(2, 2, figsize=(16, 11))

# Grafik 1: Reported position value
axes[0, 0].barh(
    top_stocks["ticker_clean"],
    top_stocks["value"] / 1e6
)
axes[0, 0].invert_yaxis()
axes[0, 0].set_title("Top Buffett Positions")
axes[0, 0].set_xlabel("Reported Value (USD Million)")

# Grafik 2: Perubahan kepemilikan
colors = [
    "green" if x > 0 else "red" if x < 0 else "gray"
    for x in trade_analysis["shares_change"]
]

axes[0, 1].bar(
    trade_analysis["ticker_clean"],
    trade_analysis["shares_change"],
    color=colors
)
axes[0, 1].set_title("Change in Share Holdings")
axes[0, 1].tick_params(axis="x", rotation=45)

# Grafik 3: Portfolio weight
axes[1, 0].barh(
    trade_analysis["ticker_clean"],
    trade_analysis["portfolio_weight_pct"]
)
axes[1, 0].invert_yaxis()
axes[1, 0].set_title("Portfolio Weight (%)")

# Grafik 4: Earnings EPS surprise
if not df_earnings.empty:
    eps_data = df_earnings.copy()

    eps_data["eps_actual"] = pd.to_numeric(
        eps_data["eps_actual"], errors="coerce"
    )
    eps_data["eps_estimate"] = pd.to_numeric(
        eps_data["eps_estimate"], errors="coerce"
    )

    eps_data["eps_surprise"] = (
        eps_data["eps_actual"] - eps_data["eps_estimate"]
    )

    eps_data = eps_data.dropna(subset=["eps_surprise"]).head(15)

    axes[1, 1].bar(
        eps_data["ticker"],
        eps_data["eps_surprise"]
    )

    axes[1, 1].axhline(0, linewidth=1)
    axes[1, 1].set_title("Earnings EPS Surprise")
    axes[1, 1].tick_params(axis="x", rotation=45)

plt.tight_layout()

plt.savefig(
    f"{OUTPUT_DIR}/marketflow_analysis.png",
    dpi=300,
    bbox_inches="tight"
)

plt.show()

# Export earnings
df_earnings.to_csv(
    f"{OUTPUT_DIR}/earnings_events.csv",
    index=False
)

summary = pd.DataFrame({
    "Metric": [
        "Buffett Stock Positions",
        "Total Position Value (USD)",
        "New Positions",
        "Increased Positions",
        "Earnings Events",
        "Matching Tickers"
    ],
    "Value": [
        len(trade_analysis),
        total_value,
        (trade_analysis["position_status"] == "NEW POSITION").sum(),
        (trade_analysis["position_status"] == "INCREASED POSITION").sum(),
        len(df_earnings),
        len(overlap)
    ]
})

summary.to_csv(
    f"{OUTPUT_DIR}/analysis_summary.csv",
    index=False
)

print("\nFINAL MARKETFLOW ANALYSIS")
display(summary)

print("\nOUTPUT FILES")
for file in sorted(os.listdir(OUTPUT_DIR)):
    print("-", file)

print("\nPROJECT COMPLETED")
Result:
4. Results and Discussion
4.1. Financial Data Retrieval and Integration
The data collection module retrieves two financial datasets through the MarketFlow API: reported BUY transactions associated with Warren Buffett and corporate earnings announcements.
The transaction dataset provides information about reported stock positions, including ticker symbols, company names, share quantities, transaction prices, and reported position values.
Meanwhile, the earnings dataset provides information about corporate financial announcements, including ticker symbols, announcement dates, actual EPS, estimated EPS, and revenue information when available.
Both datasets are maintained separately before being compared through standardized ticker symbols.
This integration establishes the foundation for examining reported investment positions alongside corporate financial information.
4.2. Stock Position Classification
The shareholding analysis identifies changes in reported positions by comparing the number of shares before and after each transaction.
The system generates four position classifications: NEW POSITION, INCREASED POSITION, REDUCED POSITION, and UNCHANGED.
NEW POSITION identifies records where the initial shareholding is zero and the subsequent shareholding is positive.
INCREASED POSITION identifies records where the reported number of shares increases, while REDUCED POSITION identifies records with negative share changes.
UNCHANGED represents records that do not satisfy the three preceding conditions.
The classification provides a structured overview of reported shareholding movements and allows analysts to distinguish newly established positions from changes in existing positions.
4.3. Stock Ranking Based on Reported Position Value
The stock ranking module evaluates the reported position value associated with each retrieved transaction record.
The system sorts the transaction dataset in descending order and identifies the ten highest-valued positions.
This ranking provides a comparative view of the reported financial magnitude of the retrieved stock positions.
The analysis also calculates the total reported position value by aggregating the available value field.
It is important to distinguish the reported position value from the total market value of an investor's complete portfolio. The result depends on the definition and coverage of the API-provided data.
4.4. Portfolio Weight Analysis
Portfolio weight analysis examines the relative contribution of individual reported positions to the corresponding portfolio value.
The calculation uses the reported position value divided by the portfolio value supplied by the API.
The resulting percentages provide a proportional measurement of individual positions.
However, the calculation depends on the availability of a valid portfolio_value field. If this information is not provided by the API, the portfolio weight visualization cannot produce meaningful values.
Consequently, the availability of the required portfolio information is an important consideration when interpreting the dashboard.
4.5. Shareholding Changes and Investment Activity
The shareholding change visualization presents the difference between the reported shares before and after each transaction.
Positive values represent increases in reported share quantities, while negative values represent reductions.
The visualization uses three color classifications to distinguish these movements: green for positive changes, red for negative changes, and gray for unchanged positions.
This presentation allows analysts to compare reported shareholding movements across different securities.
Nevertheless, the analysis is based on the retrieved BUY transaction dataset and should not be interpreted as a complete representation of all purchase and sale activities.
4.6. Earnings Event Matching
The earnings matching module identifies securities that appear in both the transaction dataset and the earnings dataset.
The matching process uses standardized ticker symbols to minimize inconsistencies caused by differences in capitalization or unnecessary whitespace.
When matching securities are identified, their transaction information is combined with the corresponding corporate earnings records.
The resulting dataset provides a consolidated view of reported investment positions and available earnings information.
However, the two datasets use different reporting periods. Therefore, a matching ticker does not necessarily indicate that the earnings announcement occurred immediately before or after the reported investment transaction.
The analysis should be interpreted as a comparison of securities appearing in two selected datasets rather than evidence of a direct relationship between investment decisions and earnings announcements.
4.7. Earnings EPS Surprise Analysis
The EPS surprise visualization compares actual earnings per share with estimated earnings per share.
The calculation uses the difference between actual and estimated EPS.
Positive values represent earnings results above estimates, while negative values indicate results below estimates.
The zero reference line provides a visual distinction between positive and negative earnings surprises.
This analysis can help identify differences between reported corporate earnings and market expectations.
However, an EPS surprise alone does not determine the direction of subsequent stock price movements because market reactions can also depend on revenue performance, forward guidance, valuation, and broader market conditions.
4.8. Financial Dashboard and Executive Summary
The final dashboard combines four analytical perspectives into a single visualization.
The first chart presents the ten largest reported stock positions. The second illustrates changes in shareholdings, while the third displays portfolio weights when the required data is available.
The fourth chart examines earnings EPS surprises across the retrieved earnings dataset.
The executive summary consolidates six important measurements:
Number of reported stock positions.
Total reported position value.
Number of new positions.
Number of increased positions.
Number of earnings events.
Number of matching tickers.
This summary provides a concise overview of the analytical results without requiring users to examine every transaction record individually.
4.9. Data Export and Reporting
The system exports the processed datasets into the marketflow_results directory.
The generated CSV files include detailed transaction analysis, the top ten stock positions, matched earnings information, earnings events, and executive summary statistics.
The dashboard is also saved as a high-resolution PNG image with a resolution of 300 DPI.
These outputs allow analysts to preserve the analytical results, conduct additional statistical examinations, and incorporate the findings into financial research reports.
4.10. Limitations and Future Improvements
Several limitations should be considered when interpreting the analytical results.
First, the transaction retrieval is limited to BUY records. The current API request specifies trade_type=buy, so the resulting dataset does not represent a complete history of both purchase and sale transactions.
Second, the transaction retrieval is limited to 100 records. The current implementation uses limit=100 and skip=0, without automatic pagination.
Third, portfolio weight calculations depend on the availability of portfolio_value. If the API does not provide this field, portfolio weight cannot be calculated reliably.
Fourth, the transaction and earnings datasets use different reporting periods. The comparison therefore identifies overlapping securities but does not establish a direct temporal relationship between investment transactions and earnings announcements.
Fifth, the framework does not reconstruct a complete investment portfolio. The retrieved transaction records should not automatically be interpreted as a complete representation of all securities held by the investor.
Sixth, the system does not calculate investment performance. It does not evaluate historical returns, unrealized gains, realized profits, or risk-adjusted portfolio performance.
Future improvements could include:
Automatic pagination for retrieving additional transaction records.
Integration of BUY and SELL transaction datasets.
Historical portfolio reconstruction.
Stock price performance analysis following reported transactions.
Sector allocation and portfolio concentration analysis.
Historical earnings surprise evaluation.
Benchmark comparisons against major market indices.
Interactive financial dashboards.
Automated monitoring of institutional investment disclosures.
These developments could improve the analytical depth and transform the current implementation into a more comprehensive institutional investment intelligence platform.
5. Conclusion
MarketFlow Trading Analyzer demonstrates how Python and the MarketFlow All-in-One Market Finance API can be integrated into an automated financial analysis framework for examining reported stock positions and corporate earnings information.
The system retrieves reported BUY transactions associated with Warren Buffett and corporate earnings announcements through separate API endpoints.
The retrieved datasets are processed using Pandas and NumPy to calculate changes in shareholdings, classify investment positions, rank reported stock values, and evaluate portfolio metrics.
The framework also integrates ticker matching to identify securities appearing in both the transaction and earnings datasets. This process enables the examination of reported investment positions alongside actual and estimated corporate earnings information.
The final analytical output includes four financial visualizations covering reported stock positions, changes in shareholdings, portfolio weights, and earnings EPS surprises. In addition, the system generates an executive summary and exports the processed datasets into CSV files.
Overall, MarketFlow Trading Analyzer provides a practical foundation for automated investment disclosure analysis and financial event monitoring.
Nevertheless, the analytical results should be interpreted according to the coverage and definitions of the retrieved API data. The current framework does not represent a complete portfolio reconstruction or a validated investment prediction model.
Further development involving additional transaction records, historical stock prices, portfolio reconstruction, and performance evaluation could expand its capabilities.
By integrating these improvements, MarketFlow Trading Analyzer can serve as a foundation for a broader financial intelligence system focused on institutional investment behavior and corporate financial developments.