
Understanding the investment decisions of successful investors is an important part of financial market research. Institutional investors and prominent fund managers often attract significant attention because their reported transactions can provide insights into investment preferences, asset allocation, and changes in portfolio exposure.
One of the most closely followed investors is Warren Buffett. His investment philosophy emphasizes long-term value creation, business fundamentals, and disciplined capital allocation. Consequently, publicly reported investment transactions associated with Buffett are frequently examined by investors seeking to understand institutional investment behavior.
However, analyzing investor transactions manually can be challenging. Financial disclosures may contain multiple transactions, different securities, varying transaction values, and reporting dates. Identifying the most active assets, evaluating transaction distributions, and monitoring changes in reported share positions require systematic data processing.
Python provides an effective environment for automating these analytical activities. Through financial APIs and data analysis libraries, Python can retrieve investor information, normalize transaction records, calculate asset rankings, examine reported transaction values, and generate visual summaries.
This article presents MarketFlow Trader Analyzer, a Python-based investment intelligence framework developed using the MarketFlow All-in-One Market Finance API through RapidAPI.
The system focuses on the investor identifier warren-buffett and examines reported trade activity during the period April 1, 2025, to July 1, 2025.
The analytical framework retrieves two primary datasets: available investor information through the /list-investors endpoint and investor transaction records through the /trade-activity endpoint.
The retrieved information is processed using Pandas and NumPy to produce structured transaction datasets. The analysis includes BUY and SELL transaction distribution, the most frequently reported assets, transaction value statistics, changes in reported share positions, monthly investor activity, and asset accumulation or distribution.
The system also identifies the ten most active assets and the ten largest reported transactions, providing a more focused view of the retrieved investment activity.
To support interpretation, MarketFlow Trader Analyzer generates an executive summary and several visualizations, including an asset activity ranking, transaction value comparison, and monthly investor activity chart.
Finally, the system exports the processed results into an Excel workbook containing separate worksheets for the executive summary, investor information, trade activity, and asset ranking. A CSV file containing the normalized trade activity is also generated.
The primary objective of this implementation is to demonstrate how Python and financial APIs can be integrated into an automated smart money monitoring and investment intelligence system. By combining investor transaction retrieval, data normalization, asset ranking, and financial visualization, MarketFlow Trader Analyzer provides a structured approach to examining publicly reported investor activity.
2. Methodology
The MarketFlow Trader Analyzer framework consists of five computational cells. Each cell performs a specific function within the overall analytical workflow.
Cell | Main function |
|---|---|
Cell 1 | Library imports, RapidAPI authentication, investor selection, and reporting period configuration. |
Cell 2 | Investor information and reported transaction retrieval through MarketFlow API. |
Cell 3 | JSON extraction, data cleaning, date conversion, numeric normalization, and asset identification. |
Cell 4 | Smart money analysis, transaction distribution, asset ranking, transaction values, and share position changes. |
Cell 5 | Executive summary, visualizations, Excel workbook generation, and CSV export. |
2.1. API Configuration and Investor Selection
The system uses the MarketFlow All-in-One Market Finance API through RapidAPI as its primary data provider.
Authentication is performed using a RapidAPI key entered interactively through Python's getpass module. This prevents the API credential from being directly displayed in the notebook.
The investor is configured using the following identifier:
warren-buffett
The reporting period is defined as:
Start date: April 1, 2025.
End date: July 1, 2025.
The transaction retrieval parameters include a maximum of 100 records, an initial offset of zero, and an optional transaction type filter.
The TRADE_TYPE parameter is set to None, meaning that no specific transaction type is requested.
2.2. Investor and Transaction Data Retrieval
The second stage retrieves two datasets through the MarketFlow API.
Investor information
The /list-investors endpoint retrieves the available investor records.
Investor transaction activity
The /trade-activity endpoint retrieves reported transaction information using the selected investor slug and reporting period.
The request includes the following parameters:
Parameter | Value |
|---|---|
skip | 0 |
limit | 100 |
slug | warren-buffett |
time_range | 2025-04-01:2025-07-01 |
trade_type | None |
A reusable get_api() function manages authenticated HTTP requests, applies a 30-second timeout, and verifies the response status.
If the API returns an unsuccessful HTTP response, the system displays the error details. For HTTP 403 responses, it also provides possible troubleshooting steps related to API authentication, subscription access, plan permissions, and quota limitations.
2.3. Data Cleaning and Normalization
The third stage transforms the raw JSON responses into structured Pandas DataFrames.
The extract_records() function recursively examines nested dictionaries and lists to identify collections of transaction records.
When multiple record collections are found, the function selects the collection containing the greatest number of dictionary records.
The extracted records are converted using pd.json_normalize(), allowing nested JSON structures to be represented in tabular form.
The clean_columns() function standardizes column names by converting them to lowercase and replacing spaces with underscores.
Date fields such as trade_date and filing_date are converted into UTC-aware datetime values.
Numerical fields are converted using pd.to_numeric() to support quantitative analysis.
The system also identifies ticker information and creates an asset column based on the available company name or ticker.
Finally, empty records are removed and the transaction dataset is prepared for further analysis.
2.4. Smart Money and Transaction Analysis
The fourth stage examines the retrieved transaction records through several analytical dimensions.
BUY and SELL distribution
The system identifies the available transaction type column and calculates the frequency of each reported transaction category.
Asset activity ranking
Transaction records are grouped by ticker symbol to identify the most frequently reported assets.
The ranking is sorted according to transaction count in descending order.
Reported transaction value
The system converts the transaction value field into numeric data and calculates descriptive statistics.
These statistics include count, mean, standard deviation, minimum, quartiles, and maximum values.
The ten largest reported transactions are also extracted using nlargest().
Share position changes
The change_in_shares field is analyzed to examine reported increases and decreases in share positions.
Positive values can represent reported increases, while negative values can represent reported decreases, subject to the meaning of the API's underlying transaction data.
Monthly investor activity
Transaction activity is grouped by month using the filing date when available, or the trade date as an alternative.
This produces a monthly transaction count that helps illustrate the distribution of reported activity over the selected reporting period.
Asset accumulation and distribution
The system aggregates reported share changes by ticker symbol.
The resulting ranking highlights assets with the largest positive and negative net reported share changes.
2.5. Executive Summary and Investment Intelligence Dashboard
The fifth stage consolidates the analytical results into a structured dashboard.
The executive summary includes:
Investor identifier.
Analysis period.
Total transactions.
Number of unique assets.
Total reported transaction value.
The asset ranking provides the ten most frequently reported securities, together with their transaction counts and reported transaction values when available.
Three visualizations are generated using Matplotlib:
Top 10 Most Active Assets.
Top 10 Transactions by Reported Value.
Monthly Investor Activity.
These visualizations provide complementary perspectives on transaction concentration, reported transaction magnitude, and activity over time.
2.6. Excel and CSV Export
The final stage exports the processed analytical results.
The Excel workbook is named:
MarketFlow_Trader_Report.xlsx
It contains the following worksheets:
Worksheet | Contents |
|---|---|
Executive Summary | Main investor and transaction statistics. |
Investors | Retrieved investor information. |
Trade Activity | Normalized transaction records. |
Asset Ranking | Transaction frequency and reported value by asset. |
The system also generates:
MarketFlow_Trade_Activity.csv
Before exporting to Excel, timezone-aware datetime columns are converted into timezone-naive values to improve compatibility with spreadsheet applications.
The generated Excel workbook is subsequently offered for download through the Google Colab file interface.
3. Implementation and Full Python Code
The implementation below follows the uploaded marketflow_trader_analyzer.py source code. It is organized into five computational cells and can be executed sequentially in Google Colab.
The program uses the MarketFlow API to retrieve investor information and transaction records, process the datasets, calculate investment activity statistics, and generate an Excel report.
Cell 1 — Library Imports, API Configuration, and Investor Parameters
The first cell imports the required Python libraries and establishes the API authentication configuration.
The investor identifier, reporting period, transaction limit, and pagination offset are defined as configurable parameters.
The API key is entered through getpass so that it is not displayed directly in the notebook.
Code — Cell 1
# ==========================================
# CELL 1: CONFIGURATION
# ==========================================

import requests
import pandas as pd
import numpy as np
import matplotlib.pyplot as plt
import json
import warnings
import getpass

warnings.filterwarnings("ignore")

# Masukkan API Key secara tersembunyi
API_KEY = getpass.getpass("Masukkan RapidAPI Key: ").strip()

HOST = "marketflow-all-in-one-market-finance-api.p.rapidapi.com"
BASE_URL = f"https://{HOST}"

HEADERS = {
    "x-rapidapi-key": API_KEY,
    "x-rapidapi-host": HOST
}

# Investor Configuration
INVESTOR_SLUG = "warren-buffett"

# Trading Period
START_DATE = "2025-04-01"
END_DATE = "2025-07-01"

TRADE_TYPE = None
LIMIT = 100
SKIP = 0

print("MarketFlow Configuration Ready")
print("Investor:", INVESTOR_SLUG)
print("Period:", START_DATE, "-", END_DATE)
print("API Key:", "Terisi" if API_KEY else "Kosong")
Cell 2 — API Connection and Investor Transaction Retrieval
The second cell establishes communication with the MarketFlow API through the reusable get_api() function.
The function sends authenticated GET requests, applies a 30-second timeout, and verifies the HTTP response status.
Two API endpoints are accessed:
/list-investorsretrieves available investor information./trade-activityretrieves the reported transaction records associated with the selected investor.
The transaction request includes the investor identifier, reporting period, record limit, and pagination offset.
The implementation also provides additional troubleshooting information when the API returns HTTP 403.
Code — Cell 2
# ==========================================
# CELL 2: API CONNECTION & DEBUG
# ==========================================

def get_api(endpoint, params=None):

    url = BASE_URL + endpoint

    response = requests.get(
        url,
        headers=HEADERS,
        params=params,
        timeout=30
    )

    print(f"\nEndpoint: {endpoint}")
    print(f"HTTP Status: {response.status_code}")

    if response.status_code != 200:

        print("\nAPI ERROR RESPONSE:")
        print(response.text[:3000])

        if response.status_code == 403:
            print("\nPOSSIBLE SOLUTIONS:")
            print("1. Check RapidAPI Key")
            print("2. Check API Subscription")
            print("3. Check API Plan Access")
            print("4. Check API Quota")

        response.raise_for_status()

    return response.json()


# Validasi API Key
if not API_KEY or API_KEY == "MASUKKAN_RAPIDAPI_KEY_KAMU":
    raise ValueError("RapidAPI Key belum dimasukkan!")

if len(API_KEY.strip()) < 20:
    raise ValueError("RapidAPI Key terlihat tidak valid. Periksa kembali.")

# ==========================================
# 1. GET INVESTORS
# ==========================================

investors_raw = get_api("/list-investors")

print("\nINVESTOR DATA SUCCESS")

print(json.dumps(
    investors_raw,
    indent=2
)[:1500])


# ==========================================
# 2. GET TRADE ACTIVITY
# ==========================================

trade_params = {
    "skip": SKIP,
    "limit": LIMIT,
    "slug": INVESTOR_SLUG,
    "time_range": f"{START_DATE}:{END_DATE}"
}

if TRADE_TYPE:
    trade_params["trade_type"] = TRADE_TYPE

trades_raw = get_api(
    "/trade-activity",
    params=trade_params
)

print("\nTRADE ACTIVITY SUCCESS")

print(json.dumps(
    trades_raw,
    indent=2
)[:1500])
Cell 3 — Data Cleaning and Normalization
The third cell transforms the retrieved JSON responses into structured Pandas DataFrames.
The extract_records() function recursively searches nested dictionaries and lists to identify transaction records.
The clean_columns() function standardizes column names, while additional processing converts dates and numerical values into appropriate data types.
The system also identifies ticker symbols and company names to create a standardized asset field.
Finally, empty records are removed and the resulting datasets are displayed for inspection.
Code — Cell 3
# ==========================================
# CELL 3: DATA CLEANING & NORMALIZATION
# ==========================================

def extract_records(obj):
    """Mengambil kumpulan record dari JSON bersarang."""

    candidates = []

    def walk(data, path="root"):

        if isinstance(data, list):

            if data and all(isinstance(x, dict) for x in data):
                candidates.append((len(data), path, data))

            for i, item in enumerate(data):
                if isinstance(item, (dict, list)):
                    walk(item, f"{path}[{i}]")

        elif isinstance(data, dict):

            for key, value in data.items():
                if isinstance(value, (dict, list)):
                    walk(value, f"{path}.{key}")

    walk(obj)

    if candidates:
        candidates.sort(key=lambda x: x[0], reverse=True)

        _, path, records = candidates[0]

        print(f"Records ditemukan: {path}")

        return pd.json_normalize(records, sep="_")

    if isinstance(obj, dict) and obj:
        return pd.json_normalize(obj, sep="_")

    if isinstance(obj, list) and obj:
        return pd.DataFrame({"value": obj})

    return pd.DataFrame()


# Convert JSON to DataFrame
investors = extract_records(investors_raw)
trades = extract_records(trades_raw)


# Standardisasi nama kolom
def clean_columns(df):

    df = df.copy()

    df.columns = [
        str(col).strip().lower().replace(" ", "_")
        for col in df.columns
    ]

    return df


investors = clean_columns(investors)
trades = clean_columns(trades)


# Konversi kolom tanggal
for col in ["trade_date", "filing_date"]:

    if col in trades.columns:

        trades[col] = pd.to_datetime(
            trades[col],
            errors="coerce",
            utc=True
        )


# Konversi kolom numerik
numeric_columns = [
    "value",
    "price",
    "shares_before",
    "shares_after",
    "change_in_shares",
    "change_in_value"
]

for col in numeric_columns:

    if col in trades.columns:

        trades[col] = pd.to_numeric(
            trades[col],
            errors="coerce"
        )


# Identifikasi aset
if "t" in trades.columns:

    trades["ticker"] = trades["t"].astype(str)

elif "ticker" not in trades.columns:

    trades["ticker"] = "UNKNOWN"


if "company" in trades.columns:

    trades["asset"] = trades["company"].fillna(
        trades["ticker"]
    )

else:

    trades["asset"] = trades["ticker"]


# Hapus record kosong
trades = trades.dropna(
    how="all"
).reset_index(drop=True)


print("=" * 50)
print("DATA PROCESSING COMPLETED")
print("=" * 50)

print("Total Investors:", len(investors))
print("Total Trades:", len(trades))

print("\nInvestor Data:")
display(investors.head(10))

print("\nTrade Activity:")
display(trades.head(10))

print("\nAvailable Trade Columns:")
print(trades.columns.tolist())
Cell 4 — Smart Money and Trader Intelligence Analysis
The fourth cell performs the primary investment activity analysis.
The system dynamically identifies available transaction columns, allowing the analysis to adapt to different API response structures.
Six analytical components are implemented:
BUY and SELL distribution.
Most active stocks.
Reported transaction value.
Share position changes.
Monthly investor activity.
Asset accumulation and distribution.
The ten most active assets are ranked according to transaction frequency, while the ten largest reported transactions are identified using their reported transaction values.
The monthly activity analysis uses filing dates when available and falls back to trade dates when necessary.
Code — Cell 4
# ==========================================
# CELL 4: SMART MONEY ANALYSIS
# ==========================================

TOP_N = 10

def find_col(df, keywords):

    for col in df.columns:

        if any(key in col.lower() for key in keywords):
            return col

    return None


# Identifikasi kolom
ticker_col = find_col(
    trades,
    ["ticker", "symbol", "stock"]
)

asset_col = find_col(
    trades,
    ["asset", "company"]
)

date_col = find_col(
    trades,
    ["trade_date", "transaction_date", "date"]
)

filing_col = find_col(
    trades,
    ["filing_date"]
)

value_col = find_col(
    trades,
    ["value"]
)

side_col = find_col(
    trades,
    ["trade_type", "transaction_type", "side"]
)

change_col = find_col(
    trades,
    ["change_in_shares"]
)


print("=" * 60)
print("MARKETFLOW SMART MONEY INTELLIGENCE")
print("=" * 60)

print("Investor:", INVESTOR_SLUG)
print("Total Transactions:", len(trades))

# ------------------------------------------
# 1. BUY / SELL DISTRIBUTION
# ------------------------------------------

if side_col:

    print("\n1. BUY / SELL DISTRIBUTION")

    distribution = trades[side_col].value_counts()

    display(
        distribution.to_frame("Total Transactions")
    )

# ------------------------------------------
# 2. ASSET ACTIVITY RANKING
# ------------------------------------------

if ticker_col:

    print("\n2. MOST ACTIVE STOCKS")

    asset_ranking = (
        trades.groupby(ticker_col)
        .agg(
            transaction_count=(ticker_col, "size")
        )
        .sort_values(
            "transaction_count",
            ascending=False
        )
    )

    display(asset_ranking.head(TOP_N))


# ------------------------------------------
# 3. REPORTED TRANSACTION VALUE
# ------------------------------------------

if value_col:

    print("\n3. TRANSACTION VALUE ANALYSIS")

    trades["_analysis_value"] = pd.to_numeric(
        trades[value_col],
        errors="coerce"
    )

    display(
        trades["_analysis_value"].describe()
    )

    print(
        "Total reported transaction value:",
        trades["_analysis_value"].sum()
    )

    print("\nTOP 10 LARGEST TRANSACTIONS")

    top_transactions = trades.nlargest(
        TOP_N,
        "_analysis_value"
    )

    display(top_transactions)


# ------------------------------------------
# 4. SHARE POSITION CHANGE
# ------------------------------------------

if change_col:

    print("\n4. SHARE POSITION CHANGE")

    trades["_share_change"] = pd.to_numeric(
        trades[change_col],
        errors="coerce"
    )

    display(
        trades["_share_change"].describe()
    )


# ------------------------------------------
# 5. MONTHLY FILING ACTIVITY
# ------------------------------------------

monthly_col = filing_col or date_col

if monthly_col:

    print("\n5. MONTHLY INVESTOR ACTIVITY")

    monthly_activity = (
        trades.dropna(subset=[monthly_col])
        .set_index(monthly_col)
        .resample("MS")
        .size()
    )

    display(
        monthly_activity.to_frame(
            "Transaction Count"
        )
    )


# ------------------------------------------
# 6. ASSET ACCUMULATION / DISTRIBUTION
# ------------------------------------------

if ticker_col and change_col:

    print("\n6. SHARE CHANGE BY ASSET")

    accumulation = (
        trades.groupby(ticker_col)["_share_change"]
        .sum()
        .sort_values(ascending=False)
        .to_frame("Net Reported Share Change")
    )

    display(accumulation.head(15))


print("\nANALYSIS COMPLETED")
Cell 5 — Trader Dashboard, Visualization, and Export
The fifth cell consolidates the analytical results into the MarketFlow Trader Intelligence Dashboard.
The executive summary presents the investor identifier, analysis period, total transactions, unique assets, and total reported transaction value.
The dashboard then generates three visualizations:
Top 10 Most Active Assets.
Top 10 Transactions by Reported Value.
Monthly Investor Activity.
Before exporting, the system removes timezone information from datetime columns to improve Excel compatibility.
The final output consists of an Excel workbook with multiple analytical worksheets and a CSV file containing the normalized transaction data.
Code — Cell 5
# ==========================================
# CELL 5: FINAL TRADER DASHBOARD
# ==========================================

from IPython.display import display
from google.colab import files

print("=" * 65)
print("MARKETFLOW TRADER INTELLIGENCE DASHBOARD")
print("=" * 65)

print("Investor:", INVESTOR_SLUG)
print("Period:", START_DATE, "-", END_DATE)
print("Total Trades:", len(trades))


# ==========================================
# 1. EXECUTIVE SUMMARY
# ==========================================

unique_assets = (
    trades[ticker_col].nunique()
    if ticker_col else 0
)

total_value = (
    trades["_analysis_value"].sum()
    if "_analysis_value" in trades else 0
)

summary = pd.DataFrame({
    "Metric": [
        "Investor",
        "Analysis Period",
        "Total Transactions",
        "Unique Assets",
        "Total Reported Transaction Value"
    ],
    "Value": [
        INVESTOR_SLUG,
        f"{START_DATE} - {END_DATE}",
        len(trades),
        unique_assets,
        total_value
    ]
})

display(summary)


# ==========================================
# 2. ASSET RANKING
# ==========================================

if ticker_col:

    asset_summary = (
        trades.groupby(ticker_col)
        .agg(
            transaction_count=(ticker_col, "size")
        )
        .sort_values(
            "transaction_count",
            ascending=False
        )
    )

    if "_analysis_value" in trades:

        asset_summary["reported_value"] = (
            trades.groupby(ticker_col)["_analysis_value"].sum()
        )

    print("\nTOP ASSETS")

    display(
        asset_summary.head(10)
    )


# ==========================================
# 3. VISUALIZATION
# ==========================================

if ticker_col:

    plt.figure(figsize=(12, 6))

    asset_summary["transaction_count"].head(
        10
    ).sort_values().plot(kind="barh")

    plt.title("Top 10 Most Active Assets")
    plt.xlabel("Transaction Count")

    plt.tight_layout()
    plt.show()


if "_analysis_value" in trades:

    top_value = trades.nlargest(
        10,
        "_analysis_value"
    )

    plt.figure(figsize=(12, 6))

    plt.barh(
        top_value["ticker"].astype(str),
        top_value["_analysis_value"]
    )

    plt.title("Top 10 Transactions by Reported Value")
    plt.xlabel("Reported Value")

    plt.tight_layout()
    plt.show()


if monthly_col:

    monthly_activity = (
        trades.dropna(subset=[monthly_col])
        .set_index(monthly_col)
        .resample("MS")
        .size()
    )

    plt.figure(figsize=(12, 5))

    monthly_activity.plot(marker="o")

    plt.title("Monthly Investor Activity")
    plt.xlabel("Month")
    plt.ylabel("Transactions")

    plt.grid(alpha=0.3)
    plt.tight_layout()
    plt.show()


# ==========================================
# 4. FIX TIMEZONE FOR EXCEL
# ==========================================

trades_export = trades.copy()

for col in trades_export.columns:

    if isinstance(
        trades_export[col].dtype,
        pd.DatetimeTZDtype
    ):

        trades_export[col] = (
            trades_export[col]
            .dt.tz_localize(None)
        )


investors_export = investors.copy()

for col in investors_export.columns:

    if isinstance(
        investors_export[col].dtype,
        pd.DatetimeTZDtype
    ):

        investors_export[col] = (
            investors_export[col]
            .dt.tz_localize(None)
        )


# ==========================================
# 5. EXPORT EXCEL
# ==========================================

output_file = "MarketFlow_Trader_Report.xlsx"

with pd.ExcelWriter(
    output_file,
    engine="openpyxl"
) as writer:

    summary.to_excel(
        writer,
        sheet_name="Executive Summary",
        index=False
    )

    investors_export.to_excel(
        writer,
        sheet_name="Investors",
        index=False
    )

    trades_export.to_excel(
        writer,
        sheet_name="Trade Activity",
        index=False
    )

    if ticker_col:

        asset_summary.to_excel(
            writer,
            sheet_name="Asset Ranking"
        )


# CSV Export
trades_export.to_csv(
    "MarketFlow_Trade_Activity.csv",
    index=False
)


print("\n" + "=" * 65)
print("REPORT SUCCESSFULLY GENERATED")
print("=" * 65)

print("Excel:", output_file)
print("CSV: MarketFlow_Trade_Activity.csv")


# ==========================================
# 6. DOWNLOAD
# ==========================================

files.download(output_file)
Result:
4. Results and Discussion
4.1. Investor Information and Transaction Data Retrieval
The API integration module retrieves investor information and reported transaction records through two MarketFlow endpoints.
The /list-investors endpoint provides the available investor dataset, while /trade-activity retrieves transaction records associated with the selected investor identifier.
The analysis focuses on warren-buffett within the April 1, 2025, to July 1, 2025 reporting period.
The API response is initially displayed in JSON format to facilitate inspection of the available information and underlying data structure.
The successful retrieval of these datasets establishes the foundation for subsequent investment activity analysis.
4.2. Transaction Data Normalization
The data processing module transforms the retrieved JSON information into structured Pandas DataFrames.
The system standardizes column names, converts date fields into datetime objects, and transforms financial values and share position changes into numeric formats.
Ticker symbols and company names are also organized into standardized asset fields.
This normalization process enables the system to perform grouping, ranking, statistical calculations, and chronological analysis.
The resulting transaction dataset serves as the primary source for the smart money intelligence calculations.
4.3. BUY and SELL Transaction Distribution
The transaction distribution module examines the frequency of reported BUY and SELL activities.
The system identifies the available transaction type field and calculates the number of records associated with each category.
This analysis provides an overview of the reported transaction composition during the selected period.
The distribution can help identify whether the retrieved dataset contains more reported purchase transactions or disposal transactions.
However, the interpretation depends on the transaction classification supplied by the API.
4.4. Most Active Asset Identification
The asset activity ranking identifies securities with the highest number of reported transactions.
The system groups transaction records by ticker symbol and calculates the total transaction count for each asset.
The results are sorted in descending order to identify the ten most frequently reported securities.
This analysis provides insights into the distribution of investor transaction activity across different assets.
The ranking measures transaction frequency rather than total portfolio allocation or investment conviction.
4.5. Reported Transaction Value Analysis
The transaction value module evaluates the monetary magnitude of reported transactions.
The system calculates descriptive statistics, including the mean, standard deviation, minimum, maximum, and quartile values.
The total reported transaction value is also calculated by summing the available transaction value records.
Additionally, the ten largest transactions are identified using the nlargest() function.
This analysis helps distinguish assets with frequent reported transactions from transactions with relatively large reported monetary values.
The resulting information can be used to examine the distribution and concentration of reported investment activity.
4.6. Share Position Change Analysis
The share position analysis examines changes in reported share quantities using the change_in_shares field.
The system calculates descriptive statistics to evaluate the distribution of reported share changes.
Positive values indicate reported increases in share quantities, while negative values indicate reported decreases, assuming the API uses the conventional sign interpretation.
This analysis provides an additional perspective on changes in reported investor positions.
However, these values should not automatically be interpreted as complete portfolio holdings because the dataset represents the retrieved transaction records rather than a comprehensive real-time portfolio statement.
4.7. Monthly Investor Activity
The monthly activity module groups reported transactions according to filing dates or trade dates.
The system uses the filing date when available and falls back to the transaction date when necessary.
The resulting monthly transaction count provides an overview of how reported investment activity is distributed throughout the analysis period.
The visualization allows analysts to identify months with relatively high or low reporting activity.
This information can support further examination of transaction timing and investment disclosure patterns.
4.8. Asset Accumulation and Distribution
The accumulation and distribution analysis aggregates reported share changes by ticker symbol.
The system calculates the net reported share change for each asset by summing the available change_in_shares values.
Assets with larger positive values appear higher in the accumulation ranking, while negative values represent net reported decreases.
This approach provides a simple way to compare reported share position changes across securities.
Nevertheless, the result should be interpreted as net reported share changes within the retrieved records, not as a verified measure of total portfolio accumulation or distribution.
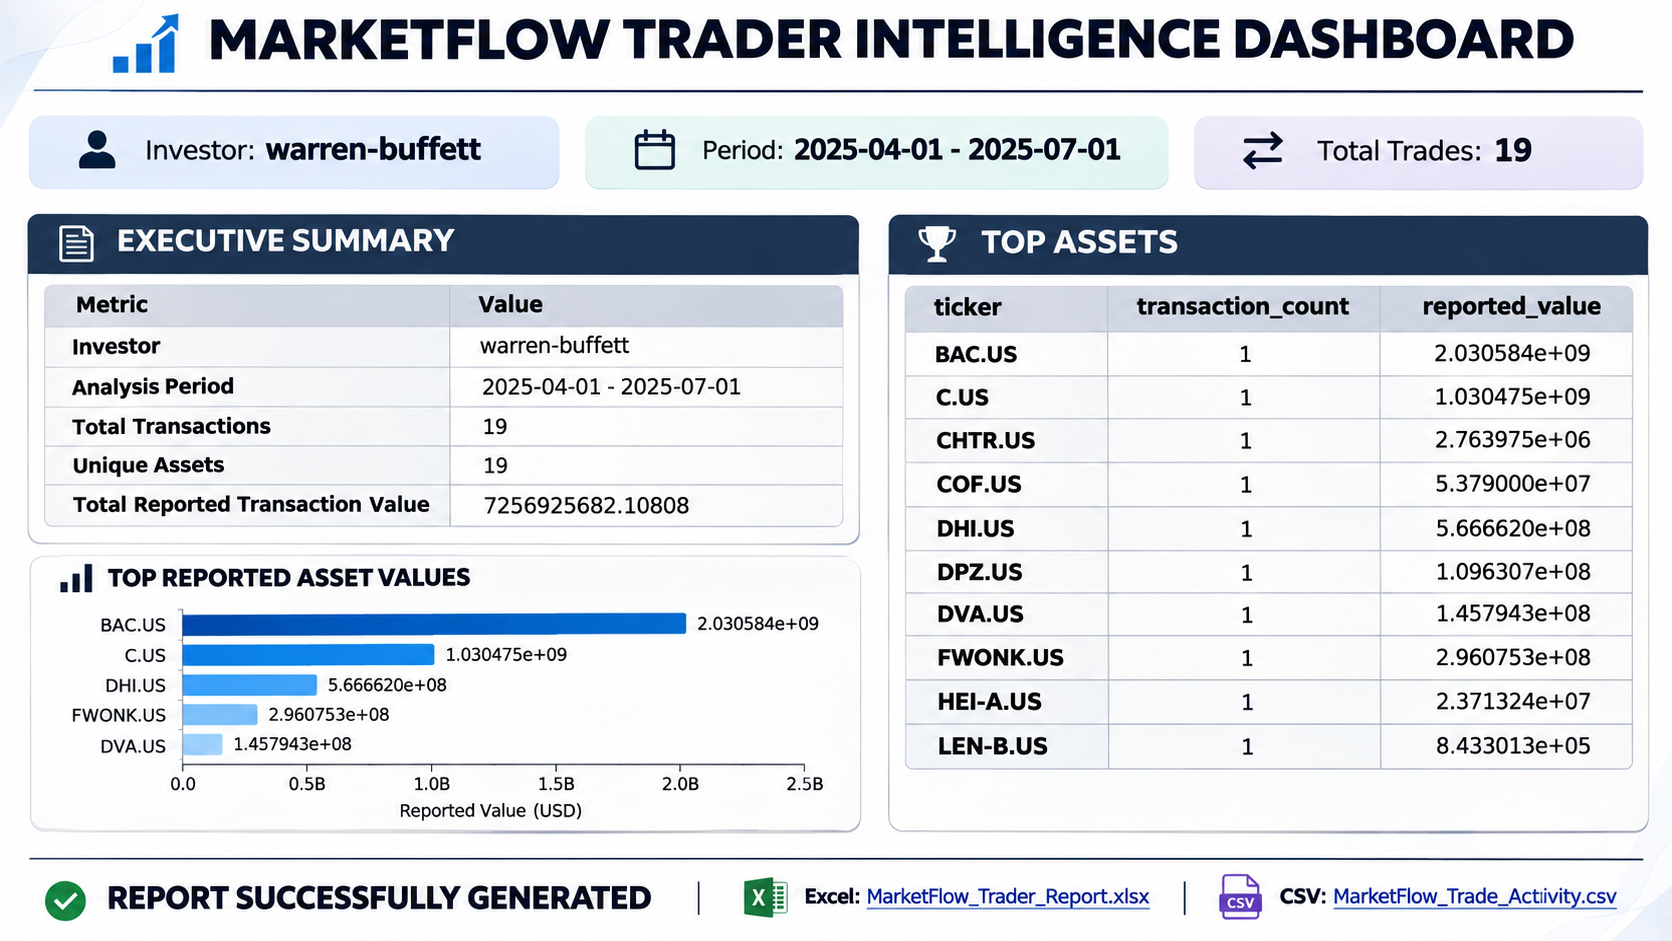
4.9. MarketFlow Trader Intelligence Dashboard
The final dashboard combines the analytical results into an executive summary and three financial visualizations.
The executive summary presents five primary metrics:
Investor identifier.
Analysis period.
Total transactions.
Unique assets.
Total reported transaction value.
The first visualization, Top 10 Most Active Assets, highlights securities with the greatest transaction frequency.
The second visualization, Top 10 Transactions by Reported Value, identifies the largest reported transaction records.
The third visualization, Monthly Investor Activity, illustrates the chronological distribution of reported transactions.
Together, these visualizations provide a consolidated overview of investor activity and transaction characteristics.
4.10. Excel and CSV Reporting
The export module generates two financial analysis files.
The Excel workbook contains four worksheets:
Worksheet | Analytical content |
|---|---|
Executive Summary | Investor information and transaction statistics. |
Investors | Available investor records. |
Trade Activity | Normalized transaction records. |
Asset Ranking | Asset transaction frequency and reported values. |
The CSV file contains the processed transaction dataset and can be used for additional statistical analysis or integration with other financial applications.
These export capabilities make the framework useful not only for exploratory analysis but also for maintaining structured investment research records.
4.11. Limitations and Future Improvements
Several limitations should be considered when interpreting the analytical results.
First, the analysis is limited to the retrieved API records. The current configuration requests a maximum of 100 transaction records with an initial pagination offset of zero. It does not automatically retrieve additional pages.
Second, the reporting period is historical. The April–July 2025 period provides a retrospective view rather than real-time investment activity.
Third, transaction values depend on the API's reporting definitions. The total reported transaction value should not automatically be interpreted as the investor's total portfolio value or current assets under management.
Fourth, the accumulation and distribution analysis uses reported share changes. It does not independently reconstruct the investor's complete portfolio holdings.
Fifth, the framework does not calculate investment returns. It does not evaluate portfolio performance, unrealized gains, realized profits, or risk-adjusted returns.
Sixth, the current implementation does not include historical stock price comparisons. Therefore, it cannot establish whether reported transactions were followed by positive or negative market performance.
Seventh, the analysis depends on the availability and structure of API fields. Some analytical sections are skipped when the corresponding transaction columns are unavailable.
Future improvements could include:
Automatic pagination for retrieving more than 100 records.
Historical portfolio reconstruction.
Stock price performance following reported transactions.
Benchmark comparisons against major market indices.
Investment sector classification.
Portfolio concentration analysis.
Transaction timing analysis.
Historical performance and risk evaluation.
Interactive dashboards using Plotly.
Automated investor activity monitoring.
These developments could transform the current framework into a more comprehensive institutional investment intelligence platform.
5. Conclusion
MarketFlow Trader Analyzer demonstrates how Python and the MarketFlow All-in-One Market Finance API can be integrated into an automated investment intelligence system for examining reported investor transactions.
The framework retrieves investor information and reported trade activity through the /list-investors and /trade-activity endpoints.
The retrieved datasets are processed using Pandas and NumPy to perform data normalization, transaction classification, asset ranking, reported transaction value analysis, share position change evaluation, and monthly activity monitoring.
The analytical framework also identifies the most active assets, evaluates the ten largest reported transactions, and examines net reported share changes across securities.
The final dashboard consolidates these findings through an executive summary and financial visualizations. The system additionally generates an Excel workbook and CSV file to support further investment research and reporting.
Overall, MarketFlow Trader Analyzer provides a practical foundation for automated smart money monitoring and financial transaction analysis.
Nevertheless, reported investor transactions should be interpreted as historical disclosure information rather than real-time trading instructions. Further development involving historical price analysis, portfolio reconstruction, performance evaluation, and automated pagination would improve the analytical depth and reliability of the framework.
By integrating these capabilities, MarketFlow Trader Analyzer can serve as a foundation for a broader financial market intelligence system focused on institutional investment behavior and data-driven investment research.