Financial markets are influenced not only by price movements and technical indicators but also by corporate events that can significantly affect investor expectations and trading activity. Among the most important corporate events are earnings announcements and stock splits. These events can influence market sentiment, trading volume, stock valuation, and short-term price volatility.
Earnings announcements provide information about a company's financial performance, including revenue, earnings per share (EPS), and overall business conditions. Investors frequently monitor earnings dates because financial disclosures can create substantial market reactions, particularly when reported results differ from analysts' expectations. Understanding the timing of these announcements is therefore important when evaluating potential trading risks and opportunities.
Stock splits represent another important corporate event. A stock split increases the number of outstanding shares while proportionally adjusting the share price, without directly changing the company's underlying market capitalization. Although a stock split does not automatically increase a company's fundamental value, it can influence market perception, share accessibility, and trading activity.
Monitoring these events manually across multiple companies can be time-consuming. Traders and analysts may need to examine numerous financial calendars, identify upcoming announcements, compare event dates, and prioritize securities that require closer attention. An automated event-monitoring framework can simplify this process by collecting corporate event information and transforming it into structured analytical outputs.
Python provides an effective environment for developing such systems. Through financial APIs, developers can retrieve earnings announcements and stock split information, process event dates, standardize company identifiers, and calculate analytical priority scores. Libraries such as Requests, Pandas, NumPy, Matplotlib, and Seaborn support automated data acquisition, data manipulation, statistical calculations, and visualization.
This article presents Market Event Trading Analyzer, a Python-based financial intelligence system that integrates earnings event monitoring and stock split detection through the MarketFlow All-in-One Market Finance API. The system retrieves corporate events scheduled within a 30-day analysis window and processes them into a consolidated market event dataset.
The framework evaluates each event according to its proximity to the current date. Earnings announcements and stock splits receive different priority scores based on their scheduled timing, allowing the system to distinguish between events that require immediate attention and those that can be monitored over a longer period.
The system also aggregates multiple corporate events by stock symbol to generate an automated trading watchlist. Each stock receives a priority score and a corresponding classification, including CAUTION, WATCH, or MONITOR. The resulting dashboard presents event distributions, high-priority stocks, upcoming earnings announcements, and stock split schedules.
The objective of this implementation is to demonstrate how Python can transform corporate event information into an automated monitoring and prioritization framework. By combining earnings calendars, stock split records, event scoring, and dashboard visualization, Market Event Trading Analyzer provides a structured approach to identifying upcoming corporate events that may require further market analysis.
2. Methodology
Market Event Trading Analyzer consists of five computational cells, each responsible for a specific stage of the analytical workflow.
Cell 1 — Library, API Configuration, and Analysis Period: imports the required libraries, configures RapidAPI authentication, and establishes a dynamic 30-day analysis period.
Cell 2 — API Data Collection: retrieves earnings announcements and stock split events through separate MarketFlow API endpoints.
Cell 3 — Data Cleaning and Integration: extracts event records, standardizes company symbols and event dates, identifies available supplementary information, and combines both event datasets.
Cell 4 — Trading Intelligence and Event Scoring: calculates event priority scores, classifies trading risks, aggregates events by stock, and generates an automated watchlist.
Cell 5 — Dashboard, Visualization, and Trading Report: presents event statistics, visualizes corporate event distributions, displays high-priority stocks, and exports analytical results into CSV files.
2.1. Earnings Event Data Acquisition
The earnings monitoring component retrieves corporate earnings information through the MarketFlow endpoint:
/earnings-events
The request uses three parameters:
skip: pagination offset, initialized at zero.start_date: the current analysis date.end_date: 30 days after the analysis date.
The retrieved records are processed to identify available stock symbols, earnings dates, company names, actual EPS, estimated EPS, revenue, and estimated revenue.
2.2. Stock Split Event Acquisition
The stock split monitoring component retrieves corporate split information through:
/splits-events
The endpoint uses the same analysis period as the earnings component, allowing both datasets to be compared within a consistent timeframe.
Available supplementary fields include company names, split ratios, execution dates, announcement dates, and other event-related information returned by the API.
2.3. Data Cleaning and Event Integration
The system uses the extract_records() function to identify event records within different JSON response structures.
The normalize_events() function then standardizes the records into a common format containing:
Stock symbol.
Event date.
Event type.
Available company and financial information.
The earnings and stock split datasets are subsequently combined into a single DataFrame.
The system calculates the number of days remaining until each event using:
\[ DaysToEvent = EventDate - CurrentDate \]
Only events with a remaining period between zero and 30 days are retained in the consolidated dataset.
2.4. Event Priority Scoring
The event scoring engine assigns different priority scores to earnings announcements and stock splits according to their proximity to the scheduled date.
The scoring methodology is defined as follows:
Days to event | Earnings score | Stock split score |
|---|---|---|
0–2 days | 100 | 65 |
3–5 days | 80 | 50 |
6–10 days | 55 | 35 |
11–20 days | 30 | 20 |
21–30 days | 10 | 10 |
The higher weighting assigned to earnings events reflects their role in the framework as a higher-priority monitoring category. These scores represent predefined analytical priorities rather than statistically measured probabilities of market volatility.
2.5. Trading Risk Classification
The framework assigns different event classifications according to event type and timing.
For earnings announcements:
HIGH EVENT RISK: earnings event within two days.
ELEVATED RISK: earnings event within three to five days.
MONITOR: earnings event more than five days away.
For stock splits:
SPLIT WATCH: stock split within two days.
MONITOR: stock split more than two days away.
These classifications are designed to help organize monitoring priorities. They do not independently establish whether an event will cause a positive or negative price reaction.
2.6. Stock-Level Priority Aggregation
The system aggregates event records by stock symbol to determine the overall monitoring priority of each company.
The initial priority score is based on the highest event score associated with the stock. An additional score is applied when multiple corporate events are recorded for the same company.
\[ PriorityScore = EventScore + \min(5(N-1),10) \]
Where:
\(N\) represents the number of recorded events for the stock.
The additional score is capped at 10 points.
The final priority score is capped at 100.
The resulting watchlist uses three classifications:
Priority score | Trading action |
|---|---|
80–100 | CAUTION |
50–79 | WATCH |
Below 50 | MONITOR |
The watchlist is sorted from the highest to the lowest priority score.
3. Implementation and Python Code
The implementation below follows the uploaded market_event_trading_analyzer.py file. The complete program is divided into five cells to support execution in Google Colab or a Jupyter Notebook.
Cell 1 — Library, API Configuration, and Analysis Period
The first cell imports the required libraries and configures the MarketFlow API connection.
The analysis period is generated dynamically using the current date and a 30-day forward window. This means the system automatically updates its monitoring period whenever the notebook is executed.
The RapidAPI key is entered through getpass to prevent the credential from being displayed directly in the notebook.
Code — Cell 1
# ============================================================
# CELL 1 — SETUP & CONFIGURATION
# ============================================================

%pip -q install requests pandas numpy matplotlib seaborn

import requests
import pandas as pd
import numpy as np
import matplotlib.pyplot as plt
import seaborn as sns
import json
from datetime import date, timedelta
from getpass import getpass
from IPython.display import display, Markdown

# API CONFIGURATION
HOST = "marketflow-all-in-one-market-finance-api.p.rapidapi.com"
BASE_URL = f"https://{HOST}"

API_KEY = getpass("Masukkan RapidAPI Key: ").strip()

if not API_KEY:
    raise ValueError("RapidAPI Key wajib diisi.")

HEADERS = {
    "x-rapidapi-key": API_KEY,
    "x-rapidapi-host": HOST
}

# ANALYSIS PERIOD
START_DATE = date.today()
END_DATE = START_DATE + timedelta(days=30)

START_DATE = START_DATE.isoformat()
END_DATE = END_DATE.isoformat()

# DISPLAY SETTINGS
pd.set_option("display.max_columns", None)
pd.set_option("display.width", 180)

sns.set_theme(style="whitegrid")

print("=" * 65)
print("       MARKET EVENT TRADING ANALYZER")
print("=" * 65)
print(f"Analysis Period : {START_DATE} to {END_DATE}")
print("Data Source     : MarketFlow API")
print("Analysis Type   : Earnings & Stock Splits")
print("Status          : READY")
Cell 2 — API Data Collection
The second cell retrieves earnings announcements and stock split records through two independent API endpoints.
The api_get() function manages authenticated HTTP requests, applies a 30-second timeout, and checks the response status before returning JSON data.
Exception handling is implemented separately for each endpoint. Consequently, an error in earnings retrieval does not immediately prevent the stock split request from being executed.
The raw API responses are also displayed in JSON format to facilitate inspection of their structures before the data-cleaning stage.
Code — Cell 2
# ============================================================
# CELL 2 — API DATA COLLECTION
# ============================================================

def api_get(endpoint, params=None):
    url = f"{BASE_URL}{endpoint}"

    response = requests.get(
        url,
        headers=HEADERS,
        params=params or {},
        timeout=30
    )

    if not response.ok:
        raise RuntimeError(
            f"HTTP {response.status_code}: {response.text[:500]}"
        )

    return response.json()


# FETCH EARNINGS EVENTS
try:
    earnings_raw = api_get(
        "/earnings-events",
        params={
            "skip": 0,
            "start_date": START_DATE,
            "end_date": END_DATE
        }
    )
    print("Earnings API berhasil diambil.")

except Exception as e:
    earnings_raw = None
    print("Earnings API Error:", e)


# FETCH STOCK SPLITS
try:
    splits_raw = api_get(
        "/splits-events",
        params={
            "skip": 0,
            "start_date": START_DATE,
            "end_date": END_DATE
        }
    )
    print("Stock Splits API berhasil diambil.")

except Exception as e:
    splits_raw = None
    print("Stock Splits API Error:", e)


# INSPECT RAW DATA
print("\n========== EARNINGS SAMPLE ==========")
print(json.dumps(earnings_raw, indent=2, default=str)[:2500]
      if earnings_raw is not None else "No data")

print("\n========== SPLITS SAMPLE ==========")
print(json.dumps(splits_raw, indent=2, default=str)[:2500]
      if splits_raw is not None else "No data")
Cell 3 — Data Cleaning and Integration
The third cell processes the raw API responses and converts them into standardized event datasets.
The extract_records() function searches for event records within common JSON keys, including data, results, events, earnings, splits, and items.
The normalize_events() function identifies the stock symbol and event date using predefined column candidates. It also preserves supplementary information when available, including company names, EPS values, revenue, split ratios, and event timing.
After normalization, the earnings and stock split datasets are combined into a single DataFrame.
The system then calculates the number of days remaining until each event and filters the dataset to retain only events occurring within the next 30 days.
Code — Cell 3
# ============================================================
# CELL 3 — DATA CLEANING & INTEGRATION
# ============================================================

def extract_records(payload):

    if payload is None:
        return []

    if isinstance(payload, list):
        return [x for x in payload if isinstance(x, dict)]

    if isinstance(payload, dict):

        for key in [
            "data", "results", "events",
            "earnings", "splits", "items"
        ]:

            if key in payload:
                records = extract_records(payload[key])

                if records:
                    return records

        return [payload] if any(
            k in payload for k in [
                "symbol", "ticker", "stockSymbol",
                "earningsDate", "splitDate", "eventDate"
            ]
        ) else []

    return []


def normalize_events(payload, event_type):

    records = extract_records(payload)

    df = pd.json_normalize(records, sep="_")

    if df.empty:
        return pd.DataFrame()

    # Detect columns
    def find_column(candidates):
        for col in candidates:
            if col in df.columns:
                return col
        return None

    symbol_col = find_column([
        "symbol", "ticker", "stockSymbol",
        "stock_symbol", "data_symbol"
    ])

    date_col = find_column([
        "date", "eventDate", "earningsDate",
        "splitDate", "executionDate",
        "announcementDate", "startDate"
    ])

    if symbol_col is None or date_col is None:
        print(f"Kolom belum dikenali untuk {event_type}.")
        print("Kolom tersedia:", df.columns.tolist())
        return pd.DataFrame()

    result = pd.DataFrame()

    result["symbol"] = df[symbol_col].astype(str).str.upper()
    result["event_date"] = pd.to_datetime(
        df[date_col], errors="coerce", utc=True
    ).dt.tz_convert(None).dt.normalize()

    result["event_type"] = event_type

    # Additional information
    for col in [
        "company", "name", "epsActual",
        "epsEstimated", "revenue",
        "revenueEstimated", "splitRatio",
        "ratio", "time"
    ]:
        if col in df.columns:
            result[col] = df[col].values

    result = result.dropna(subset=["event_date"])
    result = result[
        result["symbol"].str.lower().ne("nan")
    ]

    return result


earnings_df = normalize_events(earnings_raw, "EARNINGS")
splits_df = normalize_events(splits_raw, "STOCK SPLIT")

# COMBINE DATA
events_df = pd.concat(
    [earnings_df, splits_df],
    ignore_index=True
)

if not events_df.empty:

    events_df["days_to_event"] = (
        events_df["event_date"] -
        pd.Timestamp.today().normalize()
    ).dt.days

    events_df = events_df[
        (events_df["days_to_event"] >= 0) &
        (events_df["days_to_event"] <= 30)
    ]

    events_df = events_df.sort_values(
        ["event_date", "symbol"]
    ).reset_index(drop=True)

print("Total Earnings Events :", len(earnings_df))
print("Total Split Events    :", len(splits_df))
print("Total Combined Events :", len(events_df))

display(events_df.head(15))
Cell 4 — Trading Intelligence and Event Scoring
The fourth cell implements the event priority scoring engine.
The calculate_event_score() function assigns different scores to earnings announcements and stock split events based on the number of days remaining until their scheduled dates.
A separate classification function assigns event-level monitoring categories.
The system then aggregates the event records by stock symbol. For each stock, it calculates the total number of events, event types, nearest event date, maximum event score, and associated event date.
Stocks with multiple recorded events receive additional priority points, subject to a maximum bonus of 10 points.
Finally, the system assigns CAUTION, WATCH, or MONITOR classifications and sorts the watchlist according to the resulting priority score.
Code — Cell 4
# ============================================================
# CELL 4 — TRADING INTELLIGENCE ENGINE
# ============================================================

def calculate_event_score(row):

    days = row["days_to_event"]
    event = row["event_type"]

    if event == "EARNINGS":

        if days <= 2:
            return 100
        elif days <= 5:
            return 80
        elif days <= 10:
            return 55
        elif days <= 20:
            return 30
        else:
            return 10

    elif event == "STOCK SPLIT":

        if days <= 2:
            return 65
        elif days <= 5:
            return 50
        elif days <= 10:
            return 35
        elif days <= 20:
            return 20
        else:
            return 10

    return 0


if not events_df.empty:

    events_df["event_score"] = events_df.apply(
        calculate_event_score,
        axis=1
    )

    def classify_event(row):

        if row["event_type"] == "EARNINGS":

            if row["days_to_event"] <= 2:
                return "HIGH EVENT RISK"
            elif row["days_to_event"] <= 5:
                return "ELEVATED RISK"
            else:
                return "MONITOR"

        else:

            if row["days_to_event"] <= 2:
                return "SPLIT WATCH"
            else:
                return "MONITOR"

    events_df["trading_signal"] = events_df.apply(
        classify_event,
        axis=1
    )

    # Aggregate by stock
    watchlist = (
        events_df.sort_values(
            "event_score",
            ascending=False
        )
        .groupby("symbol")
        .agg(
            total_events=("event_type", "count"),
            event_types=(
                "event_type",
                lambda x: ", ".join(sorted(set(x)))
            ),
            nearest_event=("days_to_event", "min"),
            priority_score=("event_score", "max"),
            event_date=("event_date", "min")
        )
        .reset_index()
    )

    watchlist["priority_score"] = (
        watchlist["priority_score"] +
        np.minimum(
            (watchlist["total_events"] - 1) * 5,
            10
        )
    ).clip(upper=100)

    def trading_action(row):

        if row["priority_score"] >= 80:
            return "CAUTION"

        elif row["priority_score"] >= 50:
            return "WATCH"

        return "MONITOR"

    watchlist["trading_action"] = watchlist.apply(
        trading_action,
        axis=1
    )

    watchlist = watchlist.sort_values(
        "priority_score",
        ascending=False
    ).reset_index(drop=True)

    print("TOP TRADING WATCHLIST")
    display(watchlist.head(20))

else:
    watchlist = pd.DataFrame()
    print("Belum ada event yang tersedia pada periode analisis.")
Cell 5 — Dashboard, Visualization, and Trading Report
The fifth cell generates the final Market Event Trading Dashboard.
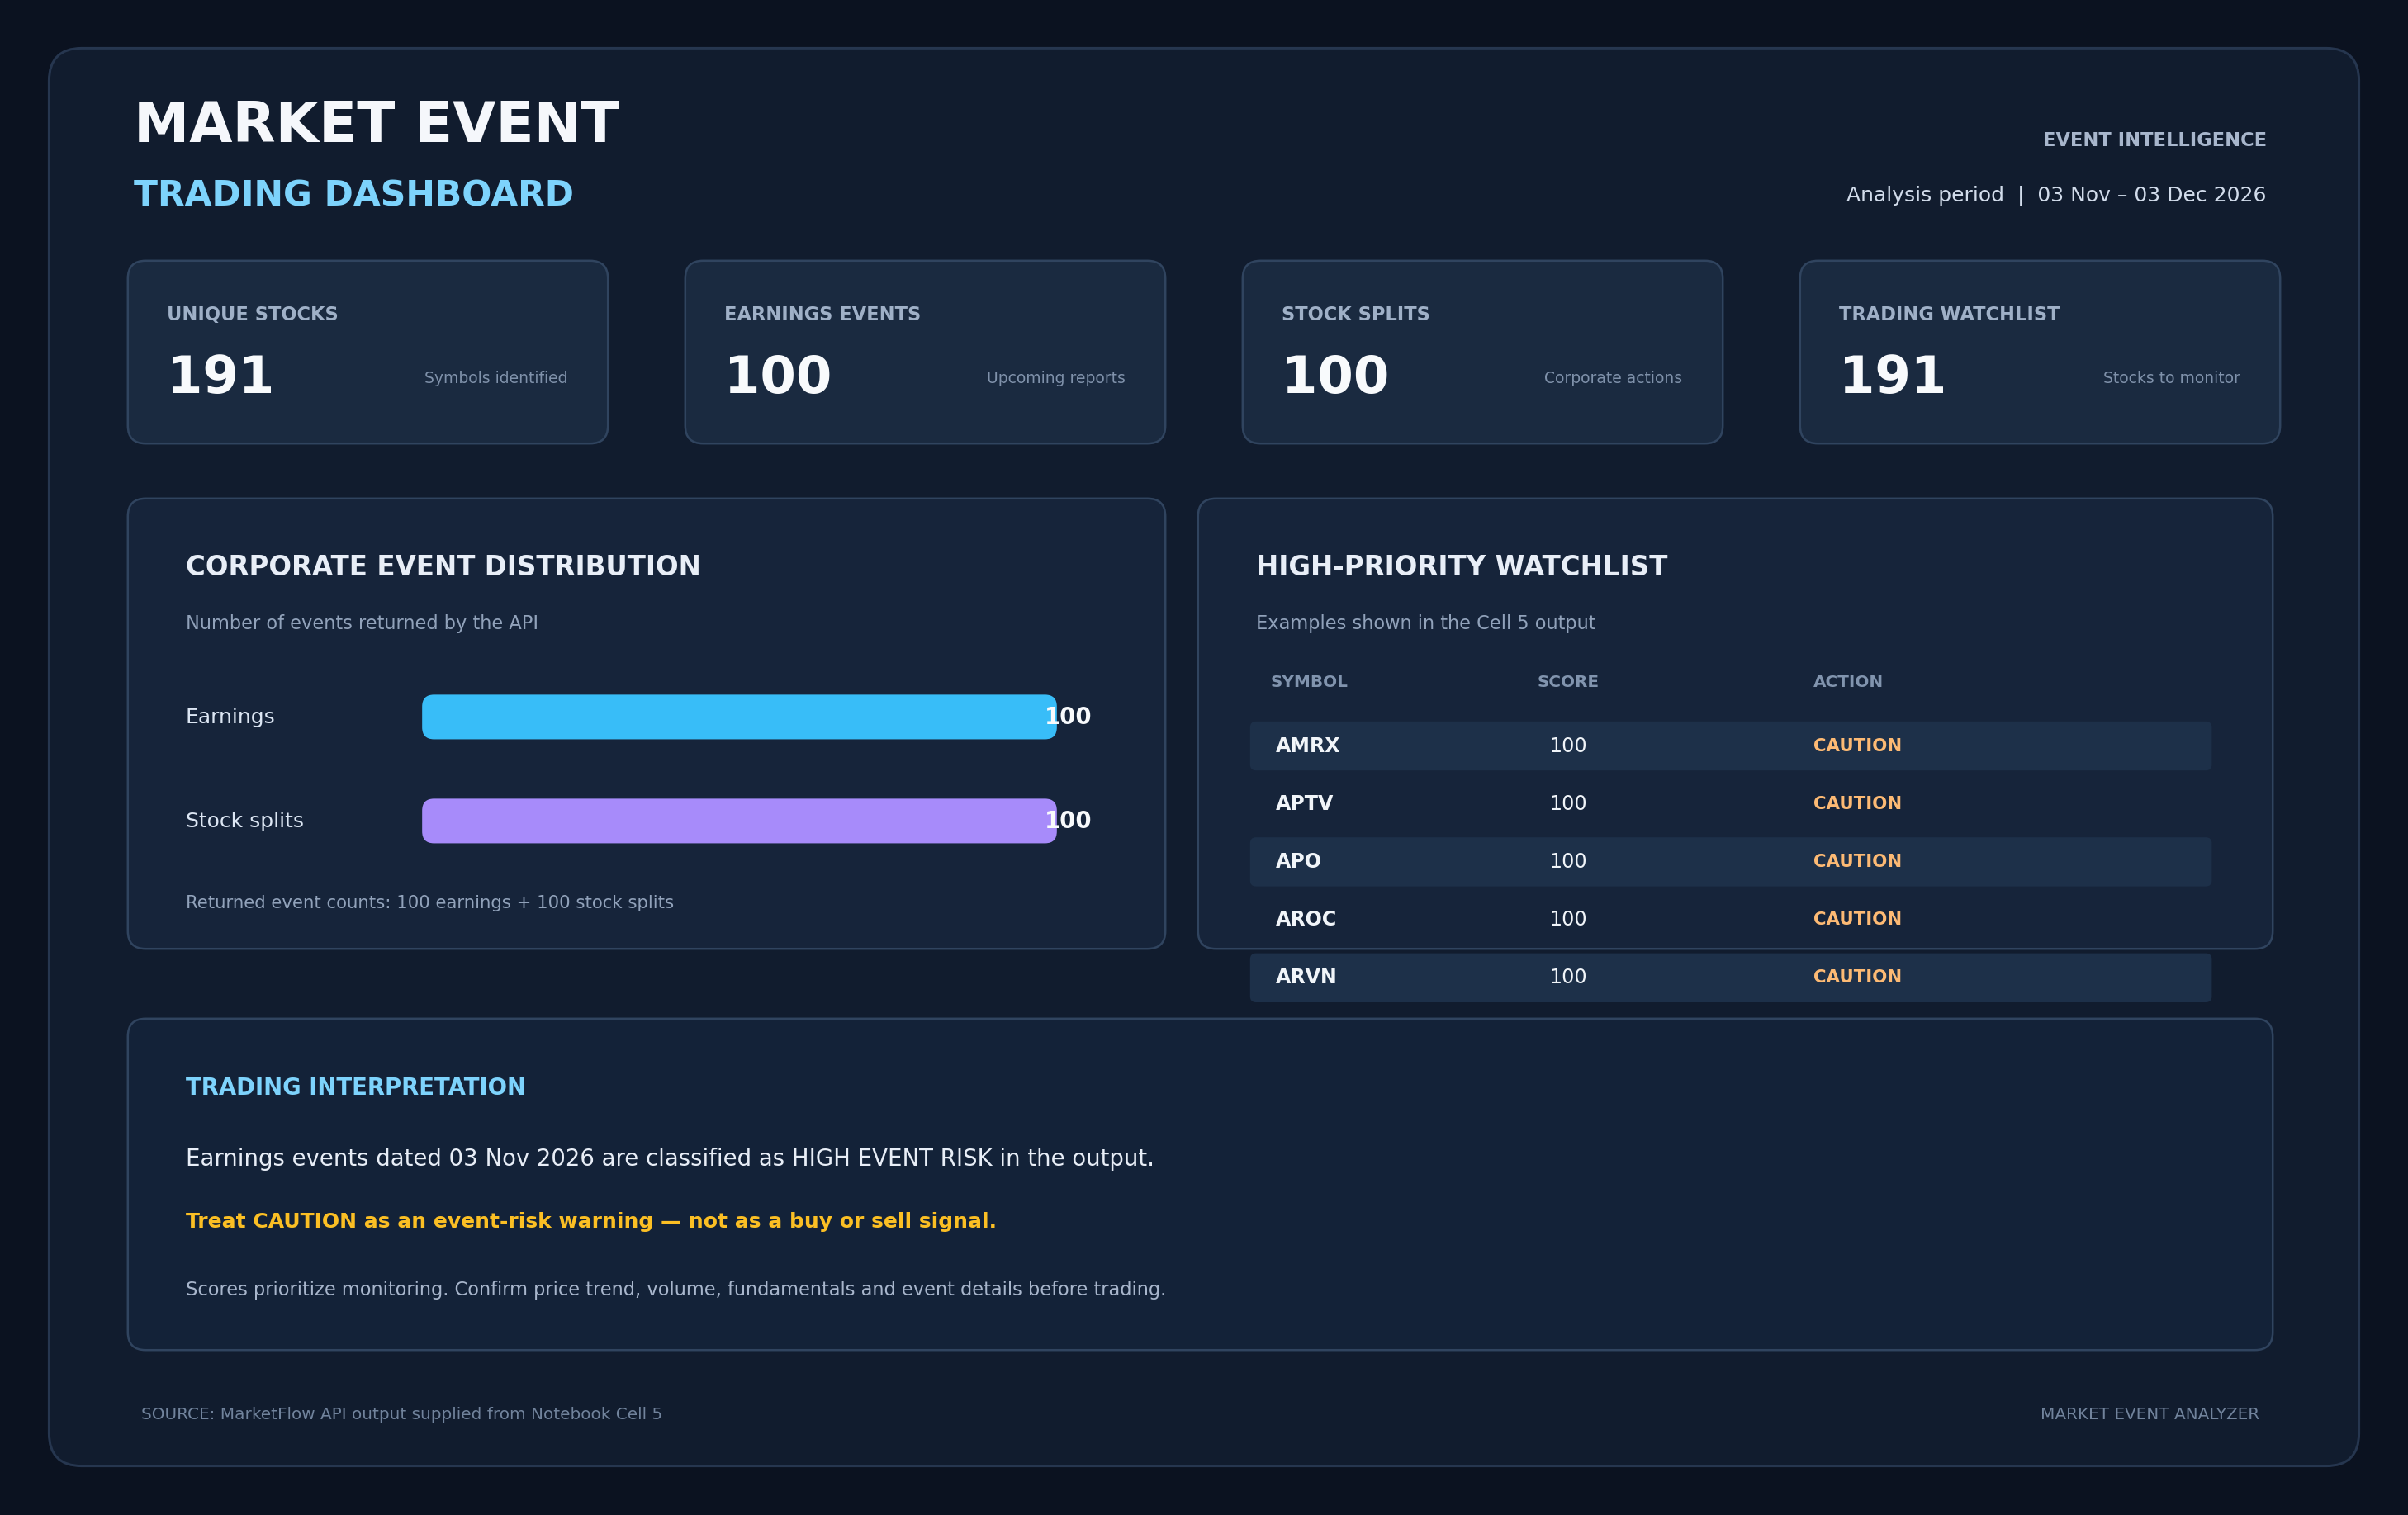
The dashboard calculates the number of unique stocks, earnings events, stock split events, and companies included in the trading watchlist.
Two visualizations are generated. The first presents the distribution of corporate event types, while the second ranks the 15 highest-priority stocks according to their event scores.
The final report separately presents high-priority stocks, upcoming earnings announcements, and upcoming stock split events.
The system also exports two CSV files containing the consolidated event dataset and the stock-level trading watchlist.
Code — Cell 5
# ============================================================
# CELL 5 — DASHBOARD & TRADING REPORT
# ============================================================

if not events_df.empty:

    # SUMMARY METRICS
    total_stocks = events_df["symbol"].nunique()
    total_earnings = (events_df["event_type"] == "EARNINGS").sum()
    total_splits = (events_df["event_type"] == "STOCK SPLIT").sum()

    display(Markdown("# MARKET EVENT TRADING DASHBOARD"))

    display(Markdown(
        f"""
        **Analysis Period:** {START_DATE} – {END_DATE}

        - Unique Stocks: **{total_stocks}**
        - Earnings Events: **{total_earnings}**
        - Stock Split Events: **{total_splits}**
        - Trading Watchlist: **{len(watchlist)}**
        """
    ))

    # CHART 1 — EVENT DISTRIBUTION
    fig, axes = plt.subplots(1, 2, figsize=(15, 5))

    events_df["event_type"].value_counts().plot(
        kind="bar",
        ax=axes[0]
    )

    axes[0].set_title("Corporate Event Distribution")
    axes[0].set_xlabel("Event Type")
    axes[0].set_ylabel("Number of Events")
    axes[0].tick_params(axis="x", rotation=0)

    # CHART 2 — TOP PRIORITY STOCKS
    top_stocks = watchlist.head(15).sort_values(
        "priority_score"
    )

    axes[1].barh(
        top_stocks["symbol"],
        top_stocks["priority_score"]
    )

    axes[1].set_title("Top 15 Event Priority Stocks")
    axes[1].set_xlabel("Priority Score")
    axes[1].set_xlim(0, 110)

    plt.tight_layout()
    plt.show()

    # TRADING INSIGHT
    print("\n" + "=" * 65)
    print("TRADING INTELLIGENCE REPORT")
    print("=" * 65)

    print("\n1. HIGH PRIORITY STOCKS")

    high_priority = watchlist[
        watchlist["trading_action"] == "CAUTION"
    ]

    display(high_priority)

    print("\n2. UPCOMING EARNINGS")

    display(
        events_df[
            events_df["event_type"] == "EARNINGS"
        ].sort_values("days_to_event").head(10)
    )

    print("\n3. UPCOMING STOCK SPLITS")

    display(
        events_df[
            events_df["event_type"] == "STOCK SPLIT"
        ].sort_values("days_to_event").head(10)
    )

    # EXPORT RESULTS
    events_df.to_csv(
        "market_events_analysis.csv",
        index=False
    )

    watchlist.to_csv(
        "trading_watchlist.csv",
        index=False
    )

    print("\nREPORT BERHASIL DIBUAT")
    print("- market_events_analysis.csv")
    print("- trading_watchlist.csv")

else:
    print("Dashboard tidak dapat dibuat karena data event kosong.")
Result:
4. Results and Discussion
4.1. Earnings and Stock Split Data Retrieval
The data acquisition module retrieves two categories of corporate events through the MarketFlow API: earnings announcements and stock split records.
The earnings endpoint provides information about upcoming company financial disclosures, while the stock split endpoint supplies information about scheduled share split activities.
Both datasets are retrieved using an identical 30-day analysis window. This provides a consistent basis for comparing different corporate event categories.
The system also displays sample API responses in JSON format, allowing analysts to inspect the available fields and verify the structure of the retrieved information.
The number of successfully retrieved records depends on API availability, data coverage, and the reporting period.
4.2. Data Normalization and Event Integration
The data-cleaning process transforms the raw API responses into standardized event records.
Each record contains a stock symbol, event date, and event type. Additional financial information is retained when available.
Combining the earnings and stock split datasets allows the system to examine different corporate events within a single analytical framework.
The calculation of days remaining until each event provides an additional temporal dimension for prioritizing market monitoring activities.
Events outside the selected 30-day window are excluded from the consolidated dataset. Consequently, the resulting dashboard focuses exclusively on corporate events scheduled within the defined monitoring period.
4.3. Earnings Event Priority Assessment
Earnings announcements receive the highest priority scores when they are scheduled within the next two days.
The scoring mechanism gradually decreases as the event date becomes more distant.
This approach allows the system to distinguish between immediate earnings announcements and those that remain several weeks away.
The event classification provides an additional interpretation of monitoring urgency. Events occurring within two days are categorized as HIGH EVENT RISK, while announcements scheduled within three to five days receive an ELEVATED RISK classification.
These categories indicate monitoring priority rather than the actual probability of an adverse market reaction.
4.4. Stock Split Event Monitoring
The stock split monitoring component applies a separate scoring methodology to corporate split events.
A stock split scheduled within two days receives a score of 65 and is classified as SPLIT WATCH. Events scheduled beyond two days receive a lower monitoring priority.
The distinction between earnings and stock split scoring reflects the different analytical roles assigned to each event within the framework.
Earnings announcements are prioritized more heavily because they provide new financial performance information, whereas stock splits primarily change the number of outstanding shares and the corresponding per-share price.
The resulting classifications help analysts identify which events require closer observation without assuming that a stock split necessarily produces a bullish or bearish price movement.
4.5. Automated Trading Watchlist Generation
The stock-level aggregation mechanism combines multiple event records associated with the same company.
The highest event score is used as the initial priority score, while additional corporate events contribute a limited bonus.
This approach ensures that companies with several upcoming events can receive higher monitoring priority than companies with only one event of similar importance.
The final watchlist assigns each stock to one of three categories:
CAUTION: stocks with a priority score of at least 80.
WATCH: stocks with a priority score between 50 and 79.
MONITOR: stocks with a priority score below 50.
The watchlist is sorted according to the priority score, allowing analysts to focus on the companies with the highest predefined event-monitoring priorities.
4.6. Corporate Event Distribution and Visualization
The dashboard presents two complementary visualizations.
The corporate event distribution chart illustrates the number of earnings announcements and stock split events within the analysis period.
This visualization provides an overview of the relative frequency of the two event categories.
The second visualization displays the 15 highest-priority stocks based on their aggregated event scores.
By combining event distribution and stock-level ranking, the dashboard provides a concise overview of the upcoming corporate event landscape.
These visualizations can support further investigation into individual companies and their scheduled announcements.
4.7. Trading Intelligence Report and Data Export
The final reporting module separates the analytical results into three categories: high-priority stocks, upcoming earnings announcements, and upcoming stock split events.
This organization makes the output easier to interpret and supports more focused monitoring of individual securities.
The system also generates two CSV files.
File | Description |
|---|---|
| Consolidated earnings and stock split records with event scores and classifications. |
| Aggregated stock-level event information and priority rankings. |
The exported datasets can be used for additional statistical analysis, spreadsheet reporting, and integration with other financial monitoring systems.
4.8. Limitations and Future Improvements
Several limitations should be considered when interpreting the results.
First, the analysis is limited to a 30-day monitoring period. Corporate events scheduled beyond this period are not included in the dashboard.
Second, the framework depends on the availability and accuracy of MarketFlow API responses. Missing symbols, dates, or supplementary financial information may affect data normalization and event classification.
Third, the scoring methodology uses predefined thresholds. The assigned scores reflect analytical monitoring priorities rather than statistically validated measures of market risk or expected returns.
Fourth, the current watchlist aggregation uses the earliest event date when combining records for each stock. When a company has multiple event types, this date may not correspond to the event with the highest priority score. The nearest-event field separately records the minimum number of days remaining.
Fifth, the system does not evaluate the actual financial impact of earnings announcements. Although the API may provide actual EPS, estimated EPS, revenue, and estimated revenue, these variables are not currently incorporated into the event scoring formula.
Sixth, the framework does not include historical backtesting. Therefore, it cannot establish whether stocks receiving higher event priority scores subsequently experience greater volatility or generate superior trading returns.
Future improvements could include integrating earnings surprises, historical price reactions, trading volume, analyst expectations, and volatility measurements.
Additional functionality could also include automated event reminders, historical event-performance comparisons, multi-exchange coverage, and real-time corporate event updates.
These developments would transform the current event-monitoring framework into a more comprehensive corporate event intelligence system.
5. Conclusion
Market Event Trading Analyzer demonstrates how Python can automate the collection, processing, classification, and prioritization of corporate financial events.
The framework integrates earnings announcements and stock split information through the MarketFlow API, standardizes the retrieved records, calculates the number of days remaining until each event, and generates event-specific priority scores.
The automated trading intelligence engine further aggregates corporate events by stock symbol to produce a prioritized watchlist containing CAUTION, WATCH, and MONITOR classifications.
The final dashboard presents corporate event distributions, high-priority stocks, upcoming earnings announcements, and stock split schedules. It also exports consolidated event records and stock-level watchlists into CSV files for further analysis.
The framework provides a structured approach to monitoring corporate events and identifying securities that may require additional investigation before important announcements.
Nevertheless, the resulting priority scores should be interpreted as monitoring indicators rather than direct trading recommendations. Earnings announcements and stock splits can produce different market reactions depending on company fundamentals, investor expectations, market conditions, and broader economic developments.
Future development should focus on integrating earnings surprise analysis, historical volatility, trading volume, and event-driven backtesting. With these improvements, Market Event Trading Analyzer can serve as a foundation for more advanced automated corporate event monitoring and systematic trading intelligence.