Financial markets are influenced not only by historical price movements and technical indicators but also by corporate developments and scheduled market events. Earnings announcements and Initial Public Offerings (IPOs) are among the important events that can attract investor attention, influence market sentiment, and create potential trading opportunities.
Earnings announcements provide information about a company's financial performance, profitability, and business outlook. These announcements can influence stock market expectations, particularly when reported results differ from analysts' expectations. Similarly, IPO events represent opportunities for companies to enter public financial markets and attract investor interest.
Monitoring these events manually can become challenging, especially when traders need to examine multiple companies and evaluate the timing of upcoming announcements. An automated event monitoring system can help organize financial information, prioritize relevant events, and support more systematic market observation.
Python provides an effective environment for developing such systems through API integration, data processing, numerical analysis, and visualization. Libraries such as Requests, Pandas, NumPy, Matplotlib, and Seaborn enable developers to retrieve financial event information, normalize datasets, calculate analytical scores, and generate visual reports.
This article presents Market Event Trading Analyzer, a Python-based financial event analysis framework developed using the MarketFlow All-in-One Market Finance API through RapidAPI. The system retrieves two major categories of financial market events: earnings announcements and Initial Public Offerings.
The analytical framework processes event information within a dynamically configured 30-day period, beginning on the current date and ending 30 days later. The retrieved datasets are combined into a unified event table containing event dates, ticker symbols, company names, and event classifications.
To identify events that deserve greater attention, the system implements a trading catalyst scoring mechanism based on event importance and temporal proximity. Earnings events receive a weight of 3 points, while IPO events receive a weight of 2 points. Additional points are assigned according to the number of days remaining before each event.
The combined score is used to classify events into three priority categories: HIGH PRIORITY, WATCHLIST, and LOW PRIORITY. The resulting dataset is sorted according to attention score and event date, producing an organized trading catalyst watchlist.
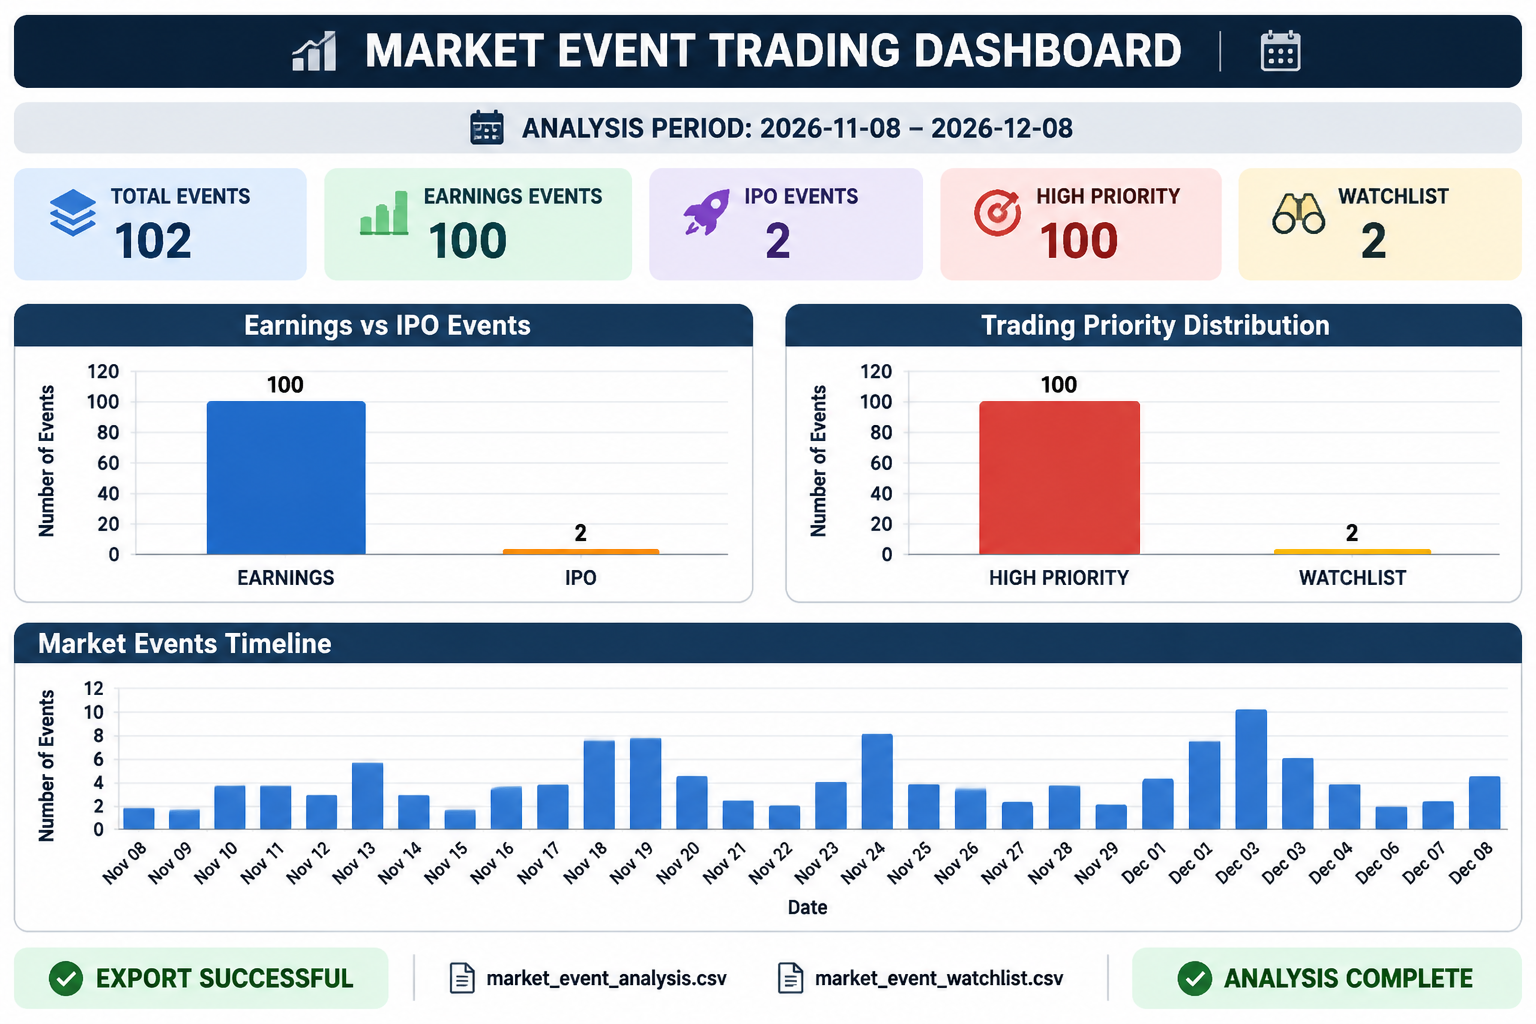
The system also generates a market event dashboard containing event distribution charts, trading priority distribution, and a chronological event timeline. Finally, the processed datasets are exported into CSV files for further financial analysis.
The primary objective of this implementation is to demonstrate how Python and financial APIs can be integrated into an automated market event monitoring framework. By combining earnings and IPO information with temporal scoring and priority classification, Market Event Trading Analyzer provides a structured approach to identifying and organizing potentially relevant financial market catalysts.
2. Methodology
The Market Event Trading Analyzer framework consists of five computational cells. Each cell performs a specific function within the overall analytical workflow.
Cell | Main function |
|---|---|
Cell 1 | Library installation, API authentication, and dynamic analysis period configuration. |
Cell 2 | Retrieval of earnings and IPO event information through MarketFlow API. |
Cell 3 | Data extraction, normalization, event classification, and date processing. |
Cell 4 | Trading catalyst scoring, temporal analysis, priority classification, and watchlist ranking. |
Cell 5 | Market event dashboard generation, event visualization, timeline analysis, and CSV export. |
2.1. API Configuration and Analysis Period
The system uses the MarketFlow All-in-One Market Finance API through RapidAPI as its primary financial data provider.
API authentication is managed using a RapidAPI key entered interactively through Python's getpass module. This approach prevents the authentication credential from being directly displayed in the notebook.
The analysis period is dynamically generated using Python's datetime and timedelta modules.
The starting date is determined using the current date, while the ending date is calculated by adding 30 days.
\[ End\ Date=Start\ Date+30\ Days \]
This configuration allows the system to monitor upcoming earnings and IPO events without manually changing the reporting dates for each execution.
2.2. Earnings and IPO Data Retrieval
The second stage retrieves financial event information through two MarketFlow API endpoints:
/earnings-eventsretrieves corporate earnings announcements./ipos-eventsretrieves Initial Public Offering information.
Both endpoints use the same request parameters:
Parameter | Configuration |
|---|---|
skip | 0 |
start_date | Current date |
end_date | Current date + 30 days |
Timeout | 30 seconds |
The reusable get_market_events() function manages authenticated GET requests, verifies the HTTP response status, and converts successful responses into JSON data.
The retrieved earnings and IPO datasets are initially maintained separately to preserve their original API responses.
2.3. Data Cleaning and Normalization
The third stage transforms the raw API responses into structured Pandas DataFrames.
The extract_records() function searches the API response for event records stored in lists or nested dictionary structures.
The extracted records are normalized using pd.json_normalize(), allowing nested JSON fields to be represented in tabular form.
Each dataset receives an additional event_type column:
EARNINGS for earnings announcements.
IPO for initial public offerings.
The two datasets are then combined using pd.concat() to create a unified event table.
The system identifies event dates using several possible column names, including date, event_date, earnings_date, ipo_date, announcement_date, priced_date, and expected_date.
Ticker information is extracted from available symbol-related columns, while company names are identified using alternative company-name fields.
The resulting event dates are converted into Pandas datetime objects, invalid dates are removed, and the records are sorted chronologically.
2.4. Trading Catalyst Scoring
The fourth stage evaluates the importance and timing of each financial event.
The first component is the event weight:
Event type | Event weight |
|---|---|
EARNINGS | 3 |
IPO | 2 |
The second component is the temporal proximity score.
Days remaining | Time score |
|---|---|
Past events | 0 |
0–3 days | 3 |
4–7 days | 2 |
8–30 days | 1 |
More than 30 days | 0 |
The total attention score is calculated using:
\[ Attention\ Score=Event\ Weight+Time\ Score \]
This formula gives higher attention scores to events that have greater predefined importance and are approaching more closely.
2.5. Trading Priority Classification
After calculating the attention scores, the system classifies each event into three priority categories.
Attention score | Priority classification |
|---|---|
6 or higher | HIGH PRIORITY |
4–5 | WATCHLIST |
Below 4 | LOW PRIORITY |
The classification is implemented using a conditional function.
The resulting events are then ranked according to two criteria:
Attention score in descending order.
Event date in ascending order.
This sorting procedure places events with higher attention scores first and prioritizes earlier event dates when scores are equal.
The final result is a trading catalyst watchlist containing the event date, ticker, company name, event type, remaining days, attention score, and trading priority.
2.6. Dashboard Visualization and Data Export
The fifth stage generates a market event dashboard using Matplotlib and Seaborn.
Three visualizations are produced:
Earnings versus IPO event distribution.
Trading priority distribution.
Market event timeline.
The first chart compares the number of earnings and IPO events. The second displays the distribution of events across priority categories. The third illustrates the number of scheduled events for each date.
The system also generates summary statistics, including total events, earnings events, IPO events, high-priority events, and watchlist events.
Finally, two CSV datasets are exported:
market_event_analysis.csvmarket_event_watchlist.csv
These files provide structured outputs for further analysis, reporting, and integration with other financial research workflows.
3. Implementation and Full Python Code
The implementation is developed using Python and the MarketFlow All-in-One Market Finance API. The complete program is organized into five computational cells, following the original uploaded source code.
The code can be executed sequentially in Google Colab or Jupyter Notebook. Users must provide a valid RapidAPI key before running the API requests.
Cell 1 — Setup and API Configuration
The first cell installs the required Python libraries and initializes the API authentication process.
The analysis period is automatically configured to cover the current date and the following 30 days. This makes the framework suitable for recurring financial event monitoring.
Code — Cell 1
# ==========================================
# CELL 1: SETUP & CONFIGURATION
# ==========================================

!pip -q install requests pandas numpy matplotlib seaborn

import requests
import pandas as pd
import numpy as np
import matplotlib.pyplot as plt
import seaborn as sns
from getpass import getpass
from datetime import datetime, timedelta

# API CONFIGURATION
API_KEY = getpass("Masukkan RapidAPI Key: ")

HOST = "marketflow-all-in-one-market-finance-api.p.rapidapi.com"

BASE_URL = f"https://{HOST}"

HEADERS = {
    "x-rapidapi-key": API_KEY,
    "x-rapidapi-host": HOST
}

# PERIODE ANALISIS
START_DATE = datetime.now().strftime("%Y-%m-%d")
END_DATE = (datetime.now() + timedelta(days=30)).strftime("%Y-%m-%d")

# Jika ingin menggunakan periode manual:
# START_DATE = "2025-11-02"
# END_DATE = "2025-11-09"

print("MARKET EVENT TRADING ANALYZER")
print("Start:", START_DATE)
print("End:", END_DATE)
print("API Configuration Ready")
Cell 2 — Earnings and IPO Data Extraction
The second cell retrieves earnings and IPO information from the MarketFlow API.
The get_market_events() function provides a reusable mechanism for retrieving financial event information through authenticated HTTP requests.
Both endpoints use the same analysis period and request parameters. The returned JSON responses are stored separately as earnings_raw and ipos_raw.
Code — Cell 2
# ==========================================
# CELL 2: API DATA EXTRACTION
# ==========================================

def get_market_events(endpoint):

    url = f"{BASE_URL}/{endpoint}"

    params = {
        "skip": 0,
        "start_date": START_DATE,
        "end_date": END_DATE
    }

    response = requests.get(
        url,
        headers=HEADERS,
        params=params,
        timeout=30
    )

    response.raise_for_status()

    return response.json()


earnings_raw = get_market_events("earnings-events")

ipos_raw = get_market_events("ipos-events")

print("EARNINGS DATA:")
display(earnings_raw)

print("\nIPO DATA:")
display(ipos_raw)
Cell 3 — Data Cleaning and Normalization
The third cell transforms the raw API responses into structured datasets.
The extract_records() function searches for event records within lists and nested dictionaries.
Both datasets are normalized using Pandas, assigned their respective event types, and combined into a unified DataFrame.
The system subsequently identifies date, ticker, and company columns using predefined candidate names. Event dates are converted into datetime values, invalid dates are removed, and the resulting records are sorted chronologically.
Code — Cell 3
# ==========================================
# CELL 3: DATA CLEANING
# ==========================================

def extract_records(data):

    if isinstance(data, list):
        return data

    if isinstance(data, dict):

        for key in ["data", "results", "events", "items"]:
            if key in data:
                return extract_records(data[key])

        for value in data.values():
            if isinstance(value, list):
                return value

    return []


earnings = pd.json_normalize(extract_records(earnings_raw))
ipos = pd.json_normalize(extract_records(ipos_raw))

earnings["event_type"] = "EARNINGS"
ipos["event_type"] = "IPO"

events = pd.concat(
    [earnings, ipos],
    ignore_index=True,
    sort=False
)

# Deteksi kolom tanggal
date_candidates = [
    "date", "event_date", "earnings_date",
    "ipo_date", "announcement_date",
    "priced_date", "expected_date"
]

date_col = next(
    (c for c in date_candidates if c in events.columns),
    None
)

if date_col is None:
    raise ValueError(
        f"Kolom tanggal tidak ditemukan. "
        f"Kolom tersedia: {events.columns.tolist()}"
    )

events["event_date"] = pd.to_datetime(
    events[date_col],
    errors="coerce"
)

# Deteksi ticker
ticker_candidates = [
    "symbol", "ticker", "stock", "code"
]

ticker_col = next(
    (c for c in ticker_candidates if c in events.columns),
    None
)

events["ticker"] = (
    events[ticker_col].astype(str)
    if ticker_col else "N/A"
)

# Deteksi nama perusahaan
company_candidates = [
    "company", "company_name", "name", "issuer"
]

company_col = next(
    (c for c in company_candidates if c in events.columns),
    None
)

events["company"] = (
    events[company_col].astype(str)
    if company_col else events["ticker"]
)

events = events.dropna(subset=["event_date"])

events = events.sort_values("event_date").reset_index(drop=True)

print("TOTAL EVENTS:", len(events))

display(events.head(20))
Cell 4 — Trading Catalyst Scoring and Watchlist
The fourth cell implements the trading catalyst scoring mechanism.
The system calculates the remaining days before each event and assigns an event weight based on its classification.
Earnings events receive 3 points, while IPO events receive 2 points.
The temporal scoring function assigns additional points based on the proximity of the event date. These scores are combined to calculate the total attention score.
The final classification identifies HIGH PRIORITY, WATCHLIST, and LOW PRIORITY events.
The resulting watchlist is sorted by attention score and event date to highlight the events with the highest predefined priority.
Code — Cell 4
# ==========================================
# CELL 4: TRADING ANALYSIS
# ==========================================

TODAY = pd.Timestamp(datetime.now().date())

events["days_to_event"] = (
    events["event_date"].dt.normalize() - TODAY
).dt.days

# Bobot jenis event
events["event_weight"] = events["event_type"].map({
    "EARNINGS": 3,
    "IPO": 2
})

# Bobot kedekatan event
def time_score(days):

    if days < 0:
        return 0

    elif days <= 3:
        return 3

    elif days <= 7:
        return 2

    elif days <= 30:
        return 1

    return 0


events["time_score"] = events["days_to_event"].apply(time_score)

# Total skor
events["attention_score"] = (
    events["event_weight"] + events["time_score"]
)

# Klasifikasi
def trading_priority(score):

    if score >= 6:
        return "HIGH PRIORITY"

    elif score >= 4:
        return "WATCHLIST"

    return "LOW PRIORITY"


events["trading_priority"] = events[
    "attention_score"
].apply(trading_priority)

# Ranking
watchlist = events.sort_values(
    ["attention_score", "event_date"],
    ascending=[False, True]
)

print("TRADING CATALYST WATCHLIST")

display(
    watchlist[
        [
            "event_date",
            "ticker",
            "company",
            "event_type",
            "days_to_event",
            "attention_score",
            "trading_priority"
        ]
    ].head(30)
)
Cell 5 — Dashboard, Visualization, and Data Export
The fifth cell generates the final Market Event Trading Dashboard.
The dashboard summarizes the analysis period and the number of retrieved earnings and IPO events.
It also calculates the number of HIGH PRIORITY and WATCHLIST events.
Three visualizations are generated to examine the distribution of event types, trading priorities, and event dates.
Finally, the system exports the complete event dataset and ranked watchlist into two CSV files for further financial analysis.
Code — Cell 5
# ==========================================
# CELL 5: DASHBOARD & EXPORT
# ==========================================

print("=" * 55)
print("       MARKET EVENT TRADING DASHBOARD")
print("=" * 55)

print("ANALYSIS PERIOD:", START_DATE, "-", END_DATE)

print("TOTAL EVENTS:", len(events))

print(
    "EARNINGS EVENTS:",
    (events["event_type"] == "EARNINGS").sum()
)

print(
    "IPO EVENTS:",
    (events["event_type"] == "IPO").sum()
)

print(
    "HIGH PRIORITY:",
    (events["trading_priority"] == "HIGH PRIORITY").sum()
)

print(
    "WATCHLIST:",
    (events["trading_priority"] == "WATCHLIST").sum()
)

# VISUALIZATION
fig, axes = plt.subplots(1, 2, figsize=(14, 5))

# Event distribution
events["event_type"].value_counts().plot(
    kind="bar",
    ax=axes[0]
)

axes[0].set_title("Earnings vs IPO Events")
axes[0].set_xlabel("Event Type")
axes[0].set_ylabel("Number of Events")

# Priority distribution
events["trading_priority"].value_counts().plot(
    kind="bar",
    ax=axes[1]
)

axes[1].set_title("Trading Priority Distribution")
axes[1].set_xlabel("Priority")
axes[1].set_ylabel("Number of Events")

plt.tight_layout()
plt.show()

# EVENT TIMELINE
plt.figure(figsize=(14, 5))

daily_events = events.groupby(
    events["event_date"].dt.date
).size()

daily_events.plot(kind="bar")

plt.title("Market Events Timeline")
plt.xlabel("Date")
plt.ylabel("Number of Events")
plt.xticks(rotation=45)
plt.tight_layout()
plt.show()

# EXPORT
events.to_csv(
    "market_event_analysis.csv",
    index=False
)

watchlist.to_csv(
    "market_event_watchlist.csv",
    index=False
)

print("\nEXPORT SUCCESSFUL")
print("1. market_event_analysis.csv")
print("2. market_event_watchlist.csv")

print("\nANALYSIS COMPLETE")
Result:
4. Results and Discussion
4.1. Financial Event Data Retrieval
The API integration module retrieves two categories of financial events: earnings announcements and Initial Public Offerings.
The earnings dataset contains corporate financial announcement information, while the IPO dataset provides information about companies entering public markets.
Both datasets are retrieved independently and subsequently combined into a unified event table.
The resulting dataset allows analysts to examine multiple financial event categories within a single analytical environment.
The actual number of retrieved events depends on API availability, the selected analysis period, and the data returned by MarketFlow.
4.2. Data Cleaning and Event Classification
The data normalization process converts the API responses into structured tabular datasets.
Each record is assigned an event classification to distinguish earnings announcements from IPO events.
The system also standardizes three important analytical attributes:
Event date.
Ticker symbol.
Company name.
The resulting dataset provides the essential information required for calculating event proximity and generating the trading catalyst watchlist.
Chronological sorting further improves the organization of the financial event information.
4.3. Trading Catalyst Scoring Analysis
The trading catalyst scoring mechanism evaluates each event using two components: event importance and temporal proximity.
Earnings announcements receive a higher initial weight than IPO events because the implementation assigns them 3 points compared with 2 points for IPO events.
Additional points are determined by the remaining days before the event.
This creates a scoring mechanism in which events approaching within three days receive the highest temporal score.
For example, the theoretical scoring results are:
Event type | Days remaining | Attention score | Priority |
|---|---|---|---|
Earnings | 2 | 6 | HIGH PRIORITY |
Earnings | 5 | 5 | WATCHLIST |
Earnings | 15 | 4 | WATCHLIST |
IPO | 2 | 5 | WATCHLIST |
IPO | 5 | 4 | WATCHLIST |
IPO | 15 | 3 | LOW PRIORITY |
The examples illustrate the scoring rules rather than actual API results.
An important characteristic of this methodology is that the maximum IPO score is 5. Therefore, IPO events cannot receive HIGH PRIORITY under the current classification thresholds. Only earnings events occurring within three days can reach the HIGH PRIORITY category.
This distinction should be considered when interpreting the resulting priority distribution.
4.4. Trading Catalyst Watchlist
The watchlist module ranks financial events according to their attention scores and scheduled dates.
Events with higher scores appear first, while events with equal scores are arranged chronologically.
The resulting watchlist contains seven analytical fields:
Event date.
Ticker.
Company name.
Event type.
Days remaining.
Attention score.
Trading priority.
This structure provides an organized overview of financial events that may deserve additional research and monitoring.
The watchlist can also serve as an initial reference for developing more comprehensive event-driven trading strategies.
4.5. Market Event Dashboard
The dashboard summarizes the retrieved financial event information through numerical indicators and graphical visualizations.
The first visualization compares earnings and IPO event distributions. It provides an overview of the composition of the retrieved financial events.
The second visualization presents the distribution of trading priorities, allowing analysts to examine how many events fall into HIGH PRIORITY, WATCHLIST, and LOW PRIORITY categories.
The third visualization displays the chronological distribution of events.
Together, these charts provide a concise overview of upcoming financial catalysts and their relative analytical priorities.
4.6. Data Export and Further Analysis
The final processing stage exports two CSV files.
File | Description |
|---|---|
| Complete normalized financial event dataset, including scoring and priority classification. |
| Ranked event dataset organized by attention score and event date. |
The complete event dataset can be used for further statistical analysis, while the watchlist provides a more focused dataset for monitoring prioritized financial catalysts.
Both files can also be integrated into other Python-based financial analysis systems or reporting dashboards.
4.7. Limitations and Future Improvements
Several limitations should be considered when interpreting the analytical results.
First, event importance is determined using predefined weights. Earnings events receive 3 points and IPO events receive 2 points. These weights are not derived from historical market impact measurements.
Second, temporal proximity is the primary additional scoring factor. The system does not evaluate actual price reactions, trading volume, market capitalization, or historical volatility surrounding previous announcements.
Third, IPO events cannot achieve HIGH PRIORITY under the current scoring configuration. Their maximum attention score is 5, whereas the HIGH PRIORITY threshold is 6.
Fourth, the current framework does not evaluate the direction of market impact. A HIGH PRIORITY event does not automatically indicate a bullish or bearish trading opportunity.
Fifth, the system does not implement historical backtesting. Therefore, the relationship between attention scores and subsequent stock price movements has not been statistically established.
Sixth, the data extraction process depends on the API response structure. If the API returns an unexpected structure or does not provide recognizable event date fields, the normalization process may require adjustment. An empty event dataset also requires additional handling before dashboard generation.
Future improvements could include:
Historical event impact analysis.
Pre-announcement and post-announcement stock price comparisons.
Event-driven volatility measurements.
Dynamic event weighting.
Market capitalization and trading volume integration.
Earnings surprise analysis.
IPO performance tracking.
Historical backtesting of event-based strategies.
Automated notifications for upcoming HIGH PRIORITY events.
These improvements could transform the current implementation into a more comprehensive event-driven financial market intelligence system.
5. Conclusion
Market Event Trading Analyzer demonstrates how Python and the MarketFlow All-in-One Market Finance API can be integrated into an automated financial event monitoring and trading catalyst analysis framework.
The system retrieves earnings announcements and IPO information within a dynamically configured 30-day analysis period.
The retrieved datasets are processed through JSON extraction, data normalization, event classification, and chronological sorting to produce a unified financial event dataset.
The analytical engine subsequently combines predefined event weights with temporal proximity scores to calculate attention scores and classify events into HIGH PRIORITY, WATCHLIST, and LOW PRIORITY categories.
The framework also generates a market event dashboard containing event distribution charts, priority classifications, and chronological event visualizations.
Finally, the system exports the complete analytical dataset and ranked trading catalyst watchlist into CSV files for further research and financial analysis.
Overall, the implementation provides a practical foundation for automated earnings and IPO event monitoring.
However, its scoring mechanism should be interpreted as a rule-based event prioritization method rather than a validated stock price prediction model. Further development involving historical market impact analysis, dynamic weighting, and backtesting would be necessary to evaluate its effectiveness as an event-driven trading strategy.