Stock market analysis requires a combination of market activity evaluation, risk assessment, and investor behavior analysis to identify potential investment opportunities. Relying only on price movement may provide limited insight because stock performance is also influenced by market participant activity, risk-reward conditions, and insider transaction information.
This project develops an IDX Stock Analysis Engine using Indonesia Stock Exchange API data. The system integrates three important analytical components:
Bandar distribution analysis
Risk-reward evaluation
Insider screening analysis
The objective of this system is to transform raw IDX API responses into a structured investment insight report. The engine evaluates market activity signals, identifies potential accumulation or distribution patterns, analyzes available risk-reward information, and incorporates insider data as additional sentiment validation.
The system is implemented using Python with API integration, Pandas for data processing, Matplotlib for visualization, and an automated scoring mechanism to generate investment recommendations. The project uses BBCA as the analyzed stock example.
he first stage prepares the analysis environment and configures the IDX RapidAPI connection. The system imports required libraries, defines API authentication headers, and creates reusable API request functions.
The API functions are designed to retrieve three main datasets:
Bandar distribution data
Risk reward data
Insider screening data
The second stage collects stock analysis data by defining the stock symbol and calling each API endpoint. In this project, the system analyzes BBCA using a seven-day observation period for bandar distribution and risk-reward evaluation. Insider screening is performed using multiple stock symbols including BBCA, BUMI, and ADRO.
The collected data is displayed as structured DataFrames to simplify further processing and analysis.
Cell 1 — Library and API Configuration
import requests
import pandas as pd
import matplotlib.pyplot as plt
import json


API_HOST = "indonesia-stock-exchange-idx.p.rapidapi.com"


API_KEY = "YOUR_API_KEY"


headers = {
    "Content-Type": "application/json",
    "x-rapidapi-host": API_HOST,
    "x-rapidapi-key": API_KEY
}


print("API Configuration Ready")
This cell establishes the API connection and prepares the environment for retrieving stock market information.
Cell 2 — API Request Function
def get_api(endpoint):

    url = f"https://{API_HOST}{endpoint}"


    response = requests.get(
        url,
        headers=headers
    )


    if response.status_code == 200:
        return response.json()

    else:
        print("Error:", response.status_code)
        return None


def get_bandar_distribution(symbol, days=7):

    endpoint = (
        f"/api/analysis/bandar/distribution/"
        f"{symbol}?days={days}"
    )

    return get_api(endpoint)


def get_risk_reward(
    symbol,
    days=7,
    risk_percent=1,
    portfolio_size=10000000
):

    endpoint = (
        f"/api/analysis/retail/risk-reward/"
        f"{symbol}"
        f"?days={days}"
        f"&risk_percent={risk_percent}"
        f"&portfolio_size={portfolio_size}"
    )

    return get_api(endpoint)
This function provides a reusable API request framework for collecting different stock analysis datasets.
The third stage performs bandar distribution analysis. The system converts API responses into DataFrames and evaluates numerical indicators related to market activity. Visualization is created when numerical data is available to observe bandar activity trends over the analysis period.
The system also processes risk-reward information and insider screening results as supporting investment indicators.
Cell 3 — Data Collection and Analysis
symbol = "BBCA"


bandar_data = get_bandar_distribution(
    symbol,
    days=7
)


risk_data = get_risk_reward(
    symbol,
    days=7,
    risk_percent=1,
    portfolio_size=10000000
)


insider_data = get_insider_screening(
    "BBCA,BUMI,ADRO"
)


bandar_df = pd.DataFrame(bandar_data)

risk_df = pd.DataFrame(risk_data)

insider_df = pd.DataFrame(insider_data)
This stage gathers all required analytical inputs before generating the final investment insight.
The fourth stage develops the automated investment insight engine. The system starts with a baseline score and adjusts the score based on three analytical factors:
Bandar activity signal
Risk-reward availability
Insider data availability
The bandar analysis searches for keywords indicating accumulation, buying pressure, distribution, or selling activity. Positive accumulation indicators increase the score, while distribution signals reduce the score.
Risk-reward availability contributes additional scoring because it provides information for evaluating potential entry and risk boundaries.
Insider screening data is used as an additional sentiment validation factor.
Cell 4 — Automated Scoring Engine
report = []

score = 50


bandar_text = bandar_df.to_string().lower()


if any(word in bandar_text for word in
       ["accumulation", "buy", "net buy"]):

    score += 20

    report.append(
        "Bandar activity indicates accumulation."
    )


elif any(word in bandar_text for word in
         ["distribution", "sell", "net sell"]):

    score -= 20

    report.append(
        "Bandar distribution pressure detected."
    )


else:

    report.append(
        "No dominant bandar signal detected."
    )


risk_text = risk_df.to_string().lower()


if "reward" in risk_text:

    score += 15

    report.append(
        "Risk-reward data available for evaluation."
    )


if len(insider_df)>0:

    score += 10

    report.append(
        "Insider data available for sentiment validation."
    )
This engine converts multiple market indicators into a single analytical score.
The final stage classifies the investment condition based on the calculated score. The system generates four possible recommendations:
Strong Buy
Accumulation / Watch
Neutral
High Risk
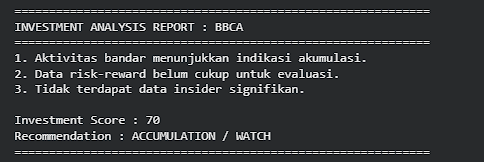
The final report displays the stock code, analytical findings, investment score, and recommendation.
Cell 5 — Final Investment Insight Report
if score >= 80:

    recommendation = "STRONG BUY"


elif score >=60:

    recommendation = "ACCUMULATION / WATCH"


elif score >=40:

    recommendation = "NEUTRAL"


else:

    recommendation = "HIGH RISK"


print("="*60)

print(
    f"INVESTMENT ANALYSIS REPORT : {symbol}"
)


print("="*60)


for i,item in enumerate(report,1):

    print(
        f"{i}. {item}"
    )


print("\nInvestment Score :",score)

print(
    "Recommendation :",
    recommendation
)

print("="*60)
This final output provides an automated interpretation of stock conditions based on the integrated analysis framework.
Conclusion
This project successfully developed an IDX Stock Analysis Engine using IDX API data integration to evaluate stock conditions through bandar distribution analysis, risk-reward evaluation, and insider screening.
The system provides a structured approach by combining market participant activity, risk evaluation, and insider information into an automated investment scoring model. The bandar module identifies potential accumulation or distribution signals, while risk-reward analysis provides additional support for evaluating potential trading decisions.
The automated scoring engine simplifies complex market information into an investment insight report with categorized recommendations. This approach allows users to perform preliminary stock screening using multiple indicators rather than relying on a single market variable.
However, this system should be considered as an analytical support tool and not as an automatic buy or sell recommendation. Further validation using financial statements, valuation analysis, technical indicators, market trends, and broader economic conditions is still required.
Overall, the IDX Stock Analysis Engine demonstrates how API-based financial analytics can support systematic stock evaluation and data-driven investment research.