
Stock market analysis requires multiple perspectives to evaluate investment opportunities. Market participants need to understand not only stock price movement but also institutional activity, broker behavior, corporate actions, and potential market risks.
This project develops an IDX Smart Money Analyzer using Indonesia Stock Exchange API data to identify market signals through smart money indicators. The system integrates several analytical components:
Bandar accumulation analysis
Broker flow analysis
Right issue risk detection
Trader intelligence scoring
Automated stock analysis dashboard
The objective of this system is to transform raw IDX API data into a structured investment intelligence report. The analyzer evaluates accumulation strength, market participant behavior, corporate action risk, and generates a final trading signal based on a scoring mechanism.
The system is implemented using Python with API integration, Pandas for data processing, NumPy for calculation, and Matplotlib for generating analytical visualization reports.
The first stage prepares the analytical environment by importing required libraries and configuring IDX RapidAPI authentication. The system defines the API host, API key, request headers, and stock symbol used for analysis.
Cell 1 — Library and API Configuration
import requests
import pandas as pd
import numpy as np
from datetime import datetime
import matplotlib.pyplot as plt


RAPIDAPI_KEY = "YOUR_API_KEY"


HOST = "indonesia-stock-exchange-idx.p.rapidapi.com"


headers = {
    "Content-Type": "application/json",
    "x-rapidapi-host": HOST,
    "x-rapidapi-key": RAPIDAPI_KEY
}


print("IDX Analyzer Ready")
This stage establishes the API connection and prepares the environment for collecting stock market intelligence data.
The second stage defines the API request system and data collection functions. The system applies retry handling to manage API limitations and improves data retrieval reliability.
Three main data sources are collected:
Bandar accumulation data
Broker summary data
Right issue calendar data
Cell 2 — API Function and Data Collection
def get_api(url, retry=3):

    for attempt in range(retry):

        response = requests.get(
            url,
            headers=headers
        )

        if response.status_code == 200:

            return response.json()

        elif response.status_code == 429:

            time.sleep(5)

        else:

            return None

    return None


def get_accumulation(symbol):

    url = (
        f"https://{HOST}/api/analysis/bandar/"
        f"accumulation/{symbol}"
    )

    return get_api(url)


def get_broker(symbol):

    url = (
        f"https://{HOST}/api/market-detector/"
        f"broker-summary/{symbol}"
    )

    return get_api(url)
This module creates reusable API functions to retrieve market activity information required for smart money analysis.
The third stage processes the collected API responses into structured datasets. Each data source is converted into Pandas DataFrame format for easier analysis.
The system processes:
Bandar accumulation information
Broker activity information
Right issue information
Cell 3 — Data Processing and Extraction
acc_df = pd.DataFrame(
    [acc_data["data"]]
)


broker_df = pd.DataFrame(
    [broker_data["data"]]
)


if "data" in ri_data:

    right_list = (
        ri_data["data"]
        .get(
            "rightissue",
            []
        )
    )

    ri_df = pd.DataFrame(
        right_list
    )

else:

    ri_df = pd.DataFrame()
This process converts raw API responses into analytical datasets that can be evaluated by the scoring engine.
The fourth stage develops the Trader Intelligence Scoring Engine. The system begins with a baseline score and adjusts the score based on several factors.
The scoring model evaluates:
Bandar accumulation status
Accumulation strength
Confidence level
Broker flow condition
Right issue risk
The system identifies positive signals such as accumulation and buying activity, while reducing scores when distribution pressure or corporate action risks are detected.
Broker analysis evaluates transaction behavior by detecting keywords related to:
Buy
Accumulation
Net buy
Foreign activity
Sell
Distribution
Right issue analysis is used as a risk adjustment factor. If the analyzed stock appears in the right issue dataset, the system reduces the final score.
Cell 4 — Trader Intelligence Scoring Engine
score = 0

insight = []


if bandar_status == "ACCUMULATION":

    score +=30

    insight.append(
        "✓ Bandar menunjukkan akumulasi"
    )


elif bandar_status == "DISTRIBUTION":

    score -=20

    insight.append(
        "✕ Bandar melakukan distribusi"
    )


if buy_signal > sell_signal:

    score +=20

    insight.append(
        "✓ Broker flow cenderung positif"
    )


else:

    score -=10


if symbol.upper() in company_text:

    score -=15

    right_issue_status="YES"


else:

    score +=15

    right_issue_status="NO"
This scoring engine converts multiple market indicators into a simplified trader intelligence signal.
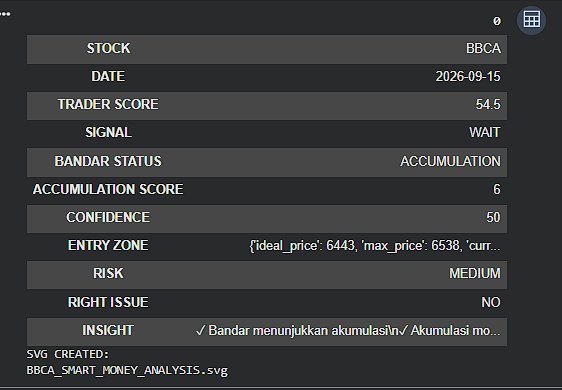
The final stage generates the investment report and visualization dashboard. The system calculates the final trader score, determines the market signal classification, and generates an SVG dashboard containing:
Stock symbol
Trader score
Signal
Bandar status
Accumulation score
Confidence level
Entry zone
Risk level
Analytical insight
The signal classification is divided into:
Strong Buy
Accumulation Watch
Wait
Avoid
based on the final score value.
Cell 5 — Final Trader Report and Dashboard
final_report = {

    "STOCK":
    symbol,

    "DATE":
    datetime.now()
    .strftime("%Y-%m-%d"),

    "TRADER SCORE":
    score,

    "SIGNAL":
    signal,

    "BANDAR STATUS":
    acc_df.loc[0,"status"],

    "ACCUMULATION SCORE":
    acc_df.loc[0,"accumulation_score"],

    "CONFIDENCE":
    acc_df.loc[0,"confidence"],

    "ENTRY ZONE":
    entry_zone,

    "RISK":
    risk_level,

    "RIGHT ISSUE":
    right_issue_status

}


report_df = pd.DataFrame(
    [final_report]
)


display(report_df.T)
This final dashboard provides a compact overview of stock conditions based on smart money indicators and automated scoring.
Conclusion
This project successfully developed an IDX Smart Money Analyzer using IDX API integration to evaluate stock conditions through market participant behavior and corporate risk indicators.
The system combines bandar accumulation analysis, broker flow evaluation, and right issue risk detection into a single trader intelligence scoring framework. The scoring engine transforms multiple market signals into a simplified classification that helps identify potential accumulation opportunities, neutral conditions, or higher-risk situations.
The automated dashboard provides structured information including trader score, market signal, accumulation status, confidence level, entry zone, and risk assessment. This approach improves the efficiency of processing market data and supports systematic stock screening.
However, the system should be considered as an analytical support tool rather than a direct investment recommendation. Additional evaluation using financial fundamentals, valuation analysis, technical confirmation, and broader market conditions remains necessary before making investment decisions.
Overall, the IDX Smart Money Analyzer demonstrates how API-based financial analytics and automated scoring models can support data-driven stock market research and intelligent investment screening.