
Historical market behavior and real-time transaction activity provide two different but complementary perspectives for analyzing stock performance. Seasonality data helps investors understand recurring historical patterns over multiple years, while running trade data reveals the latest transactions occurring during an active trading session.
Instead of manually collecting information from multiple sources, both datasets can be retrieved automatically through the Indonesia Stock Exchange API available on RapidAPI.
In this project, we will build a Python dashboard using two API endpoints:
getSeasonality
getRunningTrade
The notebook consists of five cells. The first two cells configure the API connection and retrieve both datasets. The remaining cells normalize nested JSON responses, convert them into pandas DataFrames, inspect the available fields, and generate a final dashboard summarizing historical seasonality together with running trade activity.
For security purposes, the RapidAPI key should be replaced with YOUR_RAPIDAPI_KEY. Apart from that replacement, every notebook cell should remain identical to the original implementation.
Cell 1 — Import Libraries and Configure the API
The first cell imports the required Python libraries and prepares the API configuration used throughout the notebook.
It defines the RapidAPI host, authentication headers, display settings, and prints a simple confirmation message before sending any API requests.
# ==========================================================
# CELL 1 - IMPORT LIBRARY & KONFIGURASI
# ==========================================================

import requests
import pandas as pd
import time
from datetime import datetime

API_KEY = "YOUR_RAPIDAPI_KEY"

BASE_URL = "https://indonesia-stock-exchange-idx.p.rapidapi.com"

HEADERS = {
    "x-rapidapi-key": API_KEY,
    "x-rapidapi-host": "indonesia-stock-exchange-idx.p.rapidapi.com",
    "Content-Type": "application/json"
}

pd.set_option("display.max_columns", None)
pd.set_option("display.width", 200)
pd.set_option("display.max_colwidth", 100)

print("Konfigurasi selesai.")
The notebook imports four primary libraries:
requests performs HTTP requests to the RapidAPI endpoints.
pandas converts normalized JSON responses into structured DataFrames.
time introduces a delay between API requests to reduce the possibility of rate limiting.
datetime records the processing timestamp displayed in the final dashboard.
In addition, several pandas display options are configured to ensure that DataFrames are rendered clearly inside Google Colab without truncating columns or long values.
The API configuration is stored inside the HEADERS dictionary, allowing every request to reuse the same authentication settings throughout the notebook.
Cell 2 — Request Seasonality and Running Trade Data
The second cell defines a reusable request function before retrieving data from both API endpoints.
# ==========================================================
# CELL 2 - REQUEST API
# ==========================================================

def request_api(endpoint):

    url = BASE_URL + endpoint

    print("="*100)
    print("Endpoint :", endpoint)

    try:

        response = requests.get(
            url,
            headers=HEADERS,
            timeout=30
        )

        print("Status   :", response.status_code)

        if response.status_code == 200:
            return response.json()

        print(response.text)
        return None

    except Exception as e:
        print("ERROR :", e)
        return None


seasonality = request_api(
    "/api/emiten/BBCA/seasonality?year=2026&backYear=5"
)

print("\nMenunggu 5 detik...\n")
time.sleep(5)

running_trade = request_api(
    "/api/emiten/running-trade?sort=ASC&actionType=RUNNING_TRADE_ACTION_TYPE_ALL&date=2026-02-11&marketBoard=BOARD_TYPE_REGULAR&limit=50&orderBy=RUNNING_TRADE_ORDER_BY_TIME&symbols=BBCA"
)
The notebook uses a reusable helper named request_api() to communicate with the RapidAPI service.
Rather than repeating the same request logic for every endpoint, this function centralizes the entire HTTP request process, including:
Building the complete request URL
Sending authenticated GET requests
Printing the endpoint being accessed
Displaying the returned HTTP status code
Returning the parsed JSON response when the request succeeds
Printing error messages whenever the request fails
The first request retrieves BBCA Seasonality data for the year 2026 using the previous five years as historical reference.
After the Seasonality request completes, the notebook intentionally waits for five seconds before calling the second endpoint. This delay helps reduce the possibility of triggering RapidAPI rate limits.
The second request retrieves Running Trade data for BBCA on 11 February 2026, ordered by transaction time and limited to the first 50 records from the Regular Board.
Finally, the responses are stored inside:
seasonalityrunning_trade
These two objects will be normalized and converted into pandas DataFrames in the following notebook cells.
Cell 3 — Normalize API Responses
The third cell extracts the relevant records from each API response and converts them into pandas DataFrames.
# ==========================================================
# CELL 3 - NORMALISASI DATA
# ==========================================================

seasonality_rows = []
running_rows = []

# ----------------------------------------------------------
# Seasonality
# ----------------------------------------------------------

if isinstance(seasonality, dict):

    data = seasonality.get("data")

    if isinstance(data, list):

        for item in data:
            if isinstance(item, dict):
                seasonality_rows.append(item)

    elif isinstance(data, dict):

        for k, v in data.items():

            if isinstance(v, list):

                for row in v:
                    if isinstance(row, dict):
                        row["group"] = k
                        seasonality_rows.append(row)

            elif isinstance(v, dict):
                v["group"] = k
                seasonality_rows.append(v)

# ----------------------------------------------------------
# Running Trade
# ----------------------------------------------------------

if isinstance(running_trade, dict):

    data = running_trade.get("data")

    if isinstance(data, list):

        for item in data:
            if isinstance(item, dict):
                running_rows.append(item)

    elif isinstance(data, dict):

        for k, v in data.items():

            if isinstance(v, list):

                for row in v:
                    if isinstance(row, dict):
                        running_rows.append(row)

# ----------------------------------------------------------

df_seasonality = pd.DataFrame(seasonality_rows)
df_running = pd.DataFrame(running_rows)

print("="*100)
print("HASIL NORMALISASI")
print("="*100)

print("Seasonality :", len(df_seasonality))
print("Running     :", len(df_running))

print("\n")

print("="*100)
print("DEBUG RESPONSE")
print("="*100)

print("Seasonality Type :", type(seasonality).__name__)
print("Running Type     :", type(running_trade).__name__)

if isinstance(seasonality, dict):
    print("Seasonality Keys :", list(seasonality.keys()))

if isinstance(running_trade, dict):
    print("Running Keys     :", list(running_trade.keys()))

print("\n")

print("="*100)
print("PREVIEW SEASONALITY")
print("="*100)

if len(df_seasonality):
    print(df_seasonality.head())
else:
    print("Tidak ada data.")

print("\n")

print("="*100)
print("PREVIEW RUNNING TRADE")
print("="*100)

if len(df_running):
    print(df_running.head())
else:
    print("Tidak ada data.")
Processing Seasonality Data
The notebook begins by creating an empty list called:
seasonality_rowsIt then inspects the seasonality response returned by the API.
Depending on the response structure, the notebook can process either:
A list of records
A dictionary containing nested lists
A dictionary containing nested objects
Whenever nested groups are detected, an additional group field is added before the record is appended to the normalized dataset. This ensures that important grouping information is preserved during the normalization process.
Processing Running Trade Data
The notebook performs a similar normalization process for the Running Trade endpoint.
An empty list named:
running_rowsstores all extracted transaction records.
The notebook searches the data section of the API response and appends every dictionary object into the normalized list.
Unlike the Seasonality endpoint, the Running Trade response primarily consists of transaction records, making the extraction process more straightforward.
Creating DataFrames
Once both record collections have been completed, the notebook converts them into pandas DataFrames using:
pd.DataFrame()The resulting DataFrames are stored as:
df_seasonalitydf_running
The notebook then prints:
Total normalized Seasonality records
Total normalized Running Trade records
Response type
Available response keys
Preview of both DataFrames
These diagnostics help verify that the API responses have been processed successfully before continuing to the analysis stage.
Cell 4 — Analyze the Processed Data
After the normalization process is complete, the notebook analyzes both DataFrames and displays their structure.
# ==========================================================
# CELL 4 - ANALISIS DATA
# ==========================================================

print("="*100)
print("ANALISIS DATA")
print("="*100)

# ----------------------------------------------------------
# Seasonality
# ----------------------------------------------------------

print("\nSEASONALITY")
print("-"*80)

if len(df_seasonality):

    print("Jumlah Data :", len(df_seasonality))
    print("Kolom :")
    print(list(df_seasonality.columns))

else:
    print("Tidak ada data.")

# ----------------------------------------------------------
# Running Trade
# ----------------------------------------------------------

print("\nRUNNING TRADE")
print("-"*80)

if len(df_running):

    print("Jumlah Data :", len(df_running))

    print("\nKolom :")
    print(list(df_running.columns))

    print("\n5 Data Pertama")

    print(df_running.head())

else:
    print("Tidak ada data.")
Seasonality Analysis
The first section focuses on the normalized Seasonality dataset.
When records are available, the notebook displays:
Total number of records
Available DataFrame columns
These details allow users to quickly understand the information returned by the Seasonality endpoint before performing additional analysis.
Running Trade Analysis
The second section analyzes the Running Trade DataFrame.
For this dataset, the notebook prints:
Total number of transaction records
Available DataFrame columns
Preview of the first five transactions
Displaying the first few rows provides a quick validation that the running trade records have been normalized correctly and are ready for further processing.
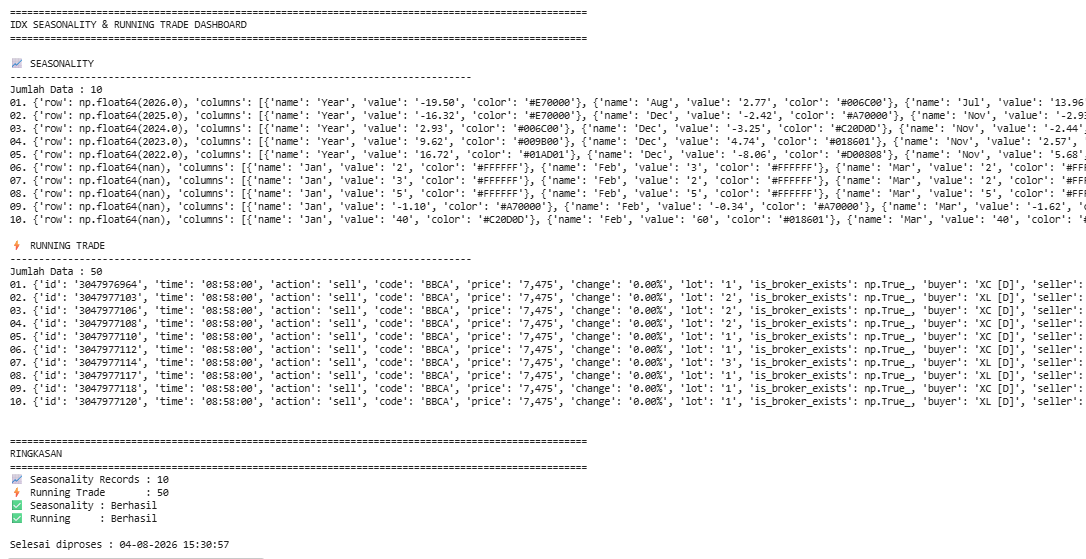
Cell 5 — Seasonality & Running Trade Dashboard
The last cell combines both datasets into a single dashboard and prints a compact summary of the execution results.
# ==========================================================
# CELL 5 - DASHBOARD
# ==========================================================

print("="*100)
print("IDX SEASONALITY & RUNNING TRADE DASHBOARD")
print("="*100)

# ----------------------------------------------------------
# Seasonality
# ----------------------------------------------------------

print("\n📈 SEASONALITY")
print("-"*80)

print("Jumlah Data :", len(df_seasonality))

if len(df_seasonality):

    tampil = min(10, len(df_seasonality))

    for i in range(tampil):

        row = df_seasonality.iloc[i]

        print(f"{i+1:02d}. {dict(row)}")

else:

    print("Tidak ada data.")

# ----------------------------------------------------------
# Running Trade
# ----------------------------------------------------------

print("\n⚡ RUNNING TRADE")
print("-"*80)

print("Jumlah Data :", len(df_running))

if len(df_running):

    tampil = min(10, len(df_running))

    for i in range(tampil):

        row = df_running.iloc[i]

        print(f"{i+1:02d}. {dict(row)}")

else:

    print("Tidak ada data.")

print("\n")

print("="*100)
print("RINGKASAN")
print("="*100)

print("📈 Seasonality Records :", len(df_seasonality))
print("⚡ Running Trade       :", len(df_running))

print("✅ Seasonality :", "Berhasil" if len(df_seasonality) else "Tidak ada data")
print("✅ Running     :", "Berhasil" if len(df_running) else "Tidak ada data")

print("\nSelesai diproses :", datetime.now().strftime("%d-%m-%Y %H:%M:%S"))
Seasonality Dashboard
The dashboard begins by presenting the normalized Seasonality dataset.
It reports the total number of available records before displaying up to the first ten entries.
Each record is printed as a dictionary, allowing users to inspect every available field exactly as it appears after the normalization process.
If no Seasonality records are available, the notebook prints a clear notification instead of producing an exception.
Running Trade Dashboard
The second section summarizes the Running Trade dataset.
Similar to the Seasonality section, the notebook first reports the total number of transaction records and then displays up to the first ten normalized transactions.
Displaying only a limited number of records keeps the notebook output concise while still providing enough information to validate that the API response has been processed correctly.
Final Summary
The notebook concludes with a compact execution summary that includes:
Total Seasonality records
Total Running Trade records
Seasonality processing status
Running Trade processing status
Processing completion timestamp
This final section provides a quick overview of the entire workflow, allowing users to confirm that both endpoints returned usable data and that the notebook completed successfully.
Final Result
After executing all five notebook cells, this project is capable of:
Retrieving historical Seasonality data for BBCA.
Retrieving Running Trade transactions for a selected trading session.
Handling API request failures and unexpected responses.
Normalizing different JSON response structures automatically.
Converting API responses into pandas DataFrames.
Displaying structured previews for both datasets.
Analyzing available DataFrame columns before further processing.
Building a concise dashboard summarizing Seasonality and Running Trade data.
Producing a final execution report with processing status and timestamp.
Conclusion
This project demonstrates how to build an IDX Seasonality and Running Trade Dashboard using Python and the Indonesia Stock Exchange API available through RapidAPI.
By combining historical seasonality analysis with real-time running trade information, the notebook provides two complementary perspectives on market activity. Historical seasonality helps identify recurring performance patterns across multiple years, while running trade data offers insight into transaction flow during a specific trading session.
The notebook follows a complete workflow that includes API communication, response validation, JSON normalization, DataFrame generation, dataset inspection, and dashboard creation. Its straightforward structure also makes it easy to expand with additional IDX endpoints, making it a practical foundation for developing more advanced stock analysis dashboards, automated market monitoring systems, or custom investment research tools.