
Understanding market activity requires more than simply observing stock price movements. Investors often monitor broker transactions and smart money activity because both can provide additional insights into market behavior and potential institutional interest.
Broker transaction data can help identify which brokers are the most active based on trading value, while Smart Money Flow analysis can provide an overview of capital movements and institutional activity in a particular stock. Combining both datasets into a single dashboard can help users monitor market activity more efficiently.
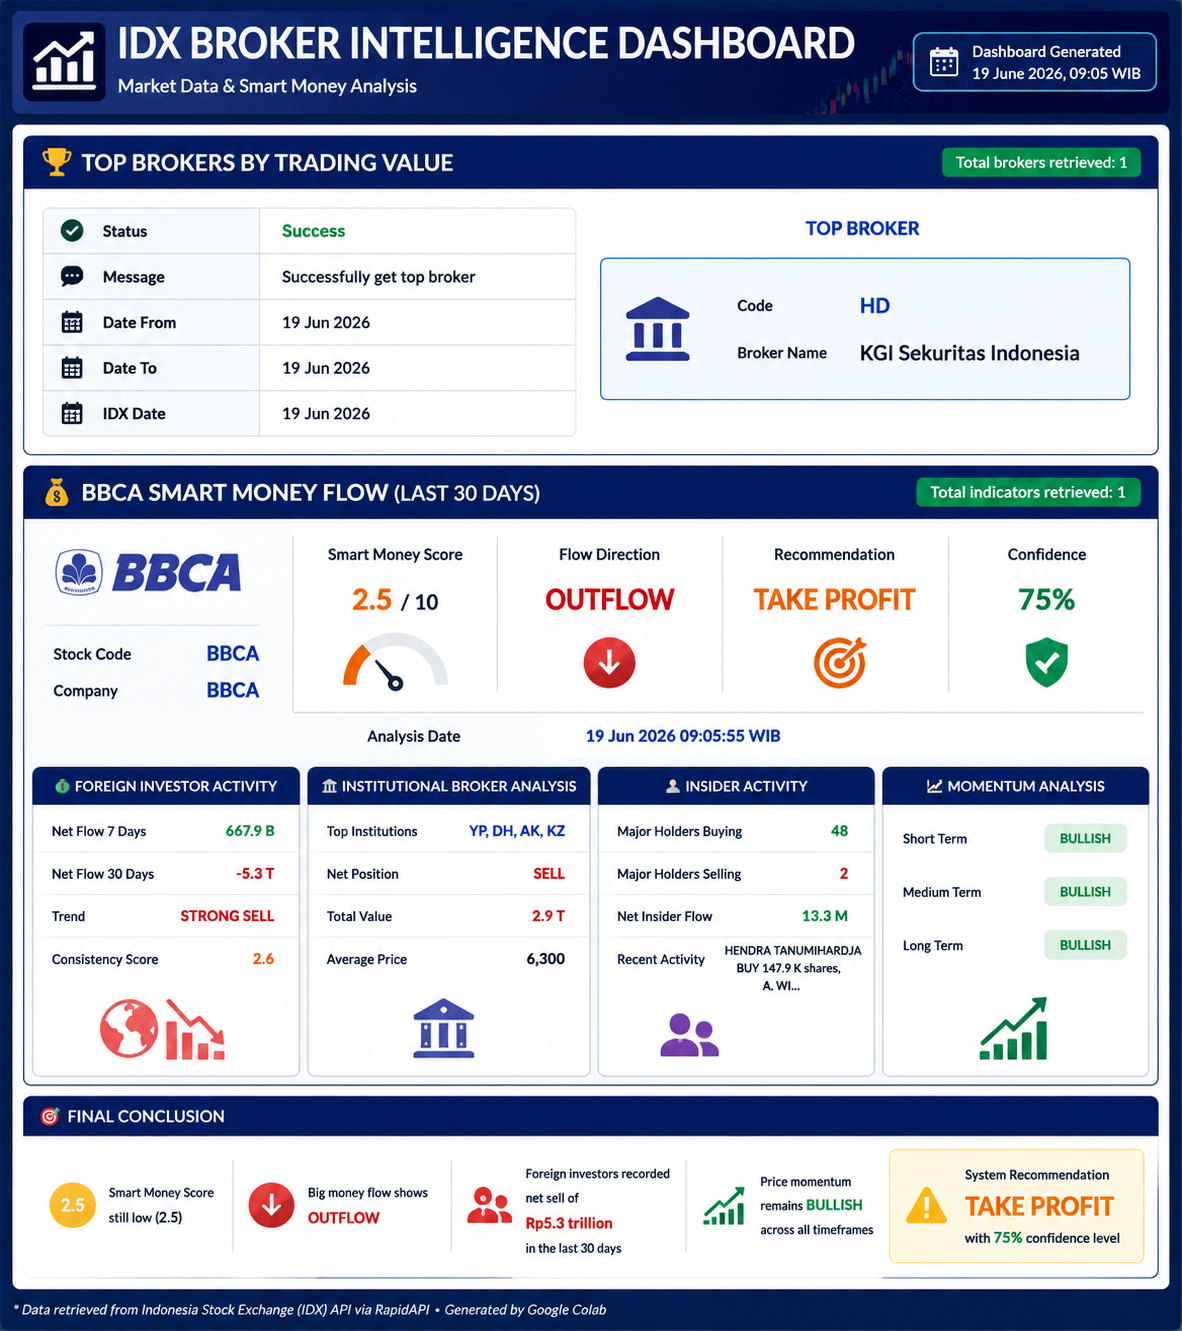
In this project, we build an IDX Broker Intelligence Dashboard using Python and the Indonesia Stock Exchange API. The notebook retrieves Top Brokers data and BBCA Smart Money Flow data, processes the responses, and displays the information through a structured dashboard interface.
CELL 1 — Import Required Libraries
import requests
import pandas as pd
import time
from IPython.display import display, Markdown

pd.set_option("display.max_columns", None)
pd.set_option("display.width", 1000)
Explanation
The project begins by importing the required libraries.
The requests library is used to communicate with the IDX API, while pandas is used to process and display structured data. The time library is used to create delays between API requests, and display together with Markdown is used to create a cleaner dashboard presentation in Google Colab.
The notebook also configures pandas display settings so all columns can be displayed more clearly.
CELL 2 — Configure API Connection
BASE_URL = "https://indonesia-stock-exchange-idx.p.rapidapi.com"

HEADERS = {
    "Content-Type": "application/json",
    "x-rapidapi-host": "indonesia-stock-exchange-idx.p.rapidapi.com",
    "x-rapidapi-key": "your_api_Key"
}
Explanation
Cell 2 contains the API configuration used throughout the notebook.
The BASE_URL variable stores the IDX API endpoint, while HEADERS contains the request configuration required for API communication. These settings are reused whenever the notebook sends requests to retrieve Top Brokers and Smart Money Flow data.
CELL 3 — Create API Helper Functions
def fetch_api(endpoint, retries=3, delay=5):
    url = BASE_URL + endpoint

    for attempt in range(retries):
        try:
            response = requests.get(
                url,
                headers=HEADERS,
                timeout=30
            )

            if response.status_code == 200:
                return response.json()

            elif response.status_code == 429:
                print(f"Rate limit reached. Waiting {delay} seconds...")
                time.sleep(delay)

            else:
                print(f"Request failed: {response.status_code}")
                print(response.text)
                return None

        except Exception as e:
            print("Error:", e)
            time.sleep(delay)

    return None


def extract_list(data):
    if data is None:
        return []

    if isinstance(data, list):
        return data

    if isinstance(data, dict):
        for key in [
            "data",
            "result",
            "results",
            "items",
            "brokers",
            "smartMoney",
            "smart_money"
        ]:
            if key in data and isinstance(data[key], list):
                return data[key]

        return [data]

    return []
Explanation
Cell 3 creates helper functions used throughout the project.
The fetch_api() function is responsible for retrieving data from the IDX API. The function includes retry handling and basic rate-limit management so the notebook can attempt another request if a temporary issue occurs.
The extract_list() function is used to extract list-based data from different API response structures. This allows the notebook to process Top Brokers and Smart Money Flow data more consistently.
CELL 4 — Retrieve IDX Data
display(Markdown("## 📥 Fetching Data from IDX API"))

top_brokers_raw = fetch_api(
    "/api/market-detector/top-broker?marketType=MARKET_TYPE_ALL&period=TB_PERIOD_LAST_1_DAY&order=ORDER_BY_ASC&sort=TB_SORT_BY_TOTAL_VALUE"
)

time.sleep(5)

smart_money_raw = fetch_api(
    "/api/analysis/bandar/smart-money/BBCA?days=30"
)

display(Markdown("✅ Data retrieval completed"))
Explanation
Cell 4 retrieves the required datasets from the IDX API.
The notebook first requests Top Brokers data using the market detector endpoint. After a five-second delay, the notebook retrieves BBCA Smart Money Flow data for the last 30 days.
Once both requests have been completed, a confirmation message is displayed indicating that the data retrieval process has finished successfully.
CELL 5 — Build Broker & Smart Money Dashboard
display(Markdown("# 📊 IDX Broker Intelligence Dashboard"))

# =====================================================
# TOP BROKERS
# =====================================================

display(Markdown("## 🏆 Top Brokers by Trading Value"))

brokers = extract_list(top_brokers_raw)

if brokers:
    try:
        df_brokers = pd.json_normalize(brokers)

        numeric_cols = [
            "total_value",
            "buy_value",
            "sell_value",
            "net_value"
        ]

        for col in numeric_cols:
            if col in df_brokers.columns:
                df_brokers[col] = pd.to_numeric(
                    df_brokers[col],
                    errors="coerce"
                )

        sort_col = None

        for col in [
            "total_value",
            "totalValue",
            "value"
        ]:
            if col in df_brokers.columns:
                sort_col = col
                break

        if sort_col:
            df_brokers = df_brokers.sort_values(
                by=sort_col,
                ascending=False
            ).head(20)

        display(
            Markdown(
                f"Total brokers retrieved: **{len(df_brokers)}**"
            )
        )

        display(df_brokers)

    except Exception as e:
        print("Failed to process Top Brokers:", e)

else:
    display(Markdown("No broker data available."))


# =====================================================
# SMART MONEY FLOW
# =====================================================

display(Markdown("---"))
display(Markdown("## 💰 BBCA Smart Money Flow (Last 30 Days)"))

try:
    if smart_money_raw:

        if isinstance(smart_money_raw, dict):

            summary = []

            for key, value in smart_money_raw.items():

                if isinstance(value, (int, float, str)):
                    summary.append({
                        "Metric": key,
                        "Value": value
                    })

            if summary:
                df_summary = pd.DataFrame(summary)

                display(
                    Markdown(
                        f"Total indicators retrieved: **{len(df_summary)}**"
                    )
                )

                display(df_summary)

            display(Markdown("### Raw Smart Money Data"))
            display(pd.json_normalize(smart_money_raw))

        else:
            display(pd.DataFrame(extract_list(smart_money_raw)))

    else:
        display(Markdown("No Smart Money data available."))

except Exception as e:
    print("Failed to process Smart Money Flow:", e)

display(Markdown("## ✅ Dashboard Successfully Generated"))
Explanation
Cell 5 builds the final IDX Broker Intelligence Dashboard.
The first section focuses on Top Brokers data. The notebook extracts broker information, converts numeric columns into numeric data types, sorts the brokers by trading value, and displays the top 20 brokers based on total trading value.
The second section focuses on BBCA Smart Money Flow data. The notebook creates a summary table from available indicators and displays the normalized Smart Money Flow dataset. This section allows users to review key Smart Money metrics together with the raw data structure.
After both sections are completed, the notebook displays a confirmation message indicating that the dashboard has been successfully generated.
Result:
Overall Workflow
Import required libraries.
Configure IDX API access.
Create helper functions for data retrieval and processing.
Retrieve Top Brokers data.
Retrieve BBCA Smart Money Flow data.
Process API responses into structured dataframes.
Display the information through the IDX Broker Intelligence Dashboard.
Why This Project Matters
Broker activity and Smart Money Flow information can provide additional context when analyzing market activity.
Top Brokers data highlights the most active brokers based on trading value, while Smart Money Flow data provides insights into capital movements and institutional activity.
Combining both datasets into a single dashboard creates a convenient monitoring tool for users who want to analyze broker participation and Smart Money indicators together.
Conclusion
This project demonstrates how to build an IDX Broker Intelligence Dashboard using Python and the Indonesia Stock Exchange API.
The notebook retrieves Top Brokers data and BBCA Smart Money Flow data, processes the responses into structured dataframes, and displays the information through a simple dashboard designed for market monitoring.