
Keeping track of corporate actions and identifying the most actively discussed stocks are two important activities for investors monitoring the Indonesian stock market. Tender Offer announcements provide information about companies undergoing acquisition-related activities, while Trending Stocks highlight securities receiving significant market attention.
Instead of checking multiple market sources manually, Python can automate this workflow using the Indonesia Stock Exchange API. By retrieving both datasets programmatically, investors and developers can organize the information into structured tables and generate concise market summaries.
In this tutorial, we build an IDX Tender Offer Calendar and Trending Stocks Dashboard using Python and the Indonesia Stock Exchange API. The notebook retrieves Tender Offer Calendar and Trending Stocks data, processes JSON responses into pandas DataFrames, displays market information, and concludes with a structured IDX Market Summary Dashboard.
The notebook consists of five sequential sections covering API configuration, data retrieval, DataFrame creation, dashboard analysis, and market summary generation.
What This Project Builds
This notebook builds a lightweight dashboard for monitoring Tender Offer Calendar information and Trending Stocks from the Indonesia Stock Exchange.
The completed workflow includes:
Tender Offer Calendar retrieval
Trending Stocks retrieval
RapidAPI integration
API error handling
JSON processing
pandas DataFrame conversion
Market dashboard
Market summary report
Rather than predicting stock movements, the notebook focuses on retrieving and organizing market information published by the Indonesia Stock Exchange API.
CELL 1 — Import & Configuration
import requests
import pandas as pd
from datetime import datetime

# ======================================================
# RAPID API CONFIG
# ======================================================

API_KEY = "YOUR_API_KEY"

BASE_URL = "https://indonesia-stock-exchange-idx.p.rapidapi.com"

headers = {
    "x-rapidapi-key": API_KEY,
    "x-rapidapi-host": "indonesia-stock-exchange-idx.p.rapidapi.com",
    "Content-Type": "application/json"
}
Note: Replace the original API key with
YOUR_API_KEYbefore publishing the notebook publicly.
Explanation
The notebook begins by importing the Python libraries required throughout the project.
The requests library is responsible for communicating with the Indonesia Stock Exchange API through RapidAPI. Every API request performed later in the notebook relies on this library to retrieve Tender Offer Calendar and Trending Stocks data.
The notebook also imports pandas, which converts the returned JSON responses into structured DataFrames. This allows market information to be displayed in a clean tabular format that is much easier to inspect than raw JSON.
Finally, the notebook imports datetime, which is used later when generating the final market summary dashboard.
The second part of the cell prepares the API configuration by defining the authentication key, the API base URL, and the HTTP request headers required for every API request.
This centralized configuration allows every subsequent cell to reuse the same API settings without repeating authentication details.
CELL 2 — Request API
def call_api(endpoint):

    url = BASE_URL + endpoint

    print(f"\nEndpoint : {endpoint}")

    try:

        response = requests.get(
            url,
            headers=headers,
            timeout=30
        )

        print("Status :", response.status_code)

        if response.status_code == 200:
            return response.json()

        elif response.status_code == 403:
            print("⚠️ API tidak dapat diakses (403)")
            return None

        elif response.status_code == 429:
            print("⚠️ Rate limit tercapai")
            return None

        else:
            print(response.text)
            return None

    except Exception as e:
        print("Error :", e)
        return None


tender = call_api("/api/calendar/tender-offer")

trending = call_api("/api/main/trending")

print("\n==============================")
print("Tender :", "OK" if tender else "FAILED")
print("Trending :", "OK" if trending else "FAILED")
Explanation
The second section retrieves market data from two Indonesia Stock Exchange API endpoints.
To simplify communication with the API, the notebook defines a reusable helper function named call_api(). Rather than duplicating request logic for every endpoint, this function centralizes the request process into a single reusable component.
Each request begins by combining the predefined BASE_URL with the selected endpoint before sending an authenticated HTTP GET request.
During execution, the notebook prints the requested endpoint together with the returned HTTP status code. These messages provide immediate feedback and make it easier to identify API-related issues.
If the API responds successfully with HTTP 200, the function returns the JSON response directly. The notebook also handles common API errors such as HTTP 403, which indicates that the endpoint cannot be accessed, and HTTP 429, which indicates that the request limit has been exceeded. In both situations, the function returns None so the remaining notebook can continue safely.
After defining the helper function, the notebook requests Tender Offer Calendar data followed by Trending Stocks data. Once both requests complete, the notebook prints a simple status summary indicating whether each endpoint was retrieved successfully before continuing to the data processing stage.
CELL 3 — DataFrame
print("="*80)
print("MEMPROSES DATA")
print("="*80)

# ==========================
# Tender Offer
# ==========================

if tender:

    if isinstance(tender, list):

        df_tender = pd.DataFrame(tender)

    elif "data" in tender:

        df_tender = pd.DataFrame(tender["data"])

    else:

        df_tender = pd.json_normalize(tender)

else:

    df_tender = pd.DataFrame()

# ==========================
# Trending
# ==========================

if trending:

    if isinstance(trending, list):

        df_trending = pd.DataFrame(trending)

    elif "data" in trending:

        df_trending = pd.DataFrame(trending["data"])

    else:

        df_trending = pd.json_normalize(trending)

else:

    df_trending = pd.DataFrame()


print("\nTender Offer")
display(df_tender.head())

print("\nTrending Stocks")
display(df_trending.head())
Explanation
After retrieving both API responses, the notebook converts the returned JSON objects into pandas DataFrames.
The first section processes the Tender Offer Calendar response. Because API responses may have different structures, the notebook first checks whether the response is already a list. If so, the list is converted directly into a DataFrame.
If the response is returned as a dictionary containing a data field, only the contents of that field are converted into a DataFrame. Otherwise, the notebook uses pd.json_normalize() to flatten the JSON structure before creating the DataFrame.
If the Tender Offer request fails or returns no data, an empty DataFrame is created so the notebook can continue executing without errors.
The notebook then performs the same workflow for the Trending Stocks response. Depending on the JSON structure returned by the API, the notebook converts either the list, the data field, or the normalized JSON object into a pandas DataFrame.
Finally, the notebook displays the first five rows of both DataFrames using head(). Displaying only a subset of the records keeps the notebook output concise while allowing users to verify that the retrieved market data has been processed correctly.
By converting both API responses into DataFrames at this stage, the notebook prepares the datasets for the dashboard analysis performed in the following section.
CELL 4 — Dashboard Analysis
print("="*90)
print("IDX MARKET DASHBOARD")
print("="*90)

print()

# ===================================================
# Tender Offer
# ===================================================

print("TENDER OFFER")

if not df_tender.empty:

    print("Jumlah Tender :", len(df_tender))
    print()

    cols = list(df_tender.columns)

    for i in range(min(5, len(df_tender))):

        print("-"*60)

        row = df_tender.iloc[i]

        for c in cols:

            print(f"{c} : {row[c]}")

else:

    print("Tidak ada data Tender Offer")

print()
print("="*90)
print()

# ===================================================
# Trending
# ===================================================

print("TRENDING STOCKS")

if not df_trending.empty:

    print("Jumlah Saham Trending :", len(df_trending))
    print()

    cols = list(df_trending.columns)

    for i in range(min(10, len(df_trending))):

        print("-"*60)

        row = df_trending.iloc[i]

        for c in cols:

            print(f"{c} : {row[c]}")

else:

    print("Tidak ada data Trending")
Explanation
Once both datasets have been converted into DataFrames, the notebook generates a text-based dashboard summarizing the retrieved market information.
The first section focuses on the Tender Offer Calendar dataset.
If the Tender Offer DataFrame contains records, the notebook prints the total number of available Tender Offers before displaying the first five entries. Rather than selecting only specific columns, the notebook dynamically retrieves every available column from the DataFrame and prints each field together with its corresponding value.
This flexible approach ensures that every field returned by the API is displayed automatically, even if additional columns are introduced in future API updates.
If no Tender Offer data is available, the notebook displays a simple message indicating that no records were retrieved.
The second section applies the same workflow to the Trending Stocks dataset.
When data exists, the notebook prints the total number of trending stocks before displaying up to ten records. Each record is printed field by field, allowing users to inspect all available information returned by the API instead of limiting the output to selected columns.
If the Trending Stocks DataFrame is empty, the notebook reports that no trending data is available.
Unlike many dashboards that summarize only a few selected metrics, this implementation displays every available field for each record. This makes the notebook useful not only for analysis but also for understanding the complete structure of the API response before performing additional processing or visualization
CELL 5 — Market Summary Dashboard
from datetime import datetime

print("="*100)
print("📊 IDX MARKET SUMMARY DASHBOARD".center(100))
print("="*100)

print(f"🗓  Update Time : {datetime.now().strftime('%d %B %Y | %H:%M:%S')}")
print()

# ======================================================
# TENDER OFFER
# ======================================================

tender_count = len(df_tender)

print("📌 TENDER OFFER")
print("-"*100)

if tender_count > 0:

    print(f"✅ Total Tender Offer : {tender_count}")

    if "symbol" in df_tender.columns:
        print("🏢 Emiten :")
        print("   " + ", ".join(df_tender["symbol"].astype(str).head(10)))

else:

    print("❌ Tidak ada Tender Offer yang tersedia.")

print()


# ======================================================
# TRENDING STOCK
# ======================================================

trend_count = len(df_trending)

print("🔥 TRENDING STOCK")
print("-"*100)

if trend_count > 0:

    print(f"✅ Total Trending Stocks : {trend_count}")

    symbol_col = None

    for col in ["symbol","code","stockCode","ticker"]:
        if col in df_trending.columns:
            symbol_col = col
            break

    if symbol_col:

        print("\nTop Trending:")

        for i, s in enumerate(df_trending[symbol_col].head(10),1):
            print(f"{i:>2}. {s}")

else:

    print("❌ Tidak ada saham trending.")

print()


# ======================================================
# OVERALL STATUS
# ======================================================

print("="*100)

score = 0

if tender_count > 0:
    score += 50

if trend_count > 0:
    score += 50

print("📈 OVERALL MARKET STATUS")

if score == 100:
    print("🟢 Semua endpoint berhasil diambil.")
elif score >= 50:
    print("🟡 Sebagian endpoint berhasil.")
else:
    print("🔴 Tidak ada data yang berhasil diperoleh.")

print()

print(f"📦 Tender Offer      : {tender_count}")
print(f"📈 Trending Stocks   : {trend_count}")

print("="*100)
print("✅ PROJECT FINISHED".center(100))
print("="*100)
Explanation
The final cell combines the processed Tender Offer and Trending Stocks datasets into a compact market summary dashboard.
The cell begins by importing datetime and printing a formatted dashboard header. It then displays the current execution time using datetime.now().strftime(). This timestamp helps users identify when the dashboard was last generated.
Tender Offer Summary
The first section calculates the total number of Tender Offer records using len(df_tender).
If the DataFrame contains data, the notebook prints the total number of Tender Offers. It then checks whether a symbol column exists. When that column is available, the first ten issuer symbols are joined into a single comma-separated line.
If the DataFrame is empty, the dashboard reports that no Tender Offer data is available.
Trending Stocks Summary
The second section calculates the total number of Trending Stocks records using len(df_trending).
If trending data is available, the notebook prints the total number of records and searches for a suitable stock-symbol column. It checks several possible names: symbol, code, stockCode, and ticker.
Once a matching column is found, the notebook prints the first ten Trending Stocks in a numbered list. This flexible column detection allows the summary to work even when the API uses different field names.
If no Trending Stocks data is available, the notebook displays a notification instead.
Overall Market Status
The final section creates a simple status score.
The score starts at zero. If Tender Offer data exists, fifty points are added. If Trending Stocks data exists, another fifty points are added.
The dashboard then interprets the score:
A score of 100 means both endpoints returned data.
A score of 50 means only one endpoint returned data.
A score of 0 means neither endpoint returned usable information.
Finally, the notebook prints the total number of Tender Offer and Trending Stocks records before displaying the PROJECT FINISHED message.
This final cell does not introduce new market calculations. Its purpose is to summarize API availability and present the most important record counts and symbols in one concise output.
Result
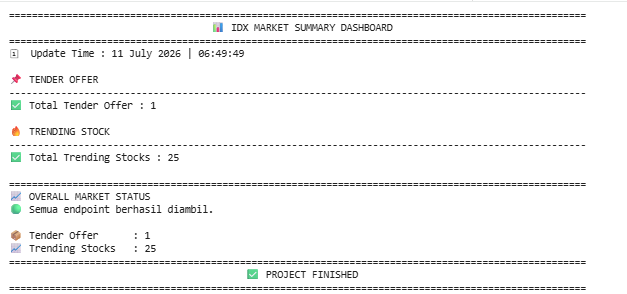
The completed notebook produces three main outputs: Tender Offer Calendar, Trending Stocks, and the IDX Market Summary Dashboard.
Tender Offer Calendar Output
The Tender Offer response is converted into a pandas DataFrame.
If data is available, the notebook displays the first five records and then prints up to five complete entries field by field inside the dashboard-analysis section.
In the final summary, the notebook reports the total number of Tender Offers and displays up to ten issuer symbols when a symbol column exists.
If the API response is unavailable or empty, the notebook clearly reports that no Tender Offer information was retrieved.
Trending Stocks Output
The Trending Stocks response is also converted into a pandas DataFrame.
The notebook displays the first five rows before presenting up to ten complete trending records inside the analysis dashboard.
The final summary detects a stock-symbol column automatically and prints up to ten Trending Stocks as a numbered list.
If the dataset is empty, the notebook reports that no trending stocks are available.
Overall Market Status
The final dashboard evaluates whether each endpoint returned usable data.
When both datasets are available, the status is displayed as:
🟢 Semua endpoint berhasil diambil.If only one dataset is available, the dashboard reports partial success. If neither dataset contains records, it reports that no data was retrieved.
The dashboard also displays the total Tender Offer and Trending Stocks record counts.
Overall Workflow
The notebook follows this five-cell workflow:
Import the required Python libraries and configure RapidAPI access.
Create a reusable API request function.=
Retrieve Tender Offer Calendar and Trending Stocks data.
Convert the responses into pandas DataFrames.
Display the first rows of both datasets.
Print detailed Tender Offer and Trending Stocks records.
Generate a final summary with record counts and issuer symbols.
Calculate the overall endpoint status.
Finish the project with a formatted dashboard output.
Why This Project Matters
Tender Offer Calendar and Trending Stocks provide two different views of current market activity.
Tender Offer information helps users monitor companies involved in tender-offer events. Trending Stocks data highlights securities that are currently receiving attention according to the API response.
Combining both datasets in one notebook allows users to review corporate-action information and active market interest through a single workflow.
The notebook also demonstrates practical API-processing techniques. It handles common HTTP errors, supports multiple JSON response formats, converts responses into DataFrames, dynamically displays all returned fields, and detects possible stock-symbol columns.
The project remains intentionally simple. It does not add price predictions, trading recommendations, or visualizations that are not present in the source file.
Conclusion
The IDX Tender Offer Calendar and Trending Stocks Dashboard demonstrates how Python can be used to retrieve, process, display, and summarize market information from the Indonesia Stock Exchange API.
Using requests, pandas, and datetime, the notebook retrieves Tender Offer Calendar and Trending Stocks responses, converts them into structured DataFrames, displays detailed market records, and generates a final endpoint-status dashboard.
The result is a lightweight and reusable workflow for monitoring Tender Offer events and Trending Stocks through Python.