
Financial market analysis involves much more than monitoring stock prices. Investors and analysts frequently combine macroeconomic information with company-specific activities to gain a broader understanding of market conditions.
Economic calendars provide insight into scheduled events such as inflation reports, interest rate decisions, manufacturing indexes, and trade balance announcements. These events often influence investor sentiment and market volatility. At the same time, insider trading activity offers another valuable perspective by showing whether company executives and insiders are actively buying or selling shares.
Instead of collecting these datasets manually from multiple sources, Python makes it possible to automate the entire workflow. By connecting directly to the Indonesia Stock Exchange API through RapidAPI, developers can retrieve financial information, clean the data, perform exploratory analysis, visualize important metrics, and export the results for further research.
In this project, we build an IDX Economic Calendar & Insider Net Dashboard using Python. The notebook retrieves Economic Calendar data together with Insider Net Summary information, prepares the data for analysis, performs exploratory data analysis, generates visualizations, and exports the processed datasets into Excel and CSV files.
The notebook is divided into five logical sections, beginning with API configuration and ending with dashboard visualization and data export.
What This Project Builds
This project creates an integrated financial market dashboard that combines:
Economic Calendar data
Insider Net Summary data
Automatic API communication through RapidAPI
Data cleaning and preprocessing
Exploratory Data Analysis (EDA)
Dashboard visualization using Matplotlib
Excel and CSV export functionality
By integrating these components into a single workflow, the notebook provides a reusable foundation for monitoring market events and insider trading activity using Python.
CELL 1 — Import Library & Configure the RapidAPI Connection
import os
import json
import time
from pathlib import Path
from datetime import datetime
from getpass import getpass

import requests
import pandas as pd
import matplotlib.pyplot as plt
from IPython.display import display, Markdown

pd.set_option("display.max_columns", 100)
pd.set_option("display.max_rows", 100)

OUTPUT_DIR = Path("outputs")
OUTPUT_DIR.mkdir(exist_ok=True)

BASE_URL = "https://indonesia-stock-exchange-idx.p.rapidapi.com"
RAPIDAPI_HOST = "indonesia-stock-exchange-idx.p.rapidapi.com"

SYMBOLS = ["BBCA", "BUMI", "ADRO"]
DATE_START = "2025-11-01"
DATE_END = "2025-12-31"

API_KEY = os.getenv("RAPIDAPI_KEY")

if not API_KEY:
    API_KEY = getpass("YOUR_API_KEY: ")

headers = {
    "x-rapidapi-host": RAPIDAPI_HOST,
    "x-rapidapi-key": API_KEY
}

print("✅ Cell 1 selesai: konfigurasi siap.")
Explanation
The project begins by importing all libraries required throughout the notebook. Rather than importing modules one by one as they become necessary, the notebook prepares the complete working environment at the beginning. This approach makes the remaining sections cleaner and easier to maintain.
The requests library is responsible for communicating with the Indonesia Stock Exchange API through RapidAPI. Every request sent later in the notebook uses this library to retrieve JSON responses from remote endpoints.
Next, pandas serves as the primary data processing library. Once the API returns JSON responses, pandas transforms them into structured DataFrames that can be cleaned, analyzed, filtered, and exported. Display settings are also configured so that more rows and columns can be viewed directly inside Google Colab.
The notebook imports Matplotlib to create charts later in the workflow. Visualizing insider transaction data and economic events provides a faster way to identify trends compared to reading raw tables.
Several standard Python libraries are also included. The os module retrieves environment variables, json helps inspect API responses during debugging, time provides delays between requests when necessary, datetime generates timestamps for exported files, while Path automatically creates an output directory for saving reports.
Another important feature introduced in this cell is secure API authentication. Instead of hardcoding the RapidAPI key directly into the notebook, the code first checks whether the key already exists as an environment variable. If it does not, the notebook prompts the user to enter it interactively using getpass(). This approach improves security because the API key does not appear in plain text.
Finally, several configuration variables are defined, including the base API URL, RapidAPI host, stock symbols to analyze, and the selected date range. These values become reusable parameters that are referenced throughout the remainder of the notebook.
CELL 2 — Retrieve Data from the Indonesia Stock Exchange API
# ============================================================
# CELL 2 - MENGAMBIL DATA DARI RAPIDAPI + FALLBACK SAMPLE DATA
# ============================================================

def fetch_json(endpoint, params=None):
    url = f"{BASE_URL}{endpoint}"

    try:
        response = requests.get(
            url,
            headers=headers,
            params=params,
            timeout=30
        )

        print(f"\nEndpoint: {endpoint}")
        print("Status Code:", response.status_code)

        if response.status_code == 403:
            print("⚠️ API menolak akses: akun RapidAPI belum subscribe ke API ini.")
            return None

        if response.status_code == 429:
            print("⚠️ Terlalu banyak request. Tunggu beberapa menit atau gunakan sample data.")
            return None

        response.raise_for_status()

        data = response.json()

        print("✅ Data berhasil diambil")
        return data

    except Exception as error:
        print("❌ Gagal mengambil data")
        print("Error:", error)

        try:
            print("Response:", response.text[:500])
        except:
            pass

        return None


economic_json = fetch_json("/api/calendar/economic")

insider_json = fetch_json(
    f"/api/analysis/insider-net/{','.join(SYMBOLS)}",
    params={
        "date_start": DATE_START,
        "date_end": DATE_END
    }
)
Explanation
The second section is responsible for retrieving financial market data from the Indonesia Stock Exchange API. Instead of writing multiple request blocks, the notebook introduces a reusable helper function named fetch_json() that standardizes every API request.
The helper function receives an endpoint and optional parameters before constructing the complete request URL. It then sends an HTTP GET request using the authentication headers defined in the previous section.
One of the strengths of this implementation is its handling of API responses. Rather than assuming every request succeeds, the notebook explicitly checks common HTTP status codes. A 403 Forbidden response indicates that the RapidAPI account has not subscribed to the required API, while a 429 Too Many Requests response signals that the request limit has been exceeded.
Instead of allowing the notebook to terminate immediately, these conditions return None, enabling the remaining workflow to continue gracefully.
After the helper function has been defined, two datasets are requested. The first retrieves the Economic Calendar, which contains scheduled macroeconomic events that may affect financial markets. The second request retrieves Insider Net Summary information for the selected stock symbols BBCA, BUMI, and ADRO within the configured date range.
Separating the request logic from the data processing stage makes the notebook easier to extend. Additional API endpoints can later be integrated simply by calling the same helper function with a different endpoint and parameter configuration.
CELL 2 — Retrieve Data from RapidAPI
The notebook not only retrieves data from the Indonesia Stock Exchange API but also includes a fallback mechanism to ensure that the project remains functional even when the API is temporarily unavailable. This is particularly useful during development, demonstrations, or situations where the RapidAPI subscription has not yet been activated.
Instead of stopping the execution after receiving an HTTP 403 Forbidden or 429 Too Many Requests response, the notebook automatically switches to predefined sample datasets. This design allows every subsequent step—including data cleaning, exploratory analysis, visualization, and export—to continue without interruption.
Such an approach improves the reliability of the notebook because users can still understand the complete workflow without depending on a live API connection. It also provides consistent sample data that can be used for testing and validating the remaining components of the dashboard.
The fallback datasets closely resemble the structure returned by the real API. As a result, the remaining cells do not require additional conditional logic to distinguish between real and sample data.
Fallback Sample Data
# ============================================================
# FALLBACK SAMPLE DATA
# ============================================================

if economic_json is None:
    print("\n✅ Menggunakan sample data untuk Economic Calendar.")

    economic_json = {
        "data": [
            {
                "date": "2025-11-03",
                "country": "Indonesia",
                "event": "Inflation Rate YoY",
                "actual": 2.56,
                "forecast": 2.40,
                "previous": 2.30,
                "impact": "High"
            },
            {
                "date": "2025-11-07",
                "country": "Indonesia",
                "event": "Foreign Exchange Reserves",
                "actual": 150.2,
                "forecast": 149.8,
                "previous": 149.5,
                "impact": "Medium"
            },
            {
                "date": "2025-11-15",
                "country": "Indonesia",
                "event": "Trade Balance",
                "actual": 3.1,
                "forecast": 2.8,
                "previous": 2.6,
                "impact": "High"
            },
            {
                "date": "2025-12-01",
                "country": "Indonesia",
                "event": "Manufacturing PMI",
                "actual": 51.3,
                "forecast": 50.9,
                "previous": 50.6,
                "impact": "Medium"
            },
            {
                "date": "2025-12-20",
                "country": "Indonesia",
                "event": "Interest Rate Decision",
                "actual": 5.75,
                "forecast": 5.75,
                "previous": 6.00,
                "impact": "High"
            }
        ]
    }


if insider_json is None:
    print("✅ Menggunakan sample data untuk Insider Net.")

    insider_json = {
        "data": [
            {
                "date": "2025-11-05",
                "symbol": "BBCA",
                "company": "Bank Central Asia Tbk",
                "buy_value": 1250000000,
                "sell_value": 300000000,
                "net_value": 950000000,
                "transaction_volume": 1200000
            },
            {
                "date": "2025-11-12",
                "symbol": "BUMI",
                "company": "Bumi Resources Tbk",
                "buy_value": 500000000,
                "sell_value": 800000000,
                "net_value": -300000000,
                "transaction_volume": 3500000
            },
            {
                "date": "2025-11-20",
                "symbol": "ADRO",
                "company": "Adaro Energy Indonesia Tbk",
                "buy_value": 900000000,
                "sell_value": 250000000,
                "net_value": 650000000,
                "transaction_volume": 2100000
            },
            {
                "date": "2025-12-03",
                "symbol": "BBCA",
                "company": "Bank Central Asia Tbk",
                "buy_value": 700000000,
                "sell_value": 100000000,
                "net_value": 600000000,
                "transaction_volume": 900000
            },
            {
                "date": "2025-12-10",
                "symbol": "ADRO",
                "company": "Adaro Energy Indonesia Tbk",
                "buy_value": 400000000,
                "sell_value": 600000000,
                "net_value": -200000000,
                "transaction_volume": 1800000
            }
        ]
    }


print("\nRingkasan:")
print("Economic JSON:", "Ada" if economic_json is not None else "Kosong")
print("Insider JSON :", "Ada" if insider_json is not None else "Kosong")
Explanation
The fallback implementation introduces predefined datasets for both Economic Calendar and Insider Net Summary. These sample records imitate real API responses, including event dates, company names, trading values, and transaction volumes.
Using representative sample data provides two major advantages. First, developers can continue testing the notebook without relying on external services. Second, the remaining data processing pipeline behaves exactly as it would with live data, making demonstrations and educational content much easier to reproduce.
At the end of this section, the notebook prints a short summary indicating whether each dataset contains valid information. This simple validation step confirms that the workflow is ready to proceed to data preparation.
CELL 3 — Data Cleaning & Data Preparation
def extract_records(obj):
    if obj is None:
        return []

    if isinstance(obj, list):
        return obj

    if isinstance(obj, dict):
        priority_keys = [
            "data", "result", "results", "items",
            "calendar", "economic", "insider",
            "transactions", "summary"
        ]

        for key in priority_keys:
            if key in obj:
                found = extract_records(obj[key])
                if found:
                    return found

        for value in obj.values():
            found = extract_records(value)
            if found:
                return found

        return [obj]

    return []


def clean_dataframe(df):
    if df.empty:
        return df

    df = df.copy()

    df.columns = (
        df.columns.astype(str)
        .str.strip()
        .str.lower()
        .str.replace(" ", "_", regex=False)
        .str.replace(".", "_", regex=False)
        .str.replace("-", "_", regex=False)
    )

    df = df.drop_duplicates()

    for col in df.columns:
        if df[col].dtype == "object":
            temp = (
                df[col].astype(str)
                .str.replace(",", "", regex=False)
                .str.replace("%", "", regex=False)
                .str.strip()
            )

            numeric = pd.to_numeric(temp, errors="coerce")

            if numeric.notna().mean() >= 0.6:
                df[col] = numeric

    for col in df.columns:
        if any(x in col for x in ["date", "tanggal", "time"]):
            date_value = pd.to_datetime(df[col], errors="coerce")

            if date_value.notna().mean() >= 0.5:
                df[col] = date_value

    return df


economic_records = extract_records(economic_json)
insider_records = extract_records(insider_json)

economic_df = clean_dataframe(pd.json_normalize(economic_records))
insider_df = clean_dataframe(pd.json_normalize(insider_records))

display(Markdown("## Economic Calendar"))
print("Jumlah data:", len(economic_df))
display(economic_df.head())

display(Markdown("## Insider Net"))
print("Jumlah data:", len(insider_df))
display(insider_df.head())

if economic_df.empty:
    print("\n⚠️ Economic Calendar masih kosong. Kemungkinan endpoint API tidak mengirim data.")

if insider_df.empty:
    print("\n⚠️ Insider Net masih kosong. Coba ubah periode tanggal atau kode saham.")
Explanation
Once the raw JSON responses have been collected, the notebook moves into the data preparation stage. This section transforms nested API responses into structured pandas DataFrames that are easier to analyze and visualize.
The extract_records() function is designed to handle multiple API response formats. Because different endpoints may return data under keys such as data, result, items, calendar, or summary, the function searches these keys recursively until it finds the actual list of records. This makes the notebook much more flexible and reduces the need to rewrite the extraction logic whenever the API response structure changes.
After the records have been extracted, the clean_dataframe() function performs several preprocessing tasks. It standardizes column names by converting them to lowercase, replacing spaces and special characters with underscores, and removing duplicate rows. These steps create a cleaner dataset that is easier to work with throughout the project.
The function also attempts to identify numeric values stored as text. Strings containing commas, percentage symbols, or unnecessary whitespace are cleaned before being converted into numeric data types whenever possible. Similarly, columns containing date-related information are automatically converted into pandas datetime objects, making chronological analysis much simpler.
Finally, both cleaned datasets are displayed inside the notebook. The first few rows of the Economic Calendar and Insider Net Summary are shown, along with the total number of available records. If either dataset is empty, the notebook prints a warning message to help users identify potential API or parameter issues before continuing to the analysis stage.
CELL 4 — Exploratory Data Analysis
def eda_summary(df, title):
    display(Markdown(f"## {title}"))

    if df.empty:
        print("Data kosong.")
        return

    print("Ukuran data:", df.shape)

    print("\nKolom:")
    print(list(df.columns))

    print("\nMissing Value:")
    display(df.isnull().sum().to_frame("missing_value"))

    numeric_cols = df.select_dtypes(include="number").columns.tolist()

    if numeric_cols:
        print("\nStatistik Deskriptif:")
        display(df[numeric_cols].describe().T)

    date_cols = df.select_dtypes(include="datetime").columns.tolist()

    if date_cols:
        print("\nRentang Tanggal:")
        for col in date_cols:
            print(f"{col}: {df[col].min()} sampai {df[col].max()}")


eda_summary(economic_df, "EDA Economic Calendar")
eda_summary(insider_df, "EDA Insider Net")
Explanation
After the datasets have been cleaned and standardized, the notebook proceeds with Exploratory Data Analysis (EDA). This stage provides a quick overview of both datasets before they are visualized or exported.
Rather than manually inspecting each DataFrame, the notebook introduces a reusable helper function named eda_summary(). This function generates a concise summary for any DataFrame by displaying its dimensions, available columns, missing values, descriptive statistics, and date ranges. By using a single function for both datasets, the notebook maintains consistency while avoiding repetitive code.
The first piece of information displayed is the dataset size. Knowing the number of rows and columns helps users understand how much information has been retrieved from the API and whether the response contains meaningful data.
Next, the notebook lists every available column. Since API responses may evolve over time, this step allows users to inspect the schema immediately without opening the raw JSON structure.
The notebook then performs a missing value analysis by calculating the number of null values in every column. Missing values are common in financial datasets, particularly when certain economic indicators or transaction details are unavailable. Identifying these gaps early allows users to decide whether additional preprocessing is required.
For numeric columns, the notebook automatically generates descriptive statistics using the describe() function. This summary includes the count, mean, standard deviation, minimum, maximum, and quartile values, providing a quick understanding of the numerical distribution within the dataset.
If datetime columns are available, the notebook also reports the earliest and latest dates contained in the data. This simple check verifies that the retrieved records fall within the expected observation period and helps detect incomplete or unexpected API responses.
Finally, the eda_summary() function is executed twice: once for the Economic Calendar dataset and once for the Insider Net Summary dataset. This gives users an immediate overview of both sources before moving on to visualization.
CELL 5 — Dashboard Visualization & Export
def choose_column(df, candidates):
    for col in candidates:
        if col in df.columns:
            return col
    return None


print("=" * 70)
print("IDX ECONOMIC CALENDAR & INSIDER NET DASHBOARD")
print("=" * 70)
print("Last Update:", datetime.now().strftime("%Y-%m-%d %H:%M:%S"))
print("Saham:", ", ".join(SYMBOLS))
print("Periode:", DATE_START, "sampai", DATE_END)
print("Economic Calendar:", len(economic_df), "baris")
print("Insider Net:", len(insider_df), "baris")
print("=" * 70)


# Grafik Economic Calendar
if not economic_df.empty:
    date_col = choose_column(
        economic_df,
        ["date", "tanggal", "datetime", "event_date", "calendar_date"]
    )

    if date_col and pd.api.types.is_datetime64_any_dtype(economic_df[date_col]):
        event_count = economic_df.groupby(economic_df[date_col].dt.date).size()

        plt.figure(figsize=(12, 5))
        event_count.plot(kind="bar")
        plt.title("Jumlah Agenda Ekonomi per Tanggal")
        plt.xlabel("Tanggal")
        plt.ylabel("Jumlah Agenda")
        plt.xticks(rotation=45)
        plt.tight_layout()
        plt.show()


# Grafik Insider Net
if not insider_df.empty:
    symbol_col = choose_column(
        insider_df,
        ["stock_code", "symbol", "ticker", "code", "stock", "emiten", "company_code"]
    )

    if symbol_col is None:
        symbol_col = insider_df.columns[0]

    numeric_cols = insider_df.select_dtypes(include="number").columns.tolist()

    if numeric_cols:
        value_col = numeric_cols[0]

        plot_df = insider_df[[symbol_col, value_col]].dropna()
        plot_df[symbol_col] = plot_df[symbol_col].astype(str)
        plot_df = plot_df.sort_values(value_col, ascending=False).head(20)

        plt.figure(figsize=(12, 5))
        plt.bar(plot_df[symbol_col], plot_df[value_col])
        plt.title(f"Top Insider Net berdasarkan {value_col}")
        plt.xlabel(symbol_col)
        plt.ylabel(value_col)
        plt.xticks(rotation=45)
        plt.tight_layout()
        plt.show()

        plt.figure(figsize=(10, 5))
        insider_df[value_col].dropna().plot(kind="hist", bins=20)
        plt.title(f"Distribusi Nilai Insider - {value_col}")
        plt.xlabel(value_col)
        plt.ylabel("Frekuensi")
        plt.tight_layout()
        plt.show()


# Export
timestamp = datetime.now().strftime("%Y%m%d_%H%M%S")

excel_path = OUTPUT_DIR / f"idx_dashboard_{timestamp}.xlsx"

with pd.ExcelWriter(excel_path, engine="openpyxl") as writer:
    economic_df.to_excel(writer, sheet_name="Economic Calendar", index=False)
    insider_df.to_excel(writer, sheet_name="Insider Net", index=False)

economic_df.to_csv(OUTPUT_DIR / f"economic_calendar_{timestamp}.csv", index=False)
insider_df.to_csv(OUTPUT_DIR / f"insider_net_{timestamp}.csv", index=False)

print("\n✅ Export selesai.")
print("File Excel:", excel_path)
Explanation
The final section combines the processed datasets into a complete dashboard while also generating visualizations and exporting the results for future use.
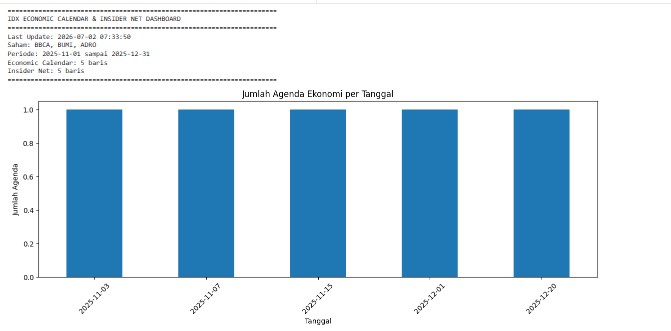
The notebook begins by printing a dashboard summary that includes the execution timestamp, selected stock symbols, analysis period, and the total number of Economic Calendar and Insider Net records. This information provides users with a quick overview of the current analysis session before any charts are generated.
The first visualization focuses on the Economic Calendar. The notebook automatically searches for a valid date column using the choose_column() helper function, making the visualization adaptable to different API response formats. Once a valid datetime column has been identified, the notebook groups the records by date and creates a bar chart showing the number of economic events scheduled for each day. This chart allows users to identify periods with higher concentrations of economic announcements that may influence market volatility.
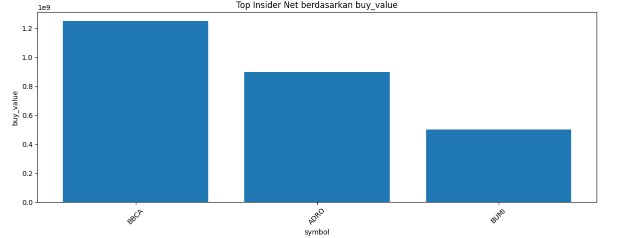
The second visualization analyzes the Insider Net Summary. Instead of assuming a fixed schema, the notebook automatically detects an appropriate symbol column and identifies available numeric columns. This flexible approach ensures that the visualization continues to work even if the API response changes slightly in the future.
After selecting the relevant columns, the notebook creates a ranked bar chart displaying the companies with the highest insider-related values. Sorting the data before plotting makes it easier to compare the largest observations without manually filtering the DataFrame.
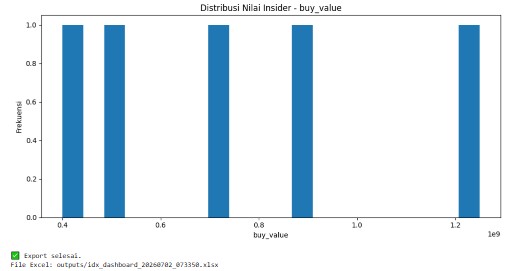
To complement the ranking chart, the notebook also generates a histogram illustrating the distribution of the selected insider metric. This additional visualization provides insight into how transaction values are spread across the dataset and helps identify potential outliers.
The final part of the workflow focuses on data export. A timestamp is generated automatically so that every exported file has a unique filename. Both datasets are saved into separate worksheets within a single Excel workbook, while additional CSV files are created for each dataset individually. These exports make it easy to share, archive, or continue analyzing the processed data using spreadsheet software or other analytical tools.
By combining dashboard summaries, visualizations, and automated exports, the notebook delivers a complete end-to-end workflow that transforms raw API responses into structured reports suitable for financial analysis.
Result
Dashboard Output
The completed dashboard provides a comprehensive overview of both Economic Calendar events and Insider Net Summary data retrieved from the Indonesia Stock Exchange API.
The dashboard begins by presenting execution metadata, including the analysis timestamp, selected stock symbols, observation period, and the total number of records successfully processed. This summary confirms that the workflow has completed successfully before moving to visual analysis.
Economic Calendar
The Economic Calendar section displays scheduled macroeconomic events after they have been cleaned and converted into a structured pandas DataFrame.
When valid date information is available, the notebook groups events by date and visualizes the number of scheduled economic announcements using a bar chart. This allows users to quickly identify dates with higher concentrations of market-moving events.
Insider Net Summary
The Insider Net Summary section presents insider transaction information for the selected companies. The notebook automatically detects the most appropriate identifier and numeric columns before generating visualizations.
A ranked bar chart highlights the companies with the highest insider-related values, while a histogram illustrates the distribution of those values across the dataset. Together, these visualizations provide both comparative and statistical perspectives on insider trading activity.
Exported Reports
After completing the analysis, the notebook exports all processed data into multiple formats. Both datasets are written to separate worksheets within a single Excel workbook, and additional CSV files are generated for each dataset individually. These exported reports allow users to continue their analysis outside the notebook or integrate the data into other reporting workflows.
Overall Workflow
Import the required Python libraries.
Configure the RapidAPI connection and authentication.
Retrieve Economic Calendar and Insider Net Summary data.
Apply fallback sample data when API responses are unavailable.
Extract records from nested JSON structures.
Clean and standardize the datasets.
Convert numeric and date columns into appropriate data types.
Perform Exploratory Data Analysis (EDA).
Generate dashboard visualizations using Matplotlib.
Export the processed datasets to Excel and CSV files.
Why This Project Matters
Financial data often originates from multiple sources and arrives in inconsistent formats. Simply retrieving information from an API is rarely sufficient for meaningful analysis. Data must first be validated, standardized, explored, visualized, and finally stored in formats that can be reused.
This project demonstrates a complete workflow for working with financial market data using Python. Rather than focusing solely on API communication, the notebook integrates data acquisition, preprocessing, exploratory analysis, visualization, and reporting into a single, organized pipeline.
The inclusion of fallback sample data also improves the robustness of the project by allowing demonstrations and development to continue even when API access is temporarily unavailable or restricted. This makes the notebook useful not only for production scenarios but also for learning, testing, and experimentation.
By combining Economic Calendar information with Insider Net Summary data, the dashboard provides users with a broader perspective on market conditions. Economic events help explain external market drivers, while insider transaction activity offers additional insight into company-level behavior.
Conclusion
The IDX Economic Calendar & Insider Net Dashboard demonstrates how Python can be used to build a complete financial data analysis pipeline using the Indonesia Stock Exchange API.
Starting from API communication, the notebook retrieves Economic Calendar and Insider Net Summary data, prepares the datasets through automated cleaning procedures, performs exploratory analysis, generates meaningful visualizations, and exports the final results into Excel and CSV formats.
By integrating these components into a single workflow, the project provides a practical foundation for developing more advanced financial dashboards, market monitoring systems, and investment research tools. It also illustrates how Python libraries such as requests, pandas, and Matplotlib can work together to transform raw API responses into structured information that is easier to analyze, interpret, and share.