
Cryptocurrency markets can change rapidly, so traders need more than a single technical indicator to evaluate market conditions. A more robust approach combines trend structure, VWAP positioning, momentum, volatility, volume confirmation, and historical support and resistance. This project develops a BTCUSDT Advanced Trading Intelligence System that integrates these factors into a rule-based trading decision framework.
The system analyzes BTCUSDT on the 1-hour timeframe using up to 500 candles. It retrieves OHLCV data from Binance and optionally retrieves VWAP information and indicator metadata from the MarketFlow API. The analysis calculates EMA 20, EMA 50, EMA 200, RSI 14, MACD, ATR 14, rolling VWAP 100, VWAP deviation, volume ratio, and historical 20-candle support and resistance. btcusdt_advanced_trading_intell… btcusdt_advanced_trading_intell…
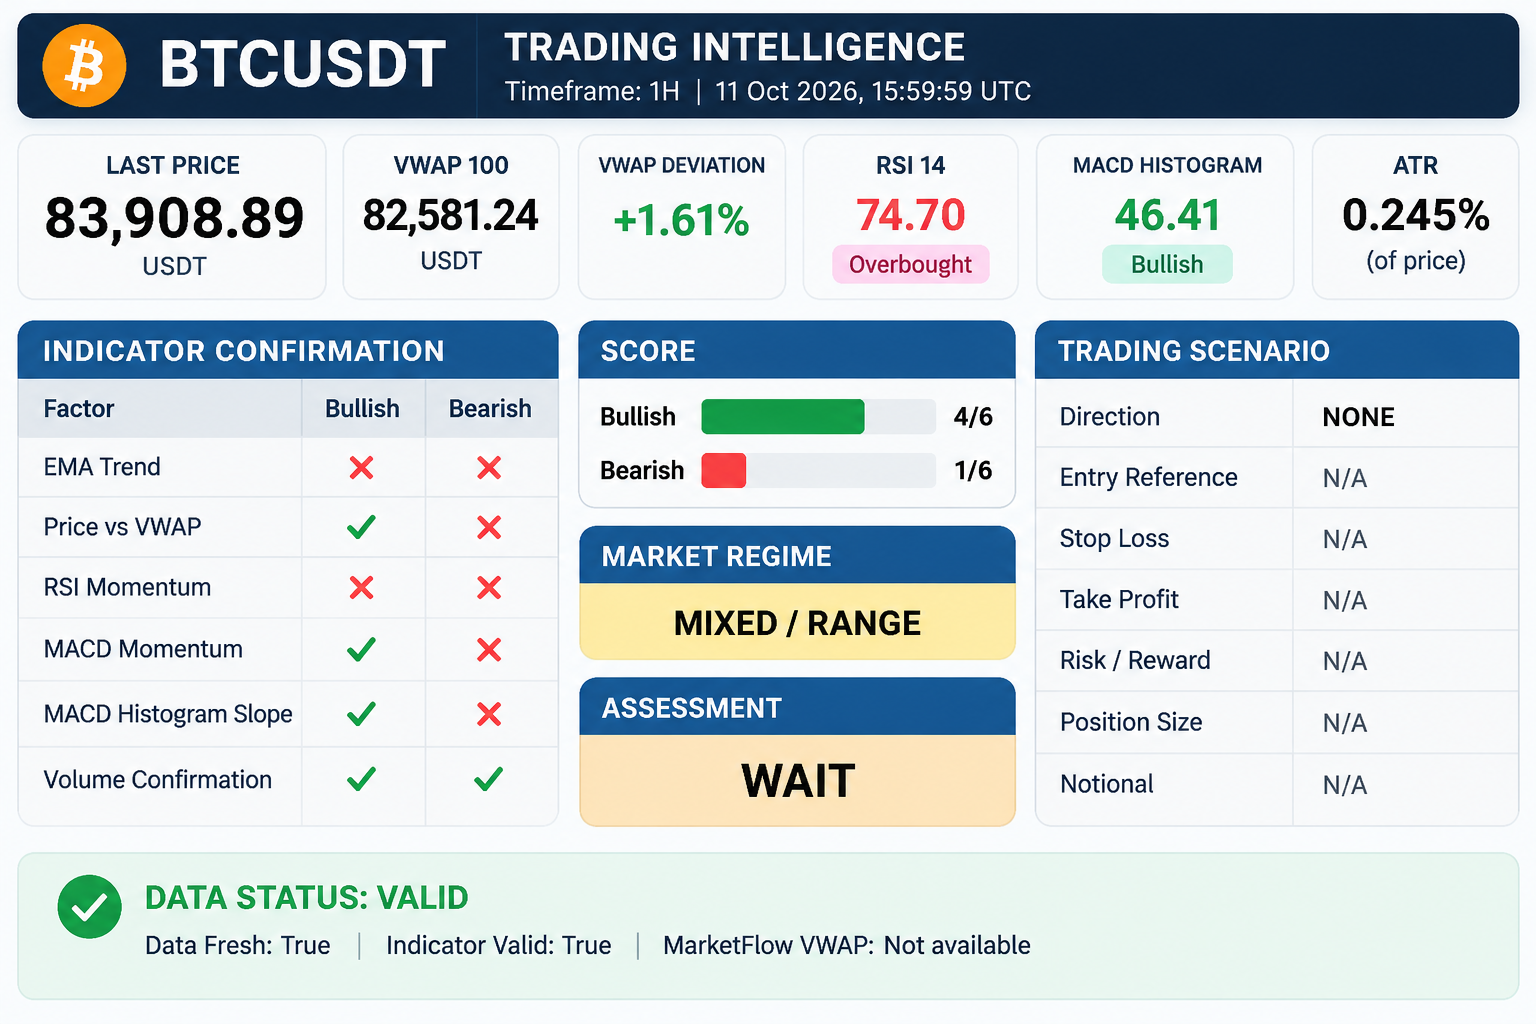
The trading engine then evaluates six confirmation factors: EMA trend, price relative to VWAP, RSI momentum, MACD momentum, MACD histogram slope, and volume confirmation. A long or short setup requires the corresponding trend and VWAP conditions together with at least four of six confirmations. Risk management subsequently calculates the entry reference, stop loss, take profit, risk/reward ratio, position size, and notional exposure. btcusdt_advanced_trading_intell…
Cell 1 — Configuration and API Connection
The first cell establishes the Python environment and defines the main analysis parameters. The system is configured for BTCUSDT using the 1-hour timeframe and 500 candles. The simulated account balance is set to 1,000 USDT, with 1% risk per trade, a minimum risk/reward ratio of 1.5, and an ATR multiplier of 1.5. btcusdt_advanced_trading_intell…
The cell also defines Binance and MarketFlow API endpoints. MarketFlow is optional, while Binance provides the primary OHLCV dataset. A reusable HTTP request engine is implemented with retry functionality and separate functions for Binance and MarketFlow requests. btcusdt_advanced_trading_intell…
# ============================================================
# CELL 1 — CONFIGURATION & API CONNECTION
# BTCUSDT ADVANCED TRADING INTELLIGENCE
# ============================================================

import os
import json
import time
import getpass
import requests
import numpy as np
import pandas as pd
import matplotlib.pyplot as plt

from datetime import datetime, timezone
from IPython.display import display

# ---------------- CONFIGURATION ----------------

SYMBOL = "BTCUSDT"
TIMEFRAME = "1h"
CANDLE_LIMIT = 500

ACCOUNT_BALANCE = 1000.0   # USDT, simulasi
RISK_PER_TRADE = 0.01      # 1% dari account
MIN_RR = 1.5
ATR_MULTIPLIER = 1.5
MAX_CANDLE_AGE = 2.5       # Kelipatan timeframe

BINANCE_BASES = [
    "https://data-api.binance.vision",
    "https://api.binance.com"
]

MARKETFLOW_BASE = (
    "https://marketflow-all-in-one-market-finance-api.p.rapidapi.com"
)

MARKETFLOW_HOST = (
    "marketflow-all-in-one-market-finance-api.p.rapidapi.com"
)

# RapidAPI optional
API_KEY = os.getenv("RAPIDAPI_KEY", "").strip()

if not API_KEY:
    answer = input("Gunakan MarketFlow RapidAPI? (y/n): ").lower()
    if answer == "y":
        API_KEY = getpass.getpass("RapidAPI Key: ").strip()

MF_HEADERS = {
    "x-rapidapi-host": MARKETFLOW_HOST,
    "x-rapidapi-key": API_KEY
}

# ---------------- HTTP ENGINE ----------------

session = requests.Session()

def request_json(url, params=None, headers=None, retries=2):
    last_error = None

    for attempt in range(retries + 1):
        try:
            r = session.get(
                url,
                params=params,
                headers=headers,
                timeout=25
            )

            r.raise_for_status()
            return r.json()

        except (requests.RequestException, ValueError) as e:
            last_error = str(e)
            if attempt < retries:
                time.sleep(1.5 * (attempt + 1))

    raise RuntimeError(
        f"API request failed: {url} | {last_error}"
    )


def binance_get(endpoint, params):
    errors = []

    for base in BINANCE_BASES:
        try:
            return request_json(base + endpoint, params)
        except Exception as e:
            errors.append(str(e))

    raise RuntimeError(
        "Binance unavailable:\n" + "\n".join(errors)
    )


def marketflow_get(endpoint, params=None):
    if not API_KEY:
        return None

    try:
        data = request_json(
            MARKETFLOW_BASE + endpoint,
            params=params,
            headers=MF_HEADERS
        )

        if isinstance(data, dict):
            if data.get("success") is False or data.get("error"):
                raise ValueError(str(data)[:400])

        return data

    except Exception as e:
        print(f"MarketFlow warning: {e}")
        return None


TIMEFRAME_HOURS = {
    "15m": 0.25,
    "30m": 0.5,
    "1h": 1,
    "4h": 4,
    "1d": 24
}

assert TIMEFRAME in TIMEFRAME_HOURS
assert 250 <= CANDLE_LIMIT <= 1000
assert ACCOUNT_BALANCE > 0
assert 0 < RISK_PER_TRADE <= 0.05

print("=" * 72)
print("BTCUSDT — ADVANCED TRADING INTELLIGENCE")
print("=" * 72)
print("Symbol      :", SYMBOL)
print("Timeframe   :", TIMEFRAME)
print("Candles     :", CANDLE_LIMIT)
print("Risk/Trade  :", f"{RISK_PER_TRADE:.1%}")
print("Minimum R:R :", MIN_RR)
print("MarketFlow  :", "ENABLED" if API_KEY else "DISABLED")
print("Status      : READY")
This configuration creates a controlled environment before market analysis begins. The risk parameters are explicitly defined rather than being inferred from the market data. The API request engine also includes retry logic so temporary request failures do not immediately terminate the analysis. btcusdt_advanced_trading_intell…
Cell 2 — Market Data Acquisition and Validation
The second cell retrieves the BTCUSDT OHLCV dataset from Binance. The system requests 500 one-hour candles and rejects the analysis if fewer than 250 records are returned. The raw Binance response is converted into a structured DataFrame containing open, high, low, close, volume, trade count, and related fields. btcusdt_advanced_trading_intell…
The code then removes candles that have not fully closed, validates OHLC relationships, checks for missing numerical values, verifies regular candle intervals, and evaluates data freshness. This prevents incomplete or irregular market data from being used as the basis for a trading decision. btcusdt_advanced_trading_intell…
MarketFlow is subsequently queried for VWAP information and indicator metadata. The MarketFlow VWAP value is accepted only when it is a finite positive number, while the returned metadata records the interval, window, timestamp, and limit information. btcusdt_advanced_trading_intell…
# ============================================================
# CELL 2 — MARKET DATA ACQUISITION
# ============================================================

raw_klines = binance_get(
    "/api/v3/klines",
    {
        "symbol": SYMBOL,
        "interval": TIMEFRAME,
        "limit": CANDLE_LIMIT
    }
)

if not isinstance(raw_klines, list) or len(raw_klines) < 250:
    raise ValueError("Insufficient OHLCV data.")

columns = [
    "open_time", "open", "high", "low", "close",
    "volume", "close_time", "quote_volume",
    "trades", "taker_base", "taker_quote", "ignore"
]

df = pd.DataFrame(raw_klines, columns=columns)

numeric_cols = [
    "open", "high", "low", "close", "volume",
    "quote_volume", "trades"
]

for col in numeric_cols:
    df[col] = pd.to_numeric(df[col], errors="coerce")

df["time"] = pd.to_datetime(
    df["open_time"], unit="ms", utc=True
)

df["close_datetime"] = pd.to_datetime(
    df["close_time"], unit="ms", utc=True
)

df = df.sort_values("time").drop_duplicates("time")

# Exclude any candle that has not fully closed.
now_utc = pd.Timestamp.now(tz="UTC")

df = df[
    df["close_datetime"] < now_utc
].copy()

df = df.reset_index(drop=True)

if len(df) < 220:
    raise ValueError("Not enough closed candles.")

# OHLCV validation
valid_ohlc = (
    (df["high"] >= df[["open", "close", "low"]].max(axis=1))
    & (df["low"] <= df[["open", "close", "high"]].min(axis=1))
    & (df["low"] > 0)
    & (df["volume"] >= 0)
)

if not valid_ohlc.all():
    raise ValueError("Invalid OHLCV records detected.")

if df[numeric_cols].isna().any().any():
    raise ValueError("Missing numeric OHLCV data.")

expected_gap = pd.Timedelta(hours=TIMEFRAME_HOURS[TIMEFRAME])
gaps = df["time"].diff().dropna()

if (gaps != expected_gap).any():
    raise ValueError("Missing or irregular candle intervals.")

candle_age_hours = (
    now_utc - df["close_datetime"].iloc[-1]
).total_seconds() / 3600

data_fresh = (
    0 <= candle_age_hours
    <= TIMEFRAME_HOURS[TIMEFRAME] * MAX_CANDLE_AGE
)

# ---------------- MARKETFLOW ----------------

mf_vwap_raw = marketflow_get(
    "/tools/crypto/vwap",
    {"symbol": SYMBOL, "limit": 100}
)

mf_indicator_raw = marketflow_get(
    "/tools/indicator/list"
)

def unwrap(data):
    if not isinstance(data, dict):
        return {}
    for key in ("data", "result"):
        if isinstance(data.get(key), dict):
            return data[key]
    return data


mf_data = unwrap(mf_vwap_raw)

try:
    MARKETFLOW_VWAP = float(
        mf_data.get("vwap", mf_data.get("VWAP", np.nan))
    )
except (TypeError, ValueError):
    MARKETFLOW_VWAP = np.nan

if not np.isfinite(MARKETFLOW_VWAP) or MARKETFLOW_VWAP <= 0:
    MARKETFLOW_VWAP = np.nan

# MarketFlow metadata must establish comparability.
MARKETFLOW_METADATA = {
    "interval": mf_data.get("interval"),
    "window": mf_data.get("window"),
    "timestamp": mf_data.get("timestamp"),
    "limit": mf_data.get("limit")
}

print("=" * 72)
print("MARKET DATA VALIDATION")
print("=" * 72)

print("Closed candles :", len(df))
print("First candle   :", df["time"].iloc[0])
print("Last close     :", df["close_datetime"].iloc[-1])
print("Last price     :", f"{df['close'].iloc[-1]:,.2f}")
print("Data freshness :", "FRESH" if data_fresh else "STALE")
print("MarketFlow VWAP:", MARKETFLOW_VWAP)
print("MF metadata    :", MARKETFLOW_METADATA)

display(
    df[[
        "time", "open", "high",
        "low", "close", "volume"
    ]].tail(5)
)

if not data_fresh:
    print("WARNING: Data is stale; trading signal will be blocked.")
The validation layer is particularly important because the trading engine later uses the most recent fully closed candle. If the dataset is stale or fails validation, the signal should not be treated as executable. btcusdt_advanced_trading_intell…
Cell 3 — Advanced Technical Indicator Engine
The third cell calculates the technical indicators required by the trading engine.
The trend structure uses EMA 20, EMA 50, and EMA 200. RSI 14 is calculated using Wilder's smoothing method. MACD is calculated from EMA 12 and EMA 26 with a nine-period signal line. ATR 14 is calculated using Wilder-style smoothing. btcusdt_advanced_trading_intell…
The system also calculates a 100-candle rolling VWAP using typical price and volume:
\[ VWAP_{100} = \frac{\sum_{i=1}^{100} TP_iV_i} {\sum_{i=1}^{100}V_i} \]
where:
\[ TP_i = \frac{High_i+Low_i+Close_i}{3} \]
VWAP deviation is then calculated as the percentage difference between the closing price and the rolling VWAP. btcusdt_advanced_trading_intell…
Volume confirmation uses the ratio between current volume and its 20-period moving average. Historical support and resistance are calculated from the preceding 20 candles, avoiding look-ahead bias. btcusdt_advanced_trading_intell…
# ============================================================
# CELL 3 — ADVANCED TECHNICAL INDICATOR ENGINE
# ============================================================

# ---------------- EMA ----------------

for period in [20, 50, 200]:
    df[f"EMA_{period}"] = df["close"].ewm(
        span=period,
        adjust=False,
        min_periods=period
    ).mean()

# ---------------- RSI (Wilder) ----------------

delta = df["close"].diff()
gain = delta.clip(lower=0)
loss = (-delta).clip(lower=0)

period = 14
avg_gain = pd.Series(np.nan, index=df.index)
avg_loss = pd.Series(np.nan, index=df.index)

avg_gain.iloc[period] = gain.iloc[1:period+1].mean()
avg_loss.iloc[period] = loss.iloc[1:period+1].mean()

for i in range(period + 1, len(df)):
    avg_gain.iloc[i] = (
        avg_gain.iloc[i-1] * (period-1) + gain.iloc[i]
    ) / period
    avg_loss.iloc[i] = (
        avg_loss.iloc[i-1] * (period-1) + loss.iloc[i]
    ) / period

rs = avg_gain / avg_loss.replace(0, np.nan)
df["RSI_14"] = 100 - 100 / (1 + rs)
df.loc[(avg_loss == 0) & (avg_gain > 0), "RSI_14"] = 100
df.loc[(avg_gain == 0) & (avg_loss > 0), "RSI_14"] = 0
df.loc[(avg_gain == 0) & (avg_loss == 0), "RSI_14"] = 50

# ---------------- MACD ----------------

ema12 = df["close"].ewm(
    span=12, adjust=False, min_periods=12
).mean()

ema26 = df["close"].ewm(
    span=26, adjust=False, min_periods=26
).mean()

df["MACD"] = ema12 - ema26

df["MACD_SIGNAL"] = df["MACD"].ewm(
    span=9, adjust=False, min_periods=9
).mean()

df["MACD_HIST"] = df["MACD"] - df["MACD_SIGNAL"]

# ---------------- ATR (Wilder) ----------------

prev_close = df["close"].shift(1)

tr = pd.concat([
    df["high"] - df["low"],
    (df["high"] - prev_close).abs(),
    (df["low"] - prev_close).abs()
], axis=1).max(axis=1)

df["ATR_14"] = np.nan
df.loc[period-1, "ATR_14"] = tr.iloc[:period].mean()

for i in range(period, len(df)):
    df.loc[i, "ATR_14"] = (
        df.loc[i-1, "ATR_14"] * (period-1) + tr.iloc[i]
    ) / period

df["ATR_PCT"] = df["ATR_14"] / df["close"] * 100

# ---------------- ROLLING VWAP 100 ----------------

# Approximation based on OHLCV typical price.
typical_price = (
    df["high"] + df["low"] + df["close"]
) / 3

rolling_volume = df["volume"].rolling(100).sum()
rolling_pv = (
    typical_price * df["volume"]
).rolling(100).sum()

df["VWAP_100"] = (
    rolling_pv / rolling_volume.replace(0, np.nan)
)

df["VWAP_DEV_PCT"] = (
    (df["close"] / df["VWAP_100"]) - 1
) * 100

# ---------------- VOLUME ANALYSIS ----------------

df["VOLUME_MA20"] = (
    df["volume"].rolling(20).mean()
)

df["VOLUME_RATIO"] = (
    df["volume"] / df["VOLUME_MA20"].replace(0, np.nan)
)

# ---------------- HISTORICAL MARKET STRUCTURE ----------------

# Prior 20 candles only: no look-ahead.
df["SWING_HIGH_20"] = (
    df["high"].shift(1).rolling(20).max()
)

df["SWING_LOW_20"] = (
    df["low"].shift(1).rolling(20).min()
)

# ---------------- FINAL INDICATOR SNAPSHOT ----------------

last = df.iloc[-1]
previous = df.iloc[-2]

required = [
    "EMA_20", "EMA_50", "EMA_200",
    "RSI_14", "MACD", "MACD_SIGNAL",
    "MACD_HIST", "ATR_14", "VWAP_100",
    "VOLUME_RATIO", "SWING_HIGH_20", "SWING_LOW_20"
]

indicators_valid = bool(
    np.isfinite(last[required].astype(float)).all()
)

snapshot = pd.DataFrame([
    {"Indicator": "Close Price", "Value": last["close"]},
    {"Indicator": "EMA 20", "Value": last["EMA_20"]},
    {"Indicator": "EMA 50", "Value": last["EMA_50"]},
    {"Indicator": "EMA 200", "Value": last["EMA_200"]},
    {"Indicator": "VWAP 100", "Value": last["VWAP_100"]},
    {"Indicator": "VWAP Deviation %", "Value": last["VWAP_DEV_PCT"]},
    {"Indicator": "RSI 14", "Value": last["RSI_14"]},
    {"Indicator": "MACD", "Value": last["MACD"]},
    {"Indicator": "MACD Signal", "Value": last["MACD_SIGNAL"]},
    {"Indicator": "MACD Histogram", "Value": last["MACD_HIST"]},
    {"Indicator": "ATR 14", "Value": last["ATR_14"]},
    {"Indicator": "ATR %", "Value": last["ATR_PCT"]},
    {"Indicator": "Volume Ratio", "Value": last["VOLUME_RATIO"]},
    {"Indicator": "Resistance 20", "Value": last["SWING_HIGH_20"]},
    {"Indicator": "Support 20", "Value": last["SWING_LOW_20"]}
])

print("=" * 72)
print("BTCUSDT — ADVANCED TECHNICAL ANALYSIS")
print("=" * 72)

display(snapshot.round(4))

print("Indicator Validation:",
      "PASS" if indicators_valid else "FAILED")

if not indicators_valid:
    print("WARNING: Trading decisions must be blocked.")
The final indicator snapshot provides a single analytical state for the latest closed candle. The system blocks trading decisions when any required indicator is invalid. This prevents incomplete technical data from entering the decision engine. btcusdt_advanced_trading_intell…
Cell 4 — Trading Decision and Risk Management
The fourth cell converts the technical indicators into a rule-based trading decision.
The system first identifies the market regime. A bullish trend requires:
\[ Price > EMA_{200} \]\[ EMA_{20}>EMA_{50}>EMA_{200} \]
A bearish trend applies the opposite structure. If neither condition is satisfied, the regime is classified as MIXED / RANGE. btcusdt_advanced_trading_intell…
Six confirmation factors are then evaluated. The system requires trend alignment, VWAP positioning, RSI momentum, MACD momentum, MACD histogram slope, and volume confirmation. A long candidate requires a bullish trend, price above VWAP, and at least four bullish confirmations. A short candidate requires the opposite conditions. btcusdt_advanced_trading_intell…
Risk management uses the account balance and predefined risk percentage:
\[ RiskBudget = AccountBalance \times RiskPerTrade \]
For a long setup, the stop loss is derived from both ATR and historical support. For a short setup, the stop loss uses ATR and historical resistance. Position size is then calculated as:
\[ PositionSize = \frac{RiskBudget} {RiskDistance} \]
The system also rejects setups with invalid levels or a risk/reward ratio below the minimum threshold. btcusdt_advanced_trading_intell…
# ============================================================
# CELL 4 — TRADING DECISION & RISK MANAGEMENT
# ============================================================

price = float(last["close"])
atr = float(last["ATR_14"])

# ---------------- TREND REGIME ----------------

bull_trend = (
    price > last["EMA_200"]
    and last["EMA_20"] > last["EMA_50"]
    and last["EMA_50"] > last["EMA_200"]
)

bear_trend = (
    price < last["EMA_200"]
    and last["EMA_20"] < last["EMA_50"]
    and last["EMA_50"] < last["EMA_200"]
)

regime = (
    "BULLISH TREND" if bull_trend else
    "BEARISH TREND" if bear_trend else
    "MIXED / RANGE"
)

# ---------------- CONFIRMATION MATRIX ----------------

conditions = {
    "EMA Trend": (
        bool(bull_trend),
        bool(bear_trend)
    ),
    "Price vs VWAP": (
        bool(price > last["VWAP_100"]),
        bool(price < last["VWAP_100"])
    ),
    "RSI Momentum": (
        bool(50 < last["RSI_14"] < 70),
        bool(30 < last["RSI_14"] < 50)
    ),
    "MACD Momentum": (
        bool(last["MACD_HIST"] > 0),
        bool(last["MACD_HIST"] < 0)
    ),
    "MACD Histogram Slope": (
        bool(last["MACD_HIST"] > previous["MACD_HIST"]),
        bool(last["MACD_HIST"] < previous["MACD_HIST"])
    ),
    "Volume Confirmation": (
        bool(last["VOLUME_RATIO"] >= 1.0),
        bool(last["VOLUME_RATIO"] >= 1.0)
    )
}

confirmation_df = pd.DataFrame([
    {
        "Factor": factor,
        "Bullish": bull,
        "Bearish": bear
    }
    for factor, (bull, bear) in conditions.items()
])

bull_score = int(confirmation_df["Bullish"].sum())
bear_score = int(confirmation_df["Bearish"].sum())

# Trend + VWAP mandatory, with at least 4/6 confirmations.
long_candidate = (
    bull_trend
    and price > last["VWAP_100"]
    and bull_score >= 4
)

short_candidate = (
    bear_trend
    and price < last["VWAP_100"]
    and bear_score >= 4
)

trade_status = "WAIT"
direction = "NONE"

if data_fresh and indicators_valid:
    if long_candidate:
        trade_status = "LONG SETUP CANDIDATE"
        direction = "LONG"
    elif short_candidate:
        trade_status = "SHORT SETUP CANDIDATE"
        direction = "SHORT"
else:
    trade_status = "BLOCKED — DATA QUALITY"

# ---------------- PRICE LEVELS ----------------

entry = np.nan
stop_loss = np.nan
take_profit = np.nan
risk_distance = np.nan
reward_distance = np.nan
rr_ratio = np.nan
position_qty = np.nan
notional = np.nan

risk_budget = ACCOUNT_BALANCE * RISK_PER_TRADE

support = float(last["SWING_LOW_20"])
resistance = float(last["SWING_HIGH_20"])

if direction == "LONG":
    entry = price
    stop_loss = min(
        entry - ATR_MULTIPLIER * atr,
        support - 0.2 * atr
    )

    risk_distance = entry - stop_loss

    # Structure-based upside target
    take_profit = max(
        resistance,
        entry + MIN_RR * risk_distance
    )

elif direction == "SHORT":
    entry = price
    stop_loss = max(
        entry + ATR_MULTIPLIER * atr,
        resistance + 0.2 * atr
    )

    risk_distance = stop_loss - entry

    # Structure-based downside target
    take_profit = min(
        support,
        entry - MIN_RR * risk_distance
    )

# ---------------- RISK CONTROL ----------------

if direction != "NONE":
    reward_distance = abs(take_profit - entry)

    if risk_distance > 0:
        rr_ratio = reward_distance / risk_distance
        position_qty = risk_budget / risk_distance
        notional = position_qty * entry

    valid_levels = (
        np.isfinite([
            entry, stop_loss, take_profit,
            rr_ratio, position_qty, notional
        ]).all()
        and stop_loss > 0
        and take_profit > 0
    )

    # Conservative spot-only constraint.
    # Short setups are informational, not executable spot shorts.
    if not valid_levels or rr_ratio < MIN_RR:
        trade_status = "WAIT — INVALID RISK LEVELS"
        direction = "NONE"

    elif direction == "LONG" and notional > ACCOUNT_BALANCE:
        trade_status = "WAIT — SPOT CAPITAL INSUFFICIENT"
        direction = "NONE"

    elif direction == "SHORT":
        trade_status = "BEARISH SETUP — SPOT SELL/AVOID ONLY"

# ---------------- REPORT ----------------

decision_df = pd.DataFrame([
    {"Metric": "Market Regime", "Value": regime},
    {"Metric": "Last Closed Price", "Value": price},
    {"Metric": "Bullish Score", "Value": f"{bull_score}/6"},
    {"Metric": "Bearish Score", "Value": f"{bear_score}/6"},
    {"Metric": "Assessment", "Value": trade_status},
    {"Metric": "Direction", "Value": direction},
    {"Metric": "Entry Reference", "Value": entry},
    {"Metric": "Stop Loss", "Value": stop_loss},
    {"Metric": "Take Profit", "Value": take_profit},
    {"Metric": "Risk/Reward", "Value": rr_ratio},
    {"Metric": "Risk Budget USDT", "Value": risk_budget},
    {"Metric": "Position Size BTC", "Value": position_qty},
    {"Metric": "Notional USDT", "Value": notional},
    {"Metric": "Data Fresh", "Value": data_fresh},
    {"Metric": "Indicators Valid", "Value": indicators_valid}
])

print("=" * 72)
print("BTCUSDT — TRADING DECISION ENGINE")
print("=" * 72)

print("MARKET REGIME :", regime)
print("BULL SCORE    :", bull_score, "/ 6")
print("BEAR SCORE    :", bear_score, "/ 6")
print("ASSESSMENT    :", trade_status)

print("\nCONFIRMATION MATRIX")
display(confirmation_df)

print("\nRISK MANAGEMENT & TRADE SCENARIO")
display(decision_df)

print("\nIMPORTANT:")
print("Signal based on last fully closed candle.")
print("Execution price, fees and slippage are not included.")
print("No live order is submitted.")
The risk engine deliberately does not submit live orders. It produces an analytical scenario based on the latest fully closed candle. Short setups are also treated as informational because the implementation applies a conservative spot-only constraint. btcusdt_advanced_trading_intell… btcusdt_advanced_trading_intell…
Cell 5 — Professional Trader Dashboard and Export
The fifth cell converts the analysis into a professional dashboard. It visualizes price and trend, volume, RSI, MACD, ATR volatility, VWAP deviation, multi-factor confirmation scores, and the executive trading assessment.
The dashboard uses the latest 120 candles and combines the major analytical components into a single figure. The price panel includes BTCUSDT closing price, EMA 20, EMA 50, EMA 200, rolling VWAP 100, support, resistance, and any valid entry, stop-loss, or take-profit levels. btcusdt_advanced_trading_intell…
The remaining panels display volume confirmation, RSI, MACD momentum, ATR volatility, VWAP deviation, and the bullish versus bearish confirmation score. An executive summary panel then reports the market regime, assessment, price, VWAP, RSI, volume ratio, ATR, trade levels, risk/reward, and data freshness. btcusdt_advanced_trading_intell…
# ============================================================
# CELL 5 — PROFESSIONAL TRADER DASHBOARD & EXPORT
# ============================================================

from matplotlib.ticker import FuncFormatter

# ---------------- PLOT DATA ----------------

plot_df = df.tail(120).copy()
x = np.arange(len(plot_df))

plt.style.use("dark_background")

fig = plt.figure(figsize=(19, 16))

gs = fig.add_gridspec(
    5, 2,
    height_ratios=[3.2, 1.2, 1.4, 1.4, 1.2],
    hspace=0.48,
    wspace=0.26
)

ax_price = fig.add_subplot(gs[0, :])
ax_volume = fig.add_subplot(gs[1, :], sharex=ax_price)
ax_rsi = fig.add_subplot(gs[2, 0], sharex=ax_price)
ax_macd = fig.add_subplot(gs[2, 1], sharex=ax_price)
ax_atr = fig.add_subplot(gs[3, 0], sharex=ax_price)
ax_vwap = fig.add_subplot(gs[3, 1], sharex=ax_price)
ax_score = fig.add_subplot(gs[4, 0])
ax_info = fig.add_subplot(gs[4, 1])

# ---------------- 1. PRICE & TREND ----------------

ax_price.plot(
    x, plot_df["close"],
    label="BTCUSDT Close",
    color="white", linewidth=1.9
)

ax_price.plot(
    x, plot_df["EMA_20"],
    label="EMA 20", color="#00d1ff", linewidth=1.2
)

ax_price.plot(
    x, plot_df["EMA_50"],
    label="EMA 50", color="#ffd166", linewidth=1.3
)

ax_price.plot(
    x, plot_df["EMA_200"],
    label="EMA 200", color="#ff6b6b", linewidth=1.4
)

ax_price.plot(
    x, plot_df["VWAP_100"],
    label="Rolling VWAP 100",
    color="#b388ff", linewidth=1.6
)

ax_price.axhline(
    support, color="#27ae60", linestyle=":",
    label=f"Support {support:,.0f}"
)

ax_price.axhline(
    resistance, color="#e67e22", linestyle=":",
    label=f"Resistance {resistance:,.0f}"
)

if direction != "NONE":
    ax_price.axhline(
        entry, color="#ffffff", linestyle="--",
        alpha=0.7, label="Entry reference"
    )

    ax_price.axhline(
        stop_loss, color="#ff4757", linestyle="--",
        label="Stop Loss"
    )

    ax_price.axhline(
        take_profit, color="#2ed573", linestyle="--",
        label="Take Profit"
    )

ax_price.set_title(
    f"{SYMBOL} | {TIMEFRAME.upper()} | {regime}",
    fontsize=16, fontweight="bold"
)

ax_price.set_ylabel("USDT")
ax_price.legend(loc="upper left", ncol=4, fontsize=9)
ax_price.grid(alpha=0.18)

ax_price.yaxis.set_major_formatter(
    FuncFormatter(lambda value, _: f"{value:,.0f}")
)

# ---------------- 2. VOLUME ----------------

volume_colors = np.where(
    plot_df["close"] >= plot_df["open"],
    "#2ecc71",
    "#e74c3c"
)

ax_volume.bar(
    x, plot_df["volume"],
    color=volume_colors, alpha=0.75
)

ax_volume.plot(
    x, plot_df["VOLUME_MA20"],
    color="yellow", linewidth=1.4,
    label="20-period Average Volume"
)

ax_volume.set_title("VOLUME CONFIRMATION")
ax_volume.set_ylabel("BTC")
ax_volume.legend()
ax_volume.grid(alpha=0.15)

# ---------------- 3. RSI ----------------

ax_rsi.plot(
    x, plot_df["RSI_14"],
    color="#00d1ff", linewidth=1.5
)

ax_rsi.axhline(70, color="red", linestyle="--")
ax_rsi.axhline(50, color="gray", linestyle=":")
ax_rsi.axhline(30, color="lime", linestyle="--")

ax_rsi.fill_between(
    x, 30, 70, color="gray", alpha=0.08
)

ax_rsi.set_ylim(0, 100)
ax_rsi.set_title(f"RSI 14 | {last['RSI_14']:.2f}")
ax_rsi.grid(alpha=0.2)

# ---------------- 4. MACD ----------------

macd_colors = np.where(
    plot_df["MACD_HIST"] >= 0,
    "#2ecc71", "#e74c3c"
)

ax_macd.bar(
    x, plot_df["MACD_HIST"],
    color=macd_colors, alpha=0.75
)

ax_macd.plot(
    x, plot_df["MACD"],
    color="#00d1ff", label="MACD"
)

ax_macd.plot(
    x, plot_df["MACD_SIGNAL"],
    color="orange", label="Signal"
)

ax_macd.axhline(0, color="gray", linewidth=0.8)
ax_macd.set_title("MACD MOMENTUM")
ax_macd.legend()
ax_macd.grid(alpha=0.2)

# ---------------- 5. VOLATILITY ----------------

ax_atr.plot(
    x, plot_df["ATR_PCT"],
    color="#ff9f43", linewidth=1.5
)

ax_atr.set_title(
    f"ATR VOLATILITY | {last['ATR_PCT']:.2f}%"
)

ax_atr.set_ylabel("ATR / Price (%)")
ax_atr.grid(alpha=0.2)

# ---------------- 6. VWAP DEVIATION ----------------

dev = plot_df["VWAP_DEV_PCT"].to_numpy()

ax_vwap.plot(
    x, dev,
    color="#b388ff", linewidth=1.5
)

ax_vwap.axhline(0, color="white", linestyle="--")

ax_vwap.fill_between(
    x, dev, 0, where=dev >= 0,
    color="#2ecc71", alpha=0.25
)

ax_vwap.fill_between(
    x, dev, 0, where=dev < 0,
    color="#e74c3c", alpha=0.25
)

ax_vwap.set_title(
    f"VWAP DEVIATION | {last['VWAP_DEV_PCT']:+.2f}%"
)

ax_vwap.set_ylabel("Deviation (%)")
ax_vwap.grid(alpha=0.2)

# ---------------- 7. SIGNAL SCORE ----------------

scores = [bull_score, bear_score]

ax_score.barh(
    ["Bullish", "Bearish"],
    scores,
    color=["#2ecc71", "#e74c3c"]
)

ax_score.set_xlim(0, 6)
ax_score.set_title("MULTI-FACTOR CONFIRMATION")
ax_score.set_xlabel("Confirmed factors (max 6)")

for i, score in enumerate(scores):
    ax_score.text(
        min(score + 0.1, 5.8), i,
        f"{score}/6",
        va="center", fontweight="bold"
    )

ax_score.grid(axis="x", alpha=0.15)

# ---------------- 8. EXECUTIVE DECISION ----------------

ax_info.axis("off")

def fmt(value, digits=2):
    try:
        if np.isfinite(float(value)):
            return f"{float(value):,.{digits}f}"
    except (TypeError, ValueError):
        pass
    return "N/A"


info_lines = [
    "TRADER INTELLIGENCE SUMMARY",
    "--------------------------------",
    f"Regime      : {regime}",
    f"Assessment  : {trade_status}",
    f"Close       : {fmt(price)} USDT",
    f"VWAP        : {fmt(last['VWAP_100'])}",
    f"MF VWAP     : {fmt(MARKETFLOW_VWAP)}",
    f"RSI         : {fmt(last['RSI_14'])}",
    f"Volume Ratio: {fmt(last['VOLUME_RATIO'])}x",
    f"ATR         : {fmt(atr)}",
    f"Entry Ref.  : {fmt(entry)}",
    f"Stop Loss   : {fmt(stop_loss)}",
    f"Take Profit : {fmt(take_profit)}",
    f"Risk/Reward : {fmt(rr_ratio)}",
    f"Data        : {'FRESH' if data_fresh else 'STALE'}"
]

ax_info.text(
    0.02, 0.98,
    "\n".join(info_lines),
    transform=ax_info.transAxes,
    va="top", ha="left",
    fontsize=9,
    family="monospace",
    linespacing=1.3,
    color="white"
)

# ---------------- TIME AXIS ----------------

ticks = np.linspace(
    0, len(plot_df)-1, 7, dtype=int
)

labels = (
    plot_df.iloc[ticks]["time"]
    .dt.strftime("%d %b %H:%M")
    .tolist()
)

for ax in [
    ax_price, ax_volume, ax_rsi,
    ax_macd, ax_atr, ax_vwap
]:
    ax.set_xticks(ticks)
    ax.set_xticklabels(labels, rotation=20, fontsize=8)

fig.suptitle(
    f"ADVANCED BTCUSDT TRADING INTELLIGENCE | {TIMEFRAME.upper()}",
    fontsize=19, fontweight="bold", y=0.995
)

fig.savefig(
    "BTCUSDT_Advanced_Trading_Dashboard.png",
    dpi=200, bbox_inches="tight"
)

plt.show()

# ---------------- EXECUTIVE REPORT ----------------

report = pd.DataFrame([
    {"Metric": "Timestamp UTC",
     "Value": str(last["close_datetime"])},
    {"Metric": "Symbol", "Value": SYMBOL},
    {"Metric": "Timeframe", "Value": TIMEFRAME},
    {"Metric": "Price", "Value": price},
    {"Metric": "Market Regime", "Value": regime},
    {"Metric": "VWAP 100", "Value": float(last["VWAP_100"])},
    {"Metric": "MarketFlow VWAP", "Value": MARKETFLOW_VWAP},
    {"Metric": "VWAP Deviation %",
     "Value": float(last["VWAP_DEV_PCT"])},
    {"Metric": "RSI 14", "Value": float(last["RSI_14"])},
    {"Metric": "MACD Histogram",
     "Value": float(last["MACD_HIST"])},
    {"Metric": "ATR %", "Value": float(last["ATR_PCT"])},
    {"Metric": "Bull Score", "Value": bull_score},
    {"Metric": "Bear Score", "Value": bear_score},
    {"Metric": "Assessment", "Value": trade_status},
    {"Metric": "Direction", "Value": direction},
    {"Metric": "Entry Reference", "Value": entry},
    {"Metric": "Stop Loss", "Value": stop_loss},
    {"Metric": "Take Profit", "Value": take_profit},
    {"Metric": "Risk Reward", "Value": rr_ratio},
    {"Metric": "Position BTC", "Value": position_qty},
    {"Metric": "Notional USDT", "Value": notional},
    {"Metric": "Data Fresh", "Value": data_fresh},
    {"Metric": "Indicator Valid", "Value": indicators_valid}
])

print("\n" + "=" * 72)
print("BTCUSDT — FINAL TRADING INTELLIGENCE REPORT")
print("=" * 72)

display(report)
display(confirmation_df)

# ---------------- EXPORT ----------------

df.to_csv(
    "BTCUSDT_Technical_Data.csv", index=False
)

report.to_csv(
    "BTCUSDT_Trading_Report.csv", index=False
)

confirmation_df.to_csv(
    "BTCUSDT_Confirmation_Matrix.csv", index=False
)

def safe_json(value):
    if isinstance(value, (np.integer,)):
        return int(value)
    if isinstance(value, (np.floating,)):
        return float(value) if np.isfinite(value) else None
    if isinstance(value, (np.bool_,)):
        return bool(value)
    if isinstance(value, (datetime, pd.Timestamp)):
        return value.isoformat()
    return str(value)

with open(
    "BTCUSDT_Trading_Report.json",
    "w", encoding="utf-8"
) as f:
    json.dump(
        {
            "symbol": SYMBOL,
            "timeframe": TIMEFRAME,
            "generated_at": datetime.now(
                timezone.utc
            ).isoformat(),
            "metrics": report.to_dict("records"),
            "confirmations": confirmation_df.to_dict("records"),
            "marketflow_metadata": MARKETFLOW_METADATA,
            "methodology": {
                "vwap": "100-candle rolling OHLCV approximation",
                "signal": "rule-based candidate, not predictive",
                "execution": "no orders submitted"
            }
        },
        f, indent=2, default=safe_json
    )

print("\nEXPORT COMPLETED")
print("1. BTCUSDT_Advanced_Trading_Dashboard.png")
print("2. BTCUSDT_Technical_Data.csv")
print("3. BTCUSDT_Trading_Report.csv")
print("4. BTCUSDT_Confirmation_Matrix.csv")
print("5. BTCUSDT_Trading_Report.json")
The final cell exports the dashboard as BTCUSDT_Advanced_Trading_Dashboard.png, the complete technical dataset as BTCUSDT_Technical_Data.csv, the executive report as BTCUSDT_Trading_Report.csv, the confirmation matrix as BTCUSDT_Confirmation_Matrix.csv, and the structured report as BTCUSDT_Trading_Report.json. btcusdt_advanced_trading_intell…
Result:
Conclusion
The BTCUSDT Advanced Trading Intelligence System integrates multiple technical dimensions into one rule-based analytical workflow. Instead of relying on a single indicator, the system evaluates trend structure through EMA alignment, market positioning through rolling VWAP, momentum through RSI and MACD, volatility through ATR, participation through volume ratio, and market structure through historical support and resistance.
The trading engine converts these variables into a six-factor confirmation matrix. A directional setup requires sufficient confirmation and must satisfy the mandatory trend and VWAP conditions. Risk management then determines the potential entry reference, stop loss, take profit, risk/reward ratio, and position size according to the predefined account-risk parameters. btcusdt_advanced_trading_intell…
The system is intentionally designed as a decision-support and trading-intelligence framework rather than a predictive model or automatic execution system. Its methodology explicitly states that the signal is rule-based and not predictive, while the code does not submit live orders. Execution price, fees, and slippage are also excluded from the calculation. btcusdt_advanced_trading_intell… btcusdt_advanced_trading_intell…
Therefore, the final output should be interpreted as a structured assessment of the current BTCUSDT technical condition. The framework is most useful when the market data are fresh, all required indicators are valid, and the confirmation factors provide sufficient alignment. When those requirements are not satisfied, the correct analytical outcome is to wait rather than force a trading signal.