Smart money consensus analysis is a financial research approach that examines the overlap between reported stock holdings of prominent investors. Rather than evaluating each investor's portfolio independently, this approach identifies securities held by multiple investors and ranks them according to the number of investors associated with each stock.
Investors such as Warren Buffett, Ray Dalio, and Bill Ackman have different investment philosophies, portfolio strategies, and approaches to risk management. Comparing their reported holdings can help analysts identify stocks that appear across multiple portfolios. However, overlapping ownership does not necessarily mean that these investors share the same investment rationale or that a stock is currently undervalued.
Python provides an efficient environment for automating this analysis. By connecting to a financial application programming interface (API), analysts can retrieve stock consensus data, transform JSON responses into structured tables, count the number of investors associated with each security, classify consensus levels, rank stocks, and visualize the results.
This article presents Smart Money Consensus Analysis Using Python, a framework that retrieves investor consensus data from the MarketFlow All-in-One Market Finance API through RapidAPI. The implementation analyzes three investor identifiers: warren-buffett, ray-dalio, and bill-ackman. It uses June 30, 2024, as the reporting date and requests up to 100 records.
The framework consists of five computational cells covering API configuration, data retrieval, data normalization, consensus classification, stock ranking, and dashboard visualization. The final output includes a ranked stock table, a summary of consensus levels, and a shortlist of five candidates for further research.
The objective is to create a reproducible workflow for analyzing reported institutional ownership overlap. The results are intended to support further financial research rather than serve as automatic buy or sell recommendations.
2. Methodology
The Smart Money Consensus Analysis workflow is divided into five computational cells.
Cell 1 — API configuration: imports the required Python libraries, configures RapidAPI authentication, and defines the reporting date, record limit, and investor identifiers.
Cell 2 — Data retrieval: requests the MarketFlow API usage guide and retrieves the guru consensus dataset for the selected investors.
Cell 3 — Data normalization: extracts stock records from the API response and converts them into a Pandas DataFrame.
Cell 4 — Consensus classification and ranking: selects the ticker, company, sector, investor count, and investor list, then classifies each stock according to the number of associated investors.
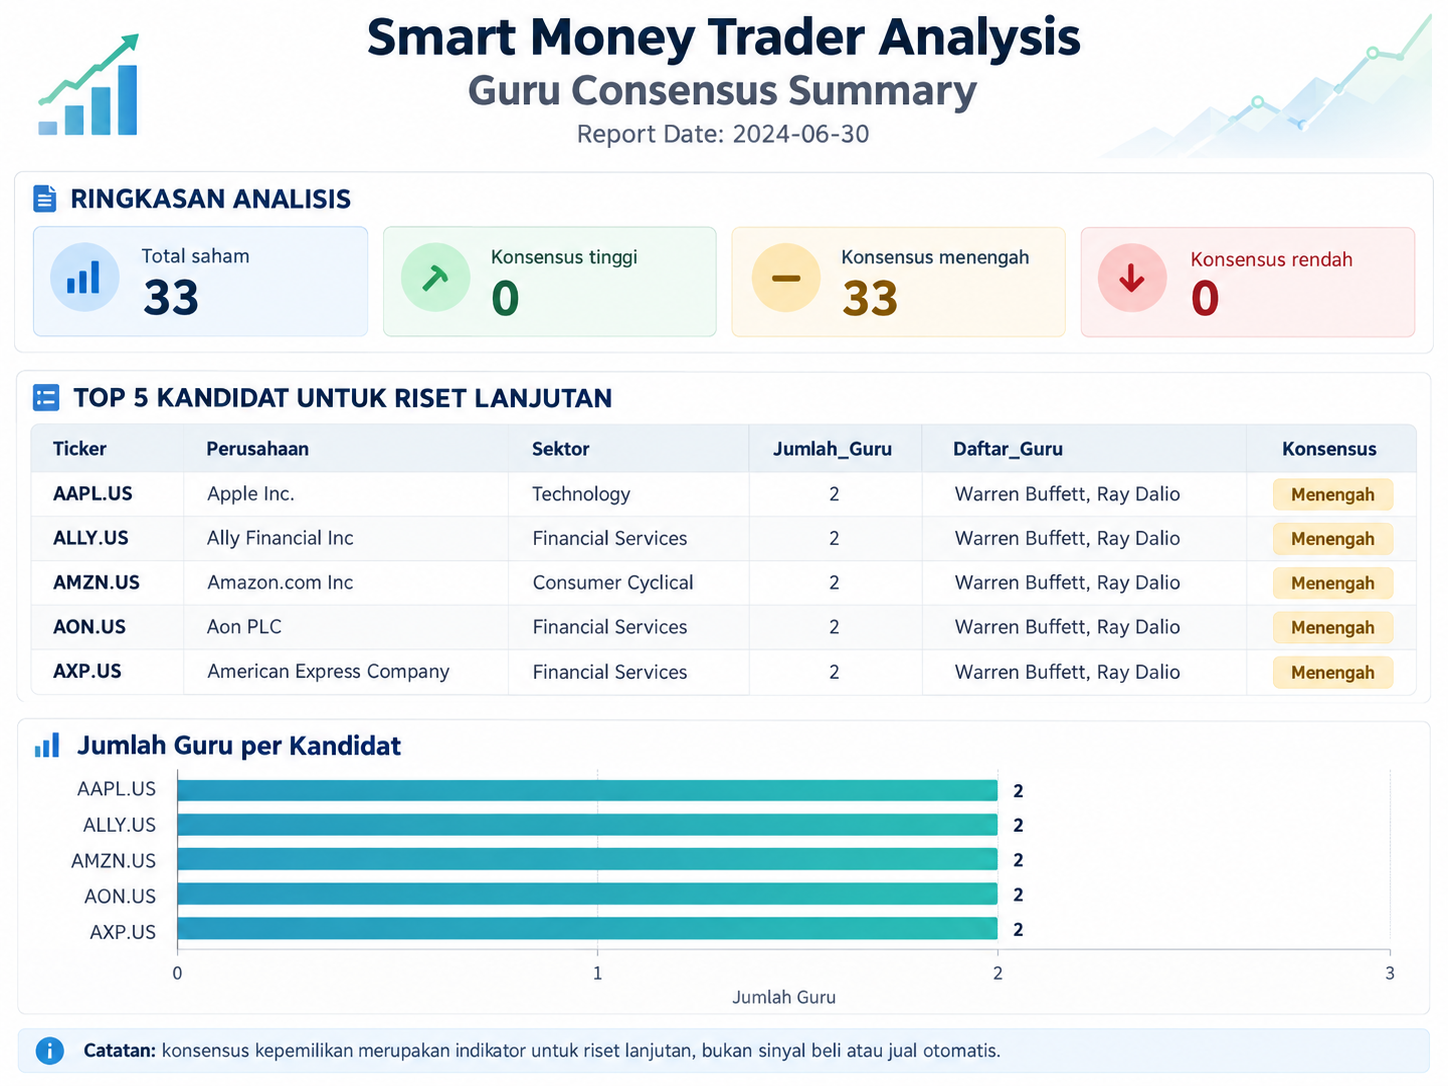
Cell 5 — Visualization and reporting: creates a chart of the ten highest-ranked stocks, summarizes the consensus distribution, and displays the five leading candidates for further research.
The framework uses Requests for HTTP communication, Pandas for data processing, NumPy for conditional classification, Seaborn and Matplotlib for visualization, and the IPython display functions to present tables and API responses in the notebook.
Consensus classification
The code defines consensus levels according to the number of investors associated with each stock:
Number of investors | Consensus classification |
|---|---|
3 or more | High |
2 | Medium |
1 | Low |
Other or missing values | Unknown |
The ranking prioritizes stocks associated with the largest number of investors. When two stocks have the same investor count, their tickers are sorted alphabetically.
This classification is a rule defined by the script, not an established financial rating standard. In particular, the label High means that at least three investors are associated with a stock in the returned dataset; it does not independently establish the stock's quality, valuation, or expected return.
3. Implementation and Python Code
The following implementation preserves the structure and logic of the uploaded smart_money_trader_analyzer.py file. It is divided into five cells so the code can be run sequentially in Google Colab.
Cell 1 — Importing Libraries and Configuring the API
The first cell imports the required libraries and establishes the API connection. The RapidAPI key is retrieved from the RAPIDAPI_KEY environment variable or requested interactively using getpass.
The script then defines the base URL, authentication headers, reporting date, record limit, and three investor identifiers. These parameters determine which consensus dataset is requested from the API.
Code — Cell 1
%pip -q install requests pandas numpy matplotlib seaborn

import os
import requests
import pandas as pd
import numpy as np
import matplotlib.pyplot as plt
import seaborn as sns
from getpass import getpass
from IPython.display import display, Markdown

API_KEY = os.getenv("RAPIDAPI_KEY") or getpass("Masukkan RapidAPI Key: ")

BASE_URL = (
    "https://marketflow-all-in-one-market-finance-api.p.rapidapi.com"
)

HEADERS = {
    "x-rapidapi-key": API_KEY,
    "x-rapidapi-host":
        "marketflow-all-in-one-market-finance-api.p.rapidapi.com"
}

REPORT_DATE = "2024-06-30"
LIMIT = 100

GURUS = [
    "warren-buffett",
    "ray-dalio",
    "bill-ackman"
]

print("Smart Money Analyzer siap digunakan.")
print("Tanggal laporan:", REPORT_DATE)
print("Jumlah investor acuan:", len(GURUS))
Cell 2 — Retrieving Data from the MarketFlow API
The second cell defines the fetch_api() function, which sends authenticated GET requests to the MarketFlow API. The function applies a 30-second timeout, checks the HTTP response status, and returns the decoded JSON data.
The script requests two resources: the /smartmoney/how-to-use endpoint for the API usage guide and the /smartmoney/guru-consensus endpoint for the consensus dataset.
The consensus request includes the reporting date, the maximum number of requested records, and a comma-separated list of investor identifiers. The returned data are displayed for inspection before the next cell processes the stock records.
Code — Cell 2
def fetch_api(endpoint, params=None):
    url = f"{BASE_URL}{endpoint}"

    response = requests.get(
        url,
        headers=HEADERS,
        params=params,
        timeout=30
    )

    response.raise_for_status()
    return response.json()


try:
    how_to_use = fetch_api("/smartmoney/how-to-use")

    guru_data = fetch_api(
        "/smartmoney/guru-consensus",
        params={
            "report_date": REPORT_DATE,
            "limit": LIMIT,
            "gurus_name": ",".join(GURUS)
        }
    )

    print("HOW-TO-USE API")
    display(how_to_use)

    print("\nGURU CONSENSUS API")
    display(guru_data)

except requests.exceptions.RequestException as e:
    print("Gagal mengambil data:", e)
    print("Periksa API key, kuota, koneksi, dan parameter endpoint.")
Cell 3 — Normalizing the Guru Consensus Dataset
The third cell extracts the stock records from the stocks field in the API response. If the field is empty, the script raises a ValueError and instructs the user to inspect the response from Cell 2.
When stock records are available, pd.json_normalize() converts them into a structured DataFrame. The script then displays the reporting date, the number of investors analyzed, the number of stock records returned, and the available column names.
This step establishes the dataset used for consensus classification and ranking. It also allows the analyst to inspect whether the API has returned the fields required by the next cell.
Code — Cell 3
# CELL 3 — PARSING DATA GURU CONSENSUS

import pandas as pd
import numpy as np
import matplotlib.pyplot as plt
import seaborn as sns
from IPython.display import display, Markdown

# Ambil saham langsung dari respons API
stocks = guru_data.get("stocks", [])

if not stocks:
    raise ValueError(
        "Data stocks kosong. Periksa respons guru_data pada Cell 2."
    )

# Jadikan setiap saham satu baris
df = pd.json_normalize(stocks, sep="_")

print("Tanggal laporan:", guru_data.get("report_date"))
print("Total guru dianalisis:", guru_data.get("total_gurus_analyzed"))
print("Total saham dari API:", len(stocks))
print("\nKolom tersedia:")
print(df.columns.tolist())

display(df.head())
Cell 4 — Classifying Consensus Levels and Ranking Stocks
The fourth cell selects five fields from the normalized dataset: ticker, company, sector, investor count, and investor details.
The columns are renamed to make the output easier to interpret. The investor details are converted into a comma-separated list using the name field, with the investor slug used as a fallback when a name is unavailable.
The script then applies np.select() to classify each stock according to the number of associated investors. Stocks with three or more investors receive a high consensus classification, those with two investors receive a medium classification, and those with one investor receive a low classification.
Finally, the ranking is sorted by investor count in descending order and ticker in ascending order. The twenty highest-ranked stocks are displayed for further inspection.
Code — Cell 4
# CELL 4 — RANKING SMART MONEY CONSENSUS

ranking = df[[
    "ticker",
    "company",
    "sector",
    "guru_count",
    "gurus"
]].copy()

ranking = ranking.rename(columns={
    "ticker": "Ticker",
    "company": "Perusahaan",
    "sector": "Sektor",
    "guru_count": "Jumlah_Guru"
})

# Ambil nama investor dari daftar gurus pada JSON
ranking["Daftar_Guru"] = ranking["gurus"].apply(
    lambda items: ", ".join(
        item.get("name", item.get("slug", "Unknown"))
        for item in items
    ) if isinstance(items, list) else ""
)

ranking = ranking.drop(columns=["gurus"])

ranking["Konsensus"] = np.select(
    [
        ranking["Jumlah_Guru"] >= 3,
        ranking["Jumlah_Guru"] == 2,
        ranking["Jumlah_Guru"] == 1
    ],
    [
        "Tinggi",
        "Menengah",
        "Rendah"
    ],
    default="Tidak diketahui"
)

ranking = ranking.sort_values(
    ["Jumlah_Guru", "Ticker"],
    ascending=[False, True]
).reset_index(drop=True)

print("TOP 20 SAHAM BERDASARKAN KONSENSUS")
display(ranking.head(20))
Cell 5 — Visualization, Summary, and Research Candidates
The fifth cell generates a horizontal bar chart showing the ten highest-ranked stocks according to the number of associated investors. Seaborn uses the consensus classification to distinguish the categories in the visualization.
The script then summarizes the total number of stocks and counts how many have high, medium, or low consensus classifications. It also displays the top five candidates with their ticker symbols, company names, sectors, investor counts, investor lists, and consensus categories.
The final message emphasizes that overlapping reported ownership is a starting point for further research, not an automatic trading signal.
Code — Cell 5
# CELL 5 — VISUALISASI DAN KESIMPULAN

if ranking.empty:
    print("Ranking kosong. Periksa kembali data API.")
else:
    top = ranking.head(10).sort_values(
        "Jumlah_Guru",
        ascending=True
    )

    plt.figure(figsize=(11, 6))
    sns.barplot(
        data=top,
        x="Jumlah_Guru",
        y="Ticker",
        hue="Konsensus",
        dodge=False
    )

    plt.title("Top 10 Saham berdasarkan Guru Consensus")
    plt.xlabel("Jumlah Investor yang Memiliki Saham")
    plt.ylabel("Ticker Saham")
    plt.tight_layout()
    plt.show()

    print("RINGKASAN ANALISIS")
    print("-" * 40)
    print("Total saham:", len(ranking))
    print(
        "Konsensus tinggi:",
        (ranking["Jumlah_Guru"] >= 3).sum()
    )
    print(
        "Konsensus menengah:",
        (ranking["Jumlah_Guru"] == 2).sum()
    )
    print(
        "Konsensus rendah:",
        (ranking["Jumlah_Guru"] == 1).sum()
    )

    print("\nTOP 5 KANDIDAT UNTUK RISET LANJUTAN")
    display(ranking.head(5)[[
        "Ticker",
        "Perusahaan",
        "Sektor",
        "Jumlah_Guru",
        "Daftar_Guru",
        "Konsensus"
    ]])

    print(
        "\nCatatan: konsensus kepemilikan merupakan indikator untuk "
        "riset lanjutan, bukan sinyal beli atau jual otomatis."
    )
Resultnya :
4. Results and Discussion
4.1. Investor Consensus Data Retrieval
The data retrieval module requests consensus information for Warren Buffett, Ray Dalio, and Bill Ackman using the selected reporting date. The returned dataset contains stock-level records that can be processed to identify the number of associated investors and their reported identities.
The number of stock records indicates the size of the dataset returned by the API. The number of investors analyzed indicates the investor coverage reported by the endpoint. These two values should be interpreted separately because a larger stock dataset does not necessarily mean that the API has returned a complete record of every holding.
The reporting date is June 30, 2024. Therefore, the results should be interpreted as historical data associated with that date rather than as a representation of the investors' current portfolios.
4.2. Stock Consensus Classification
The framework classifies stocks according to the number of investors associated with each record. A stock linked to all three selected investors receives a high consensus classification, a stock linked to two receives a medium classification, and a stock linked to one receives a low classification.
This classification provides a straightforward way to compare overlapping reported holdings. Stocks appearing across multiple investor records can be selected for further examination of company fundamentals, valuation, sector exposure, and historical performance.
However, the consensus score measures the overlap represented in the returned dataset. It does not establish that the investors purchased the stock at the same time, share the same investment thesis, or maintain identical portfolio objectives.
4.3. Stock Ranking and Investor Overlap
The ranking procedure sorts stocks by the number of associated investors, followed by ticker symbol. This makes the output consistent and allows analysts to inspect the stocks with the greatest reported overlap first.
The top-twenty table provides a broader overview of the dataset, while the top-five shortlist offers a smaller set of candidates for additional research. Each candidate includes its ticker, company name, sector, investor count, and the investor names associated with the record.
These rankings can help prioritize research, but they should not be confused with a ranking of expected returns. A stock appearing in several reported portfolios may still be overvalued, exposed to business risks, or unsuitable for a particular investor's objectives.
4.4. Consensus Distribution and Visualization
The dashboard summarizes the number of stocks in each consensus category and visualizes the ten highest-ranked stocks using a horizontal bar chart.
The chart helps compare investor overlap across securities, while the summary provides a numerical overview of how the returned dataset is distributed among high, medium, and low consensus classifications.
Because the classification thresholds are defined by the script, the category labels should be interpreted as analytical conventions rather than standardized financial ratings. The results are also limited by the number of investors selected and the records returned by the API.
4.5. Limitations and Future Improvements
Several limitations should be considered when interpreting the results.
First, the framework analyzes only three investor identifiers. The resulting consensus scores therefore reflect overlap among the selected investors rather than the broader institutional investment market.
Second, the dataset uses a historical reporting date. Reported holdings may change after the selected date, and portfolio disclosures may not reflect recent transactions.
Third, the script depends on the API returning the expected fields, including ticker, company, sector, guru_count, and gurus. If the response structure changes, the normalization or ranking steps may fail.
Fourth, the consensus score counts the number of investors associated with a stock but does not account for position size, portfolio weight, purchase timing, or changes in ownership. A stock with three associated investors is not necessarily more attractive than a stock with two.
Future improvements could include comparing multiple reporting dates, incorporating position weights, tracking changes in reported holdings, and combining consensus scores with company fundamentals and valuation indicators. These extensions would provide a more comprehensive basis for evaluating the significance of investor overlap.
5. Conclusion
Smart Money Consensus Analysis Using Python demonstrates how financial API data can be used to identify overlapping reported stock holdings among selected investors. The framework retrieves consensus data from MarketFlow, normalizes the JSON response, classifies stocks according to investor count, ranks securities, and visualizes the highest-ranked results.
The resulting tables and charts provide a structured overview of the stocks that appear across multiple investor records. This information can help analysts prioritize securities for further research and examine patterns of reported institutional ownership.
Nevertheless, consensus classification is a descriptive measure rather than a prediction of future performance. Its reliability depends on the completeness of the API response, the selected investors, the reporting date, and the definitions used by the data provider.
Future development should focus on tracking changes across reporting periods, evaluating portfolio weights, and integrating additional financial indicators. With these improvements, the framework can serve as a useful starting point for systematic institutional ownership research and financial-data analysis.