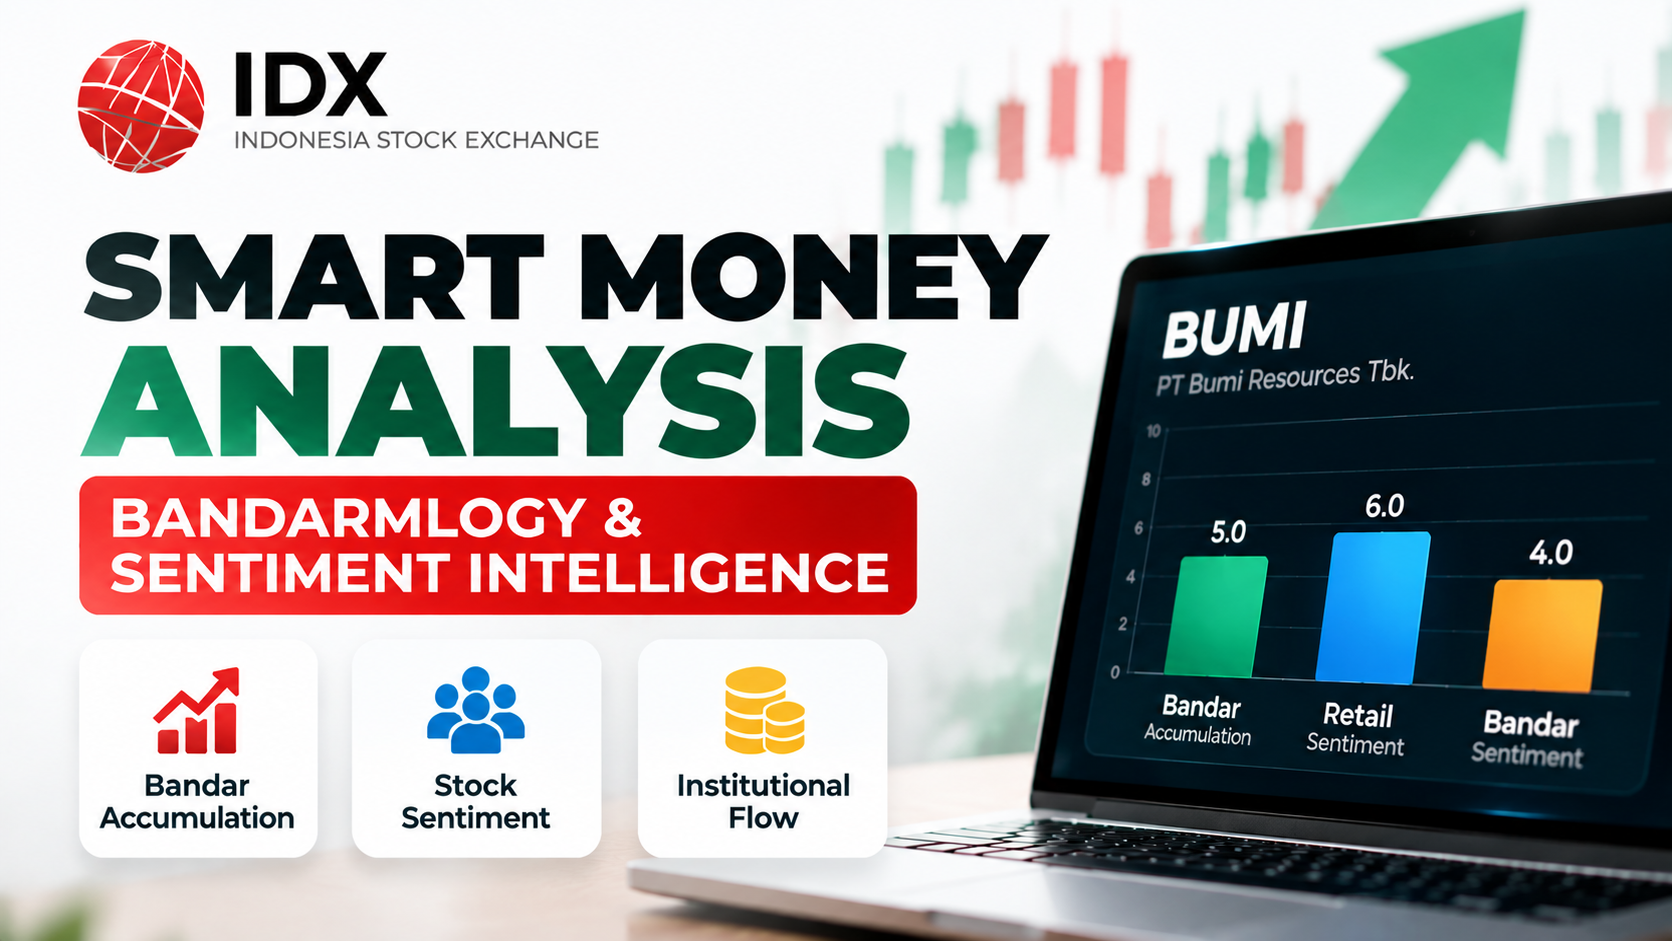
Understanding smart money activity is an important aspect of stock market analysis because large market participants can influence price movement and trading behavior. Traditional price analysis alone may not fully describe accumulation patterns, institutional activity, and market sentiment.
This project develops a Smart Money Analysis System Using IDX Bandarmology to evaluate potential market participant activity through bandar accumulation data and sentiment analysis. The system retrieves IDX API data, processes important indicators, visualizes smart money conditions, and generates a composite score.
The analysis workflow consists of five main stages:
Library installation and import configuration
IDX API data retrieval
Bandar and sentiment data processing
Smart money visualization
Trading insight generation
The system uses Python with Requests for API communication, Pandas for data processing, Matplotlib and Seaborn for visualization. The analysis uses BUMI as the sample stock and retrieves bandar accumulation data for 30 days and sentiment data for 7 days. smart_money_analysis_idx_bandar…
Cell 1 — Install Library and Import
The first cell prepares the required Python environment by installing and importing the libraries needed for API retrieval, data processing, and visualization. smart_money_analysis_idx_bandar…
!pip install requests pandas matplotlib seaborn -q

import requests
import pandas as pd
import matplotlib.pyplot as plt
import seaborn as sns
import json
Cell 2 — Input Symbol and API Fetch
The second cell defines the stock symbol, configures IDX RapidAPI authentication, and retrieves two main datasets:
Bandar accumulation analysis
Stock sentiment analysis
The API response provides the foundation for evaluating smart money behavior. smart_money_analysis_idx_bandar…
API_KEY = "YOUR_API_KEY"

symbol = "BUMI"

headers = {
    "x-rapidapi-host": "indonesia-stock-exchange-idx.p.rapidapi.com",
    "x-rapidapi-key": API_KEY
}


# Bandar Accumulation
url_bandar = f"https://indonesia-stock-exchange-idx.p.rapidapi.com/api/analysis/bandar/accumulation/{symbol}?days=30"


# Sentiment
url_sentiment = f"https://indonesia-stock-exchange-idx.p.rapidapi.com/api/analysis/sentiment/{symbol}?days=7"


bandar_response = requests.get(url_bandar, headers=headers)
sentiment_response = requests.get(url_sentiment, headers=headers)


bandar_data = bandar_response.json()
sentiment_data = sentiment_response.json()


print("Bandar Data Loaded")
print("Sentiment Data Loaded")
Cell 3 — Cleaning Data and Analysis Table
The third cell extracts important indicators from API responses and converts them into a structured analysis table.
The extracted variables include:
Bandar score
Bandar status
Confidence level
Foreign flow
Accumulation days
Risk level
Recommendation
Current price
smart_money_analysis_idx_bandar…
# ==========================
# EXTRACT API DATA
# ==========================

bandar = bandar_data["data"]
sentiment = sentiment_data["data"]


# Buat dataframe summary

analysis_df = pd.DataFrame({

    "Symbol":[bandar["symbol"]],

    "Bandar Score":[bandar["accumulation_score"]],

    "Bandar Status":[bandar["status"]],

    "Confidence":[bandar["confidence"]],

    "Foreign Flow":[
        bandar["indicators"]["foreign_flow"]["net_foreign_flow"]
    ],

    "Accumulation Days":[
        bandar["indicators"]["accumulation_days"]
    ],

    "Risk":[
        bandar["risk_level"]
    ],

    "Recommendation":[
        bandar["recommendation"]
    ],

    "Current Price":[
        bandar["entry_zone"]["current_price"]
    ]

})


display(analysis_df)
Cell 4 — Smart Money Visualization
The fourth cell visualizes smart money indicators using three components:
Bandar accumulation score
Retail sentiment score
Bandar sentiment score
The visualization provides a simple comparison of market participant activity. smart_money_analysis_idx_bandar…
import matplotlib.pyplot as plt


# ==========================
# SMART MONEY VISUALIZATION
# ==========================


scores = {

    "Bandar": bandar["accumulation_score"],

    "Retail Sentiment": sentiment["retail_sentiment"]["score"],

    "Bandar Sentiment": sentiment["bandar_sentiment"]["score"]

}


plt.figure(figsize=(8,5))


plt.bar(
    scores.keys(),
    scores.values()
)


plt.ylim(0,10)

plt.title(
    f"{symbol} Smart Money Indicator"
)

plt.ylabel("Score (0-10)")

plt.grid(axis="y")


plt.show()
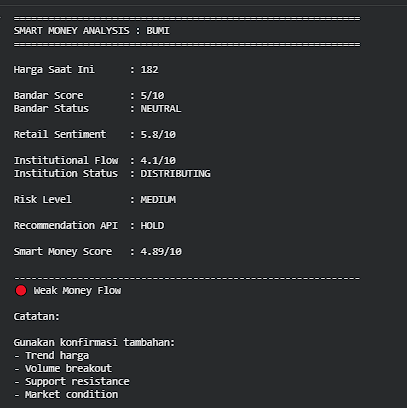
Cell 5 — Trading Insight
The final cell creates a composite smart money score by combining:
Bandar accumulation score: 50%
Retail sentiment score: 20%
Institutional sentiment score: 30%
The final score is classified into:
Strong Accumulation Signal
Neutral / Wait Confirmation
Weak Money Flow
The system also provides additional confirmation factors such as price trend, volume breakout, support resistance, and market condition. smart_money_analysis_idx_bandar…
# ==========================
# TRADING INSIGHT
# ==========================


bandar_score = bandar["accumulation_score"]

retail_score = sentiment["retail_sentiment"]["score"]

inst_score = sentiment["bandar_sentiment"]["score"]


# Composite score

smart_money_score = (
    bandar_score*0.5 +
    retail_score*0.2 +
    inst_score*0.3
)


print("="*60)
print(f"SMART MONEY ANALYSIS : {symbol}")
print("="*60)


print(f"""
Harga Saat Ini      : {bandar['entry_zone']['current_price']}

Bandar Score        : {bandar_score}/10
Bandar Status       : {bandar['status']}

Retail Sentiment    : {retail_score}/10

Institutional Flow  : {inst_score}/10
Institution Status  : {sentiment['bandar_sentiment']['status']}

Risk Level          : {bandar['risk_level']}

Recommendation API  : {bandar['recommendation']}

Smart Money Score   : {smart_money_score:.2f}/10
""")


print("-"*60)


if smart_money_score >= 7:

    print("🟢 Strong Accumulation Signal")

elif smart_money_score >=5:

    print("🟡 Neutral / Wait Confirmation")

else:

    print("🔴 Weak Money Flow")


print("\nCatatan:")
print(
"""
Gunakan konfirmasi tambahan:
- Trend harga
- Volume breakout
- Support resistance
- Market condition
"""
)
Conclusion
This project successfully develops a Smart Money Analysis System Using IDX Bandarmology by combining bandar accumulation analysis and stock sentiment evaluation.
The system processes IDX API data to identify accumulation conditions, evaluate market participant behavior, and generate a composite smart money score. The visualization component helps compare bandar activity, retail sentiment, and institutional sentiment in a structured format.
The final trading insight provides a simplified interpretation of smart money conditions based on weighted indicators. However, the output should not be treated as an independent trading decision because additional confirmation is still required.
Further validation should consider price trends, volume breakout conditions, support and resistance levels, fundamental analysis, and broader market conditions.
Overall, this IDX Bandarmology framework demonstrates how API-based market data can be transformed into a systematic smart money monitoring tool for stock market research.