
By the end of this workflow, the result is an IDX sector stock screener that can be used as a foundation for watchlists, dashboards, sector mapping, or deeper stock analysis.
An IDX sector stock screener is useful when investors want to filter listed companies by sector and subsector. Instead of analyzing all IDX-listed companies at once, this project helps organize sector data and company data into a cleaner structure using Python.
In this tutorial, we will build an IDX sector stock screener using getAllSectors and getSectorCompanies. The workflow retrieves IDX sector reference data, collects companies from a selected sector and subsector, cleans the result, and creates a structured output for sector-based stock analysis.
This tutorial shows how to build an IDX sector stock screener using Python, getAllSectors, and getSectorCompanies. The goal is to collect sector data, retrieve companies from a selected sector and subsector, clean the result, and create a structured output for sector-based stock analysis.
Instead of analyzing all listed companies at once, an IDX sector stock screener helps users focus only on companies that belong to a specific sector category. This makes the analysis more targeted and easier to extend into dashboards, watchlists, or deeper stock screening workflows.
Cell 1 — Import Library + Config API
import os
import json
import time
from typing import Any, Dict, List, Optional, Union

import requests
import pandas as pd
import matplotlib.pyplot as plt


RAPIDAPI_HOST = "indonesia-stock-exchange-idx.p.rapidapi.com"
BASE_URL = f"https://{RAPIDAPI_HOST}"

# Ganti dengan RapidAPI Key Anda
RAPIDAPI_KEY = "ISI_RAPIDAPI_KEY_ANDA_DI_SINI"

# Alternatif jika memakai environment variable:
# RAPIDAPI_KEY = os.getenv("RAPIDAPI_KEY")

if not RAPIDAPI_KEY or RAPIDAPI_KEY == "ISI_RAPIDAPI_KEY_ANDA_DI_SINI":
    raise ValueError("Masukkan RapidAPI Key Anda dulu pada variabel RAPIDAPI_KEY.")

HEADERS = {
    "Content-Type": "application/json",
    "x-rapidapi-host": RAPIDAPI_HOST,
    "x-rapidapi-key": RAPIDAPI_KEY,
}

print("API configuration ready.")
Explanation
Cell 1 prepares the notebook environment and API configuration.
The notebook imports several libraries. os is prepared for environment variable usage. json is used to preview API responses in readable JSON format. time is used to add delays between API requests. requests is used to call API endpoints. pandas is used to process API responses into dataframes. matplotlib.pyplot is used later for visualization.
The typing module imports Any, Dict, List, Optional, and Union. These are used in helper functions to make the code structure clearer.
The API setup starts with RAPIDAPI_HOST, which stores the RapidAPI host for the Indonesia Stock Exchange IDX API. BASE_URL is then created from that host.
The RAPIDAPI_KEY variable stores the API key. In this article, the real key is replaced with a placeholder for security.
The notebook also provides an alternative option using an environment variable:
# RAPIDAPI_KEY = os.getenv("RAPIDAPI_KEY")This is useful if the notebook is used in a safer or production-like environment.
The validation block checks whether the API key is empty or still using the placeholder. If so, the notebook raises a ValueError.
Finally, the HEADERS dictionary is created. It contains Content-Type, x-rapidapi-host, and x-rapidapi-key. These headers are used in every API request.
Cell 2 — Helper Function
def request_get(
    endpoint: str,
    params: Optional[Dict[str, Any]] = None,
    timeout: int = 30,
    max_retries: int = 5,
    wait_seconds: int = 3
) -> Union[Dict[str, Any], List[Any]]:

    url = f"{BASE_URL}{endpoint}"

    for attempt in range(1, max_retries + 1):
        time.sleep(wait_seconds)

        response = requests.get(
            url,
            headers=HEADERS,
            params=params,
            timeout=timeout
        )

        try:
            payload = response.json()
        except Exception:
            payload = response.text

        if response.ok:
            return payload

        if response.status_code == 429:
            print(
                f"Rate limit 429. Percobaan {attempt}/{max_retries}. "
                f"Tunggu {wait_seconds} detik..."
            )
            time.sleep(wait_seconds)
            continue

        raise RuntimeError(
            f"Request gagal. Status: {response.status_code}\n"
            f"URL: {response.url}\n"
            f"Response: {payload}"
        )

    raise RuntimeError(
        f"Request gagal karena rate limit 429 setelah {max_retries} percobaan."
    )


def find_first_list(obj: Any) -> List[Dict[str, Any]]:
    if isinstance(obj, list):
        return obj if all(isinstance(item, dict) for item in obj) else []

    if isinstance(obj, dict):
        priority_keys = [
            "data", "result", "results", "items", "rows",
            "content", "calendar", "events", "rups", "economic"
        ]

        for key in priority_keys:
            if key in obj:
                found = find_first_list(obj[key])
                if found:
                    return found

        for value in obj.values():
            found = find_first_list(value)
            if found:
                return found

    return []


def json_to_dataframe(payload: Union[Dict[str, Any], List[Any]]) -> pd.DataFrame:
    records = find_first_list(payload)

    if records:
        return pd.json_normalize(records)

    if isinstance(payload, dict):
        return pd.json_normalize(payload)

    return pd.DataFrame()


def detect_column(df: pd.DataFrame, keywords: List[str]) -> Optional[str]:
    if df.empty:
        return None

    lower_map = {col.lower(): col for col in df.columns}

    for keyword in keywords:
        if keyword.lower() in lower_map:
            return lower_map[keyword.lower()]

    for col in df.columns:
        col_lower = col.lower()
        if any(keyword.lower() in col_lower for keyword in keywords):
            return col

    return None


def safe_series(df: pd.DataFrame, col: Optional[str], default_value=None) -> pd.Series:
    if col is None or col not in df.columns:
        return pd.Series([default_value] * len(df), index=df.index)

    return df[col]
Explanation
Cell 2 contains helper functions that make the notebook more flexible when working with API responses.
The first function is request_get. It sends a GET request to an API endpoint. The endpoint is joined with BASE_URL, then the request is sent with requests.get.
This function also includes retry handling. If the API returns status code 429, which means rate limit, the notebook waits and retries the request. This is useful when calling multiple endpoints from the same API service.
If the request succeeds, the function returns the payload. If another error occurs, it raises a RuntimeError that includes the status code, request URL, and response payload.
The second function is find_first_list. It searches through a nested JSON object and tries to find the first list of dictionaries. This is important because API responses may store event records inside different keys such as data, calendar, events, rups, or economic.
The third function is json_to_dataframe. It converts an API response into a pandas dataframe. If the helper function finds a list of records, it normalizes that list using pd.json_normalize. If not, it normalizes the dictionary directly.
The fourth function is detect_column. It detects column names based on possible keywords. This helps when API response fields vary across endpoints.
The final function is safe_series. It safely returns a dataframe column. If the column does not exist, it returns a default-value series with the same index as the dataframe.
Together, these helper functions make the notebook more robust when handling different response structures from getRupsCalendar and getEconomicCalendar.
Cell 3 — Ambil Data dari Dua API
print("Mengambil data getRupsCalendar...")
rups_payload = request_get(
    endpoint="/api/calendar/rups",
    wait_seconds=3
)

time.sleep(5)

print("Mengambil data getEconomicCalendar...")
economic_payload = request_get(
    endpoint="/api/calendar/economic",
    wait_seconds=3
)


rups_df = json_to_dataframe(rups_payload)
economic_df = json_to_dataframe(economic_payload)

rups_df["source_api"] = "getRupsCalendar"
economic_df["source_api"] = "getEconomicCalendar"

print("RUPS Calendar shape:", rups_df.shape)
print("Economic Calendar shape:", economic_df.shape)

display(rups_df.head())
display(economic_df.head())

print("Preview RUPS Calendar JSON:")
print(json.dumps(rups_payload, indent=2, ensure_ascii=False)[:1500])

print("\nPreview Economic Calendar JSON:")
print(json.dumps(economic_payload, indent=2, ensure_ascii=False)[:1500])
Explanation
Cell 3 retrieves data from the two main APIs.
The first request calls:
/api/calendar/rups
This endpoint represents getRupsCalendar. It retrieves RUPS calendar data from the IDX API.
After that, the notebook waits for 5 seconds using:
time.sleep(5)
This manual delay helps reduce the possibility of hitting the API rate limit.
The second request calls:
/api/calendar/economic
This endpoint represents getEconomicCalendar. It retrieves economic calendar data.
Both API responses are converted into dataframes using json_to_dataframe.
The resulting dataframes are:
rups_df
and
economic_df
The notebook then adds a source_api column to each dataframe. For RUPS data, the value is getRupsCalendar. For economic calendar data, the value is getEconomicCalendar.
Finally, the notebook prints the shape of both dataframes, displays the first rows, and prints a raw JSON preview for each payload.
This cell is the main data collection step for the IDX market event calendar.
Cell 4 — Cleaning Data RUPS dan Economic Calendar
# Deteksi kolom RUPS Calendar
rups_ticker_col = detect_column(
    rups_df,
    ["ticker", "symbol", "stockCode", "stock_code", "code", "securityCode"]
)

rups_name_col = detect_column(
    rups_df,
    ["name", "stockName", "stock_name", "companyName", "company_name", "issuer"]
)

rups_date_col = detect_column(
    rups_df,
    ["date", "rupsDate", "rups_date", "eventDate", "event_date", "scheduleDate"]
)

rups_time_col = detect_column(
    rups_df,
    ["time", "rupsTime", "eventTime", "event_time"]
)

rups_type_col = detect_column(
    rups_df,
    ["type", "rupsType", "rups_type", "eventType", "event_type"]
)

rups_location_col = detect_column(
    rups_df,
    ["location", "place", "venue", "address"]
)


# Deteksi kolom Economic Calendar
economic_date_col = detect_column(
    economic_df,
    ["date", "eventDate", "event_date", "calendarDate", "calendar_date"]
)

economic_time_col = detect_column(
    economic_df,
    ["time", "eventTime", "event_time"]
)

economic_title_col = detect_column(
    economic_df,
    ["title", "event", "eventName", "event_name", "name", "indicator"]
)

economic_country_col = detect_column(
    economic_df,
    ["country", "region", "currency"]
)

economic_actual_col = detect_column(
    economic_df,
    ["actual", "actualValue", "actual_value"]
)

economic_forecast_col = detect_column(
    economic_df,
    ["forecast", "forecastValue", "forecast_value", "consensus"]
)

economic_previous_col = detect_column(
    economic_df,
    ["previous", "previousValue", "previous_value"]
)

economic_importance_col = detect_column(
    economic_df,
    ["importance", "impact", "priority", "level"]
)


print("Detected RUPS columns:")
print("ticker   :", rups_ticker_col)
print("name     :", rups_name_col)
print("date     :", rups_date_col)
print("time     :", rups_time_col)
print("type     :", rups_type_col)
print("location :", rups_location_col)

print("\nDetected Economic columns:")
print("date       :", economic_date_col)
print("time       :", economic_time_col)
print("title      :", economic_title_col)
print("country    :", economic_country_col)
print("actual     :", economic_actual_col)
print("forecast   :", economic_forecast_col)
print("previous   :", economic_previous_col)
print("importance :", economic_importance_col)


rups_clean = pd.DataFrame({
    "event_category": "RUPS",
    "ticker": (
        safe_series(rups_df, rups_ticker_col, "")
        .astype(str)
        .str.upper()
        .str.strip()
    ),
    "company_name": safe_series(rups_df, rups_name_col, ""),
    "event_date": safe_series(rups_df, rups_date_col, ""),
    "event_time": safe_series(rups_df, rups_time_col, ""),
    "event_title": safe_series(rups_df, rups_type_col, "RUPS"),
    "location": safe_series(rups_df, rups_location_col, ""),
    "country": "",
    "actual": "",
    "forecast": "",
    "previous": "",
    "importance": "",
    "source_api": "getRupsCalendar"
})


economic_clean = pd.DataFrame({
    "event_category": "Economic Calendar",
    "ticker": "",
    "company_name": "",
    "event_date": safe_series(economic_df, economic_date_col, ""),
    "event_time": safe_series(economic_df, economic_time_col, ""),
    "event_title": safe_series(economic_df, economic_title_col, ""),
    "location": "",
    "country": safe_series(economic_df, economic_country_col, ""),
    "actual": safe_series(economic_df, economic_actual_col, ""),
    "forecast": safe_series(economic_df, economic_forecast_col, ""),
    "previous": safe_series(economic_df, economic_previous_col, ""),
    "importance": safe_series(economic_df, economic_importance_col, ""),
    "source_api": "getEconomicCalendar"
})


# Ubah tanggal menjadi datetime agar bisa diurutkan
rups_clean["event_date_parsed"] = pd.to_datetime(
    rups_clean["event_date"],
    errors="coerce"
)

economic_clean["event_date_parsed"] = pd.to_datetime(
    economic_clean["event_date"],
    errors="coerce"
)


display(rups_clean.head(20))
display(economic_clean.head(20))
Explanation
Cell 4 cleans and standardizes both datasets.
The first section detects columns from rups_df. The notebook searches for ticker, company name, event date, event time, RUPS type, and location columns.
The second section detects columns from economic_df. The notebook searches for event date, event time, title, country, actual value, forecast value, previous value, and importance.
After detecting columns, the notebook prints the detected field names. This helps users confirm whether the notebook has identified the correct columns from each API response.
Next, the notebook creates rups_clean. This dataframe standardizes RUPS data into a common calendar structure:
event_category
ticker
company_name
event_date
event_time
event_title
location
country
actual
forecast
previous
importance
source_api
For RUPS data, event_category is set to "RUPS", and source_api is set to "getRupsCalendar".
Then, the notebook creates economic_clean using the same column structure. For economic events, fields such as ticker, company_name, and location are filled with empty strings because economic events are not tied to a specific company ticker in this workflow.
For economic calendar data, event_category is set to "Economic Calendar", and source_api is set to "getEconomicCalendar".
Finally, both datasets receive an event_date_parsed column. The notebook converts event_date into datetime format using pd.to_datetime. This makes it possible to sort events chronologically in the next step.
This cell is important because it turns two different calendar formats into one standardized event structure.
Cell 5 — Gabungkan Data Menjadi Kalender Terpadu
project_output = pd.concat(
    [rups_clean, economic_clean],
    ignore_index=True
)

project_output = project_output.sort_values(
    by=["event_date_parsed", "event_category"],
    ascending=[True, True]
).reset_index(drop=True)

project_output["project_note"] = (
    "Data getRupsCalendar dan getEconomicCalendar digabungkan menjadi "
    "satu kalender event pasar modal dan ekonomi."
)


summary_df = pd.DataFrame({
    "description": [
        "Total event RUPS",
        "Total event Economic Calendar",
        "Total seluruh event",
        "Jumlah ticker unik pada kalender RUPS",
        "Jumlah tanggal unik seluruh event"
    ],
    "value": [
        len(rups_clean),
        len(economic_clean),
        len(project_output),
        rups_clean["ticker"].replace("", pd.NA).dropna().nunique(),
        project_output["event_date"].replace("", pd.NA).dropna().nunique()
    ]
})


events_by_category = (
    project_output
    .groupby("event_category", dropna=False)
    .size()
    .reset_index(name="total_events")
)


display(project_output.head(50))
display(summary_df)
display(events_by_category)
Explanation
Cell 5 combines the cleaned RUPS calendar and economic calendar data into one unified output.
The notebook uses pd.concat to merge rups_clean and economic_clean vertically. This works because both datasets already have the same column structure from the previous cell.
The combined dataframe is stored as:
project_output
After combining the data, the notebook sorts the events by:
event_date_parsed
and
event_category
This makes the calendar easier to read because the events are arranged chronologically.
The notebook also adds a project_note column explaining that getRupsCalendar and getEconomicCalendar are combined into one capital market and economic event calendar.
Then, the notebook creates summary_df. This summary includes:
Total event RUPS
Total event Economic Calendar
Total seluruh event
Jumlah ticker unik pada kalender RUPS
Jumlah tanggal unik seluruh event
After that, the notebook creates events_by_category. This dataframe counts how many events exist in each event category.
At the end, the notebook displays the first 50 rows of the final calendar, the summary table, and the category-level event count.
This cell creates the main output of the IDX market event calendar project.
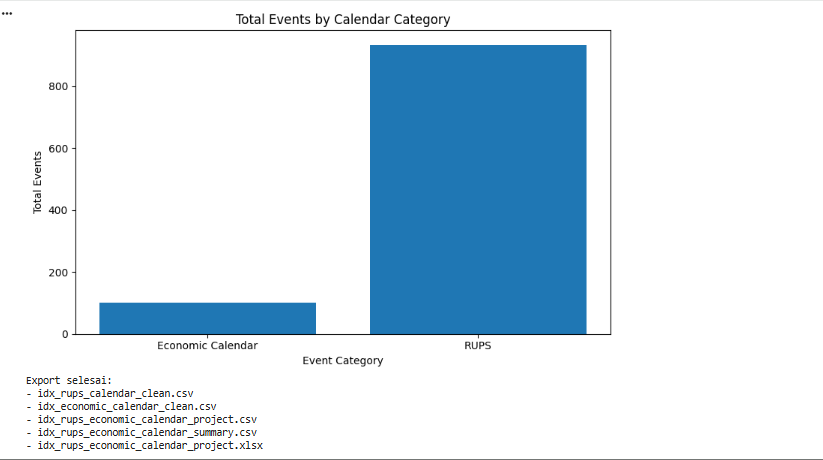
Cell 6 — Visualisasi dan Export
plt.figure(figsize=(8, 5))
plt.bar(events_by_category["event_category"], events_by_category["total_events"])
plt.xlabel("Event Category")
plt.ylabel("Total Events")
plt.title("Total Events by Calendar Category")
plt.tight_layout()
plt.show()


rups_clean.to_csv("idx_rups_calendar_clean.csv", index=False)
economic_clean.to_csv("idx_economic_calendar_clean.csv", index=False)
project_output.to_csv("idx_rups_economic_calendar_project.csv", index=False)
summary_df.to_csv("idx_rups_economic_calendar_summary.csv", index=False)

with pd.ExcelWriter("idx_rups_economic_calendar_project.xlsx", engine="openpyxl") as writer:
    rups_df.to_excel(writer, sheet_name="rups_raw", index=False)
    economic_df.to_excel(writer, sheet_name="economic_raw", index=False)
    rups_clean.to_excel(writer, sheet_name="rups_clean", index=False)
    economic_clean.to_excel(writer, sheet_name="economic_clean", index=False)
    project_output.to_excel(writer, sheet_name="final_calendar", index=False)
    summary_df.to_excel(writer, sheet_name="summary", index=False)
    events_by_category.to_excel(writer, sheet_name="events_by_category", index=False)

print("Export selesai:")
print("- idx_rups_calendar_clean.csv")
print("- idx_economic_calendar_clean.csv")
print("- idx_rups_economic_calendar_project.csv")
print("- idx_rups_economic_calendar_summary.csv")
print("- idx_rups_economic_calendar_project.xlsx")
Explanation
Cell 6 visualizes and exports the final calendar data.
The first part creates a bar chart using matplotlib. The X-axis shows the event category, while the Y-axis shows the total number of events.
The chart title is:
Total Events by Calendar Category
This visualization helps users quickly compare the number of RUPS events and economic calendar events.
After visualization, the notebook exports several CSV files:
idx_rups_calendar_clean.csv
idx_economic_calendar_clean.csv
idx_rups_economic_calendar_project.csv
idx_rups_economic_calendar_summary.csv
Then, the notebook creates an Excel file:
idx_rups_economic_calendar_project.xlsx
The Excel file contains multiple sheets:
rups_raw
economic_raw
rups_clean
economic_clean
final_calendar
summary
events_by_category
This export step makes the project easier to review, share, or continue in another workflow.
Finally, the notebook prints all exported filenames.
Result:
Overall Workflow
This notebook follows a simple but practical workflow.
First, it prepares the API configuration and required Python libraries. Second, it defines helper functions for API requests, rate limit handling, JSON parsing, dataframe conversion, column detection, and safe column selection.
Third, it retrieves sector reference data from getAllSectors. Fourth, it retrieves company data from getSectorCompanies using selected sector and subsector IDs. Fifth, it cleans and standardizes both datasets.
Finally, it combines company data with sector master information and creates a summary output.
The result is an IDX sector stock screener that can be used as a foundation for more advanced stock analysis projects.
Why This Case Matters
Sector-based analysis is one of the most practical ways to understand a stock market.
Instead of looking at all listed companies at once, analysts can focus on a specific sector or subsector. This helps reduce noise and makes the analysis more targeted.
An IDX sector stock screener can help users organize companies based on sector and subsector data before moving into deeper analysis such as valuation, liquidity filtering, sector rotation, or watchlist creation.
By combining getAllSectors and getSectorCompanies, this notebook builds the first layer of a sector-based stock analysis system.
Conclusion
This tutorial shows how to build an IDX sector stock screener using Python, getAllSectors, and getSectorCompanies.
The notebook starts by configuring the API connection and preparing helper functions. It then retrieves all sector data, requests companies from a selected sector and subsector, cleans both datasets, and combines company data with master sector information.
By the end of this workflow, we have a simple IDX sector stock screener that organizes companies by selected sector and subsector. This output can become the foundation for stock screening, watchlist creation, dashboard development, or deeper market analysis.