Financial markets continuously generate information through changes in asset popularity, trading activity, corporate actions, and investor attention. Monitoring these developments is important for identifying securities that attract market interest and understanding the corporate events associated with particular financial instruments.
Trending market assets provide an indication of securities that receive relatively high attention within a market data platform. This information can be used to construct an initial watchlist for further investigation. However, trending status alone does not establish whether an asset is experiencing a bullish or bearish price movement.
Corporate actions represent another important source of financial information. One example is a stock split, which changes the number of outstanding shares and the nominal price per share according to a specified split ratio. Although stock splits can affect market participation and share accessibility, they do not automatically indicate an increase or decrease in the underlying company's economic value.
The integration of trending market information and corporate action data can provide a more structured approach to financial market monitoring. By identifying assets that appear in both datasets, analysts can examine the relationship between market attention and reported corporate events.
Python offers an effective environment for automating this process. Through application programming interfaces (APIs), financial datasets can be retrieved, processed, standardized, analyzed, and transformed into visual reports.
This article introduces MarketFlow Trading Intelligence Analyzer, a Python-based framework that integrates the MarketFlow All-in-One Market Finance API through RapidAPI. The system retrieves trending market information through the /trending endpoint and stock split information through the /splits-events endpoint.
The analysis period for stock split events is configured from November 2, 2025, to November 9, 2025. The trending endpoint is retrieved without additional query parameters.
The framework applies JSON extraction and normalization to convert API responses into structured Pandas DataFrames. Ticker symbols are standardized to uppercase, while available ranking information is converted into numerical values.
A rank-based priority scoring mechanism is then implemented to classify trending assets into HIGH TREND, MODERATE TREND, and LOW TREND categories. The system also matches ticker symbols between trending assets and stock split records to identify assets associated with reported corporate actions.
The final analytical outputs include a trading watchlist, market condition classification, a four-panel dashboard, processed CSV datasets, original API response files, and a text-based market analysis report.
The primary objective is to develop an automated financial intelligence framework that combines trending asset monitoring and corporate action identification into a reproducible Python workflow. The system is designed to support market observation and watchlist preparation rather than generate direct trading recommendations.
2. Methodology
The MarketFlow Trading Intelligence Analyzer is organized into five computational cells. Each cell performs a specific function within the data collection, processing, analysis, and visualization workflow.
Cell | Main function |
|---|---|
Cell 1 | Library imports, RapidAPI configuration, analysis period, and output directory. |
Cell 2 | Retrieval of stock split events and trending market data. |
Cell 3 | JSON extraction, data normalization, and ticker standardization. |
Cell 4 | Rank-based priority scoring, market activity classification, and watchlist generation. |
Cell 5 | Dashboard visualization, market summary, and data export. |
2.1. System Configuration and API Integration
The system uses Python libraries including Requests, Pandas, NumPy, and Matplotlib.
Requests handles HTTP communication with the MarketFlow API. Pandas manages structured financial datasets, NumPy supports numerical operations, and Matplotlib provides visualization capabilities.
The RapidAPI configuration includes the API host, base URL, authentication headers, and two endpoint addresses.
The stock split analysis period is configured from November 2, 2025, to November 9, 2025. The output directory is named marketflow_output, where the system stores original API responses, processed datasets, dashboard images, and analytical reports.
Code — Cell 1: Library, Configuration, and Analysis Parameters
# ============================================================
# CELL 1 - MARKETFLOW TRADING INTELLIGENCE
# ============================================================

import os
import json
import requests
import pandas as pd
import numpy as np
import matplotlib.pyplot as plt

from datetime import datetime
from IPython.display import display, Markdown

# RAPIDAPI CONFIGURATION
API_KEY = os.getenv("RAPIDAPI_KEY", "fd8db84d91msh0aa9aa413565ca5p1c66c9jsn44cc1bc07eb2")

API_HOST = "marketflow-all-in-one-market-finance-api.p.rapidapi.com"

BASE_URL = f"https://{API_HOST}"

HEADERS = {
    "x-rapidapi-key": API_KEY,
    "x-rapidapi-host": API_HOST
}

# ANALYSIS PERIOD
START_DATE = "2025-11-02"
END_DATE = "2025-11-09"

# API ENDPOINTS
SPLITS_ENDPOINT = f"{BASE_URL}/splits-events"
TRENDING_ENDPOINT = f"{BASE_URL}/trending"

# OUTPUT DIRECTORY
OUTPUT_DIR = "marketflow_output"
os.makedirs(OUTPUT_DIR, exist_ok=True)

print("=" * 65)
print("       MARKETFLOW TRADING INTELLIGENCE ANALYZER")
print("=" * 65)
print("API Host       :", API_HOST)
print("Analysis Start :", START_DATE)
print("Analysis End   :", END_DATE)
print("Output Folder  :", OUTPUT_DIR)
print("=" * 65)
2.2. Market Data Collection Through RapidAPI
The second computational cell retrieves data from two MarketFlow API endpoints.
The first endpoint, /splits-events, collects stock split records using the configured start and end dates. The request also includes the skip parameter, which is initialized at zero.
The second endpoint, /trending, retrieves trending market information without additional query parameters.
A reusable fetch_api() function handles HTTP requests, response validation, and JSON conversion. If an API request fails, the function displays an error message and returns None, allowing the notebook to continue processing the available dataset.
Both original API responses are stored in JSON format:
splits_raw.jsontrending_raw.json
The system also displays the retrieval status and response types to provide an initial assessment of API connectivity.
Code — Cell 2: Full API Data Collection
# ============================================================
# CELL 2 - API DATA COLLECTION
# ============================================================

def fetch_api(endpoint, params=None):

    try:
        response = requests.get(
            endpoint,
            headers=HEADERS,
            params=params,
            timeout=30
        )

        response.raise_for_status()

        return response.json()

    except requests.exceptions.RequestException as error:

        print(f"API ERROR: {error}")
        return None

    except ValueError:

        print("ERROR: Response bukan JSON valid.")
        return None


if API_KEY == "MASUKKAN_RAPIDAPI_KEY":
    raise ValueError("Masukkan RapidAPI Key terlebih dahulu.")

print("\n[1] Fetching Splits Events...")

splits_raw = fetch_api(
    SPLITS_ENDPOINT,
    params={
        "skip": 0,
        "start_date": START_DATE,
        "end_date": END_DATE
    }
)

print("\n[2] Fetching Trending Market...")

trending_raw = fetch_api(
    TRENDING_ENDPOINT
)

# SAVE RAW RESPONSES
if splits_raw is not None:

    with open(
        f"{OUTPUT_DIR}/splits_raw.json",
        "w",
        encoding="utf-8"
    ) as file:

        json.dump(
            splits_raw,
            file,
            indent=4,
            ensure_ascii=False
        )

if trending_raw is not None:

    with open(
        f"{OUTPUT_DIR}/trending_raw.json",
        "w",
        encoding="utf-8"
    ) as file:

        json.dump(
            trending_raw,
            file,
            indent=4,
            ensure_ascii=False
        )

print("\n" + "=" * 65)
print("              API COLLECTION STATUS")
print("=" * 65)

print("Splits Events :", "SUCCESS" if splits_raw is not None else "FAILED")
print("Trending      :", "SUCCESS" if trending_raw is not None else "FAILED")

if splits_raw is not None:
    print("Splits response type:", type(splits_raw).__name__)

if trending_raw is not None:
    print("Trending response type:", type(trending_raw).__name__)

print("=" * 65)
2.3. Data Processing and Normalization
The third computational cell transforms the original API responses into structured datasets.
The API may return information in different JSON structures, including nested dictionaries and lists. To accommodate these variations, the system implements an extract_records() function.
The function searches common API response containers, including:
dataresultseventstrendingquotesitems
If these containers are not available, the function searches for the largest list of dictionaries within the response.
The extracted records are converted into Pandas DataFrames using pd.json_normalize().
Column names are standardized by converting them to lowercase and replacing spaces with underscores.
The system then identifies ticker symbols using several possible field names, including symbol, ticker, stock_symbol, ticker_symbol, and instrument.
Identified symbols are converted to uppercase and stripped of unnecessary whitespace. This standardization is important because the subsequent matching process depends on consistent ticker representations.
Finally, the processed trending and stock split datasets are displayed and exported into CSV files.
Code — Cell 3: Full Data Processing and Normalization
# ============================================================
# CELL 3 - DATA PROCESSING & NORMALIZATION
# ============================================================

def extract_records(data):

    if data is None:
        return []

    if isinstance(data, list):

        if all(isinstance(x, dict) for x in data):
            return data

        for item in data:
            result = extract_records(item)
            if result:
                return result

    elif isinstance(data, dict):

        # Check common API response containers
        for key in [
            "data", "results", "events",
            "trending", "quotes", "items"
        ]:

            if key in data:

                result = extract_records(data[key])

                if result:
                    return result

        # Find the largest list of dictionaries
        candidates = []

        for value in data.values():

            if isinstance(value, list):

                if value and all(
                    isinstance(x, dict) for x in value
                ):
                    candidates.append(value)

                elif value:
                    result = extract_records(value)
                    if result:
                        candidates.append(result)

            elif isinstance(value, dict):

                result = extract_records(value)

                if result:
                    candidates.append(result)

        if candidates:
            return max(candidates, key=len)

    return []


# EXTRACT DATA
splits_records = extract_records(splits_raw)
trending_records = extract_records(trending_raw)

splits_df = pd.json_normalize(splits_records)
trending_df = pd.json_normalize(trending_records)

# NORMALIZE COLUMN NAMES
splits_df.columns = [
    str(c).lower().replace(" ", "_")
    for c in splits_df.columns
]

trending_df.columns = [
    str(c).lower().replace(" ", "_")
    for c in trending_df.columns
]

# IDENTIFY SYMBOL COLUMN
SYMBOL_KEYS = [
    "symbol", "ticker", "stock_symbol",
    "ticker_symbol", "instrument"
]

def find_symbol_column(df):

    for col in SYMBOL_KEYS:

        if col in df.columns:
            return col

    return None


trending_symbol_col = find_symbol_column(trending_df)
splits_symbol_col = find_symbol_column(splits_df)

# STANDARDIZE SYMBOL
if trending_symbol_col:

    trending_df["symbol"] = (
        trending_df[trending_symbol_col]
        .astype(str)
        .str.upper()
        .str.strip()
    )

if splits_symbol_col:

    splits_df["symbol"] = (
        splits_df[splits_symbol_col]
        .astype(str)
        .str.upper()
        .str.strip()
    )

# DISPLAY DATA
print("=" * 65)
print("                 DATA PROCESSING")
print("=" * 65)

print("Trending Records :", len(trending_df))
print("Splits Records   :", len(splits_df))

print("\nTRENDING DATA PREVIEW")

display(trending_df.head(10))

print("\nSTOCK SPLIT DATA PREVIEW")

display(splits_df.head(10))

# SAVE NORMALIZED DATA
trending_df.to_csv(
    f"{OUTPUT_DIR}/trending_processed.csv",
    index=False
)

splits_df.to_csv(
    f"{OUTPUT_DIR}/splits_processed.csv",
    index=False
)
2.4. Trading Intelligence and Watchlist Generation
The fourth computational cell implements the main trading intelligence process.
The system first identifies the available ranking column from the trending dataset. The supported field names are rank, position, ranking, trending_rank, and score.
If a ranking field is available, its values are converted into numerical data. Otherwise, the system generates sequential rankings based on the order of the retrieved records.
The ranking information is subsequently transformed into a relative priority score using the following formula:
\[ Priority\ Score = 100 \times \left(1-\frac{Rank-1}{MaxRank-1}\right) \]
The resulting score is constrained between 0 and 100.
Based on the priority score, each trending asset is classified into one of three market activity categories:
Priority score | Market activity |
|---|---|
80–100 | HIGH TREND |
50–79.99 | MODERATE TREND |
Below 50 | LOW TREND |
The system also compares standardized ticker symbols between the trending and stock split datasets.
If a ticker appears in both datasets, it receives the classification SPLIT EVENT DETECTED. Otherwise, it receives NO MATCHING SPLIT EVENT.
The final watchlist is sorted according to priority score in descending order.
To summarize overall market activity, the framework calculates the proportion of HIGH TREND assets relative to all trending assets.
The resulting market condition is classified as:
HIGH TREND CONCENTRATION.
MODERATE TREND ACTIVITY.
LOW TREND ACTIVITY.
INSUFFICIENT DATA.
This process provides a structured way to identify market assets that receive relatively high attention and determine whether they are associated with reported stock split events.
Code — Cell 4: Full Trading Intelligence and Watchlist Generation
# ============================================================
# CELL 4 - TRADING INTELLIGENCE ENGINE
# ============================================================

# FIND RANK COLUMN
RANK_KEYS = [
    "rank", "position", "ranking",
    "trending_rank", "score"
]

rank_col = next(
    (c for c in RANK_KEYS if c in trending_df.columns),
    None
)

# CREATE WATCHLIST
watchlist = trending_df.copy()

if not watchlist.empty:

    # TRENDING RANK
    if rank_col:

        watchlist["trending_rank"] = pd.to_numeric(
            watchlist[rank_col],
            errors="coerce"
        )

    else:

        watchlist["trending_rank"] = (
            np.arange(1, len(watchlist) + 1)
        )

    # RANK-BASED PRIORITY SCORE
    max_rank = max(
        watchlist["trending_rank"].max(),
        1
    )

    watchlist["priority_score"] = (
        100 * (
            1 - (
                watchlist["trending_rank"] - 1
            ) / max(max_rank - 1, 1)
        )
    ).clip(0, 100)

    # CHECK SPLIT EVENTS
    if (
        "symbol" in watchlist.columns
        and "symbol" in splits_df.columns
    ):

        split_symbols = set(
            splits_df["symbol"].dropna()
        )

        watchlist["has_split_event"] = (
            watchlist["symbol"].isin(split_symbols)
        )

    else:

        watchlist["has_split_event"] = False

    # ACTIVITY CLASSIFICATION
    def classify_activity(row):

        score = row["priority_score"]

        if score >= 80:
            return "HIGH TREND"

        elif score >= 50:
            return "MODERATE TREND"

        return "LOW TREND"

    watchlist["market_activity"] = watchlist.apply(
        classify_activity,
        axis=1
    )

    # EVENT CLASSIFICATION
    watchlist["event_status"] = np.where(
        watchlist["has_split_event"],
        "SPLIT EVENT DETECTED",
        "NO MATCHING SPLIT EVENT"
    )

    # FINAL PRIORITY
    watchlist = watchlist.sort_values(
        "priority_score",
        ascending=False
    )

else:

    watchlist = pd.DataFrame()

# EVENT STATISTICS
total_trending = len(watchlist)
total_splits = len(splits_df)

high_trend = (
    len(watchlist[
        watchlist["market_activity"] == "HIGH TREND"
    ])
    if not watchlist.empty else 0
)

split_matches = (
    int(watchlist["has_split_event"].sum())
    if not watchlist.empty else 0
)

# MARKET CONDITION
if total_trending == 0:

    market_condition = "INSUFFICIENT DATA"

elif high_trend / total_trending >= 0.5:

    market_condition = "HIGH TREND CONCENTRATION"

elif high_trend > 0:

    market_condition = "MODERATE TREND ACTIVITY"

else:

    market_condition = "LOW TREND ACTIVITY"


# SAVE WATCHLIST
watchlist.to_csv(
    f"{OUTPUT_DIR}/trading_watchlist.csv",
    index=False
)

print("=" * 65)
print("             TRADING INTELLIGENCE REPORT")
print("=" * 65)

print("Total Trending Assets :", total_trending)
print("Total Split Events    :", total_splits)
print("High Trend Assets     :", high_trend)
print("Split Matches         :", split_matches)

print("-" * 65)

print("Market Condition      :", market_condition)

print("=" * 65)

print("\nTOP 10 TRADING WATCHLIST")

if not watchlist.empty:

    display(
        watchlist.head(10)
    )

else:

    print("No trending records available.")

print("\nIMPORTANT:")
print("Trending status is not a BUY/SELL signal.")
print("Stock splits are corporate actions, not")
print("automatic bullish or bearish indicators.")
2.5. Dashboard Visualization and Data Export
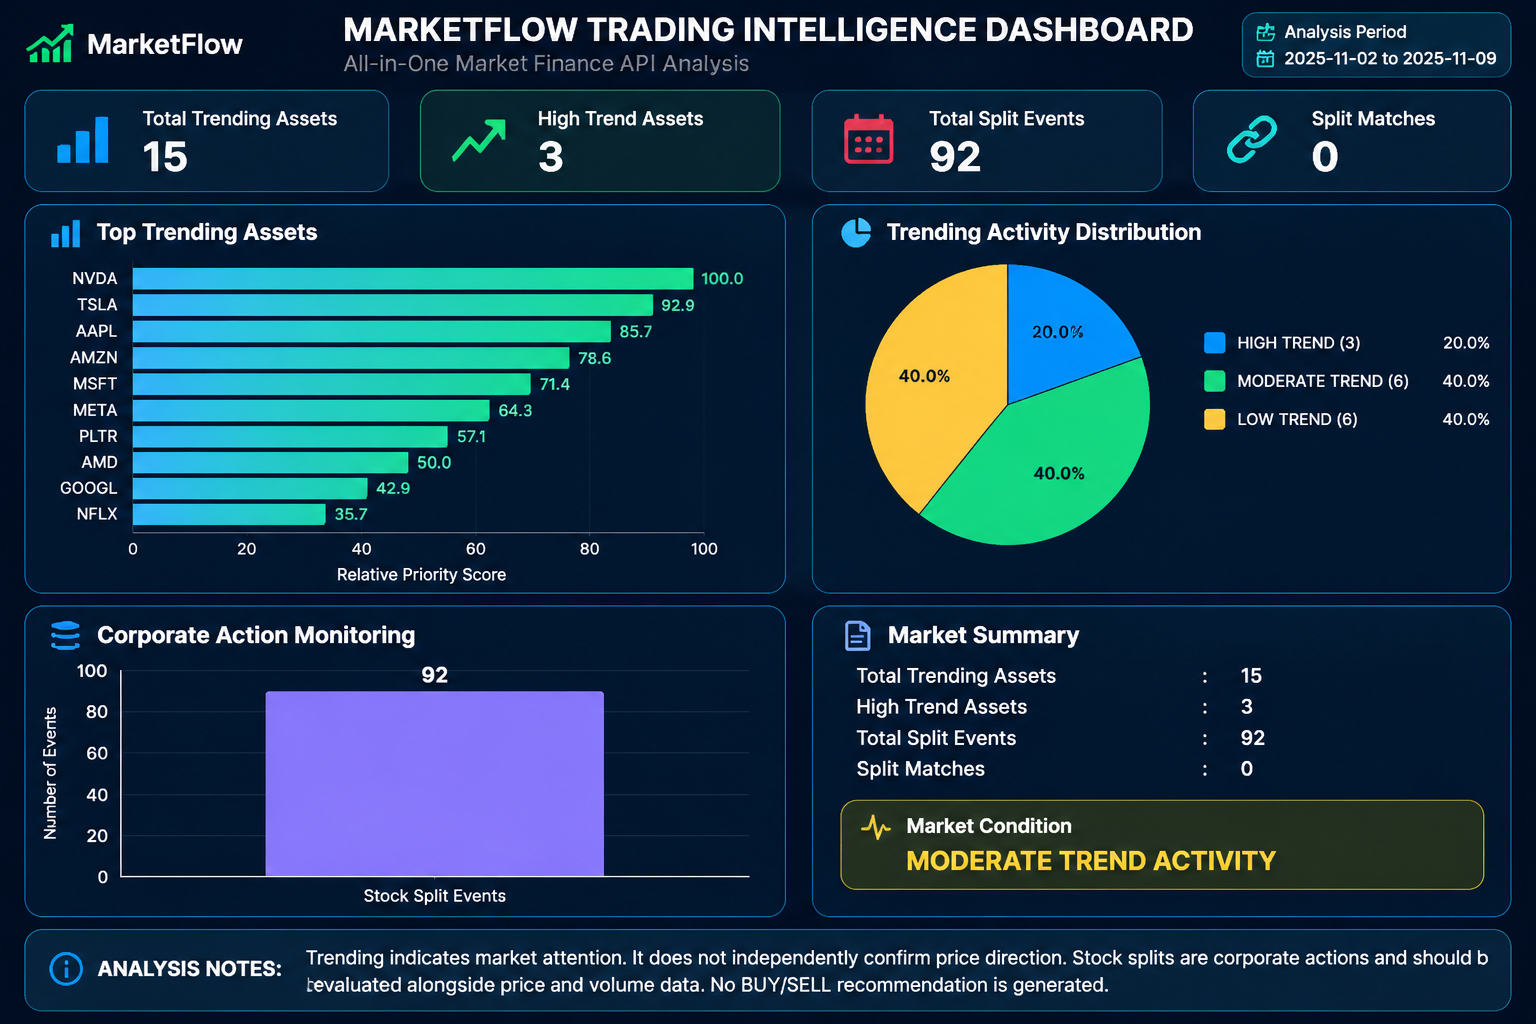
The fifth computational cell generates the MarketFlow Trading Intelligence Dashboard using Matplotlib.
The dashboard consists of four analytical components.
1. Top Trending Assets
A horizontal bar chart displays the ten highest-ranked assets according to their calculated priority scores.
2. Trending Activity Distribution
A pie chart illustrates the distribution of assets across HIGH TREND, MODERATE TREND, and LOW TREND categories.
3. Corporate Action Monitoring
A bar chart displays the total number of stock split events retrieved during the configured analysis period.
4. Market Summary
A textual summary presents the number of trending assets, stock split events, high-trend assets, matched split events, and the overall market condition.
The dashboard is saved as marketflow_dashboard.png with a resolution of 200 DPI.
In addition to visualization, the system generates a text-based report named market_analysis_report.txt. This report summarizes the analysis period, trending market statistics, stock split information, and analytical limitations.
Code — Cell 5: Full Dashboard, Visualization, and Export
# ============================================================
# CELL 5 - DASHBOARD & EXPORT
# ============================================================

print("\nGENERATING MARKETFLOW DASHBOARD...")

fig, axes = plt.subplots(
    2, 2,
    figsize=(16, 10)
)

fig.suptitle(
    "MARKETFLOW TRADING INTELLIGENCE DASHBOARD",
    fontsize=17,
    fontweight="bold"
)

# 1. TRENDING RANKING
ax = axes[0, 0]

if not watchlist.empty:

    top10 = watchlist.head(10).copy()

    symbol_labels = (
        top10["symbol"]
        if "symbol" in top10.columns
        else top10.index.astype(str)
    )

    ax.barh(
        symbol_labels.astype(str),
        top10["priority_score"]
    )

    ax.invert_yaxis()

    ax.set_title("Top Trending Assets")
    ax.set_xlabel("Relative Priority Score")

else:

    ax.text(0.5, 0.5, "No Trending Data",
            ha="center", va="center")

# 2. MARKET ACTIVITY
ax = axes[0, 1]

if not watchlist.empty:

    activity = watchlist[
        "market_activity"
    ].value_counts()

    ax.pie(
        activity.values,
        labels=activity.index,
        autopct="%1.1f%%",
        startangle=90
    )

    ax.set_title("Trending Activity Distribution")

else:

    ax.text(0.5, 0.5, "No Data",
            ha="center", va="center")

# 3. STOCK SPLIT EVENTS
ax = axes[1, 0]

if not splits_df.empty:

    ax.bar(
        ["Stock Split Events"],
        [total_splits]
    )

    ax.set_title("Corporate Action Monitoring")
    ax.set_ylabel("Number of Events")

else:

    ax.text(0.5, 0.5, "No Split Events",
            ha="center", va="center")

# 4. MARKET SUMMARY
ax = axes[1, 1]

ax.axis("off")

summary = f"""
MARKET SUMMARY

Trending Assets  : {total_trending}
Split Events     : {total_splits}
High Trend       : {high_trend}
Split Matches    : {split_matches}

MARKET CONDITION

{market_condition}

Analysis Date:
{datetime.now().strftime("%Y-%m-%d %H:%M:%S")}

DATA SOURCE:
MarketFlow RapidAPI
"""

ax.text(
    0.05, 0.85,
    summary,
    fontsize=12,
    verticalalignment="top",
    family="monospace"
)

plt.tight_layout()

dashboard_path = (
    f"{OUTPUT_DIR}/marketflow_dashboard.png"
)

plt.savefig(
    dashboard_path,
    dpi=200,
    bbox_inches="tight"
)

plt.show()


# GENERATE TEXT REPORT
report = f"""
===========================================================
       MARKETFLOW TRADING INTELLIGENCE REPORT
===========================================================

Analysis Period : {START_DATE} to {END_DATE}

TRENDING MARKET
---------------------------
Total Assets     : {total_trending}
High Trend       : {high_trend}

STOCK SPLIT EVENTS
---------------------------
Total Events     : {total_splits}
Split Matches    : {split_matches}

MARKET CONDITION
---------------------------
{market_condition}

ANALYSIS NOTES
---------------------------
Trending indicates market attention.
It does not independently confirm price direction.

Stock splits are corporate actions and should
be evaluated alongside price and volume data.

No BUY/SELL recommendation is generated.

===========================================================
Analysis completed successfully.
===========================================================
"""

with open(
    f"{OUTPUT_DIR}/market_analysis_report.txt",
    "w",
    encoding="utf-8"
) as file:

    file.write(report)

print(report)

print("\nEXPORTED FILES:")

for filename in os.listdir(OUTPUT_DIR):

    print("-", filename)

print("\nMARKETFLOW ANALYSIS COMPLETED.")
Result:
3. Results and Discussion
3.1. Market Data Retrieval Results
The data collection process retrieves two financial datasets from the MarketFlow API: trending market assets and stock split events.
The /trending endpoint provides information about assets currently identified as trending by the API, while /splits-events provides corporate action records within the configured analysis period.
The system stores the original responses in JSON format before processing them into structured datasets.
The retrieval process is designed to preserve the original API information, allowing subsequent verification and examination of the source records.
The actual number of retrieved records depends on API availability and the data returned during execution.
3.2. Data Processing and Normalization Results
The normalization process converts the API responses into two Pandas DataFrames: trending_df and splits_df.
The system identifies available ticker fields and standardizes their values into uppercase representations.
This process supports consistent ticker matching between trending assets and corporate action records.
The normalized datasets are exported into:
trending_processed.csvsplits_processed.csv
The resulting datasets provide structured inputs for the subsequent market intelligence analysis.
3.3. Trending Asset Priority Assessment
The rank-based scoring mechanism transforms trending rankings into relative priority scores ranging from 0 to 100.
Assets with higher ranking positions receive higher priority scores under the implemented scoring formula.
The system classifies assets into three market activity categories:
Classification | Priority score | Interpretation |
|---|---|---|
HIGH TREND | 80–100 | Relatively high trending priority. |
MODERATE TREND | 50–79.99 | Intermediate trending priority. |
LOW TREND | Below 50 | Relatively low trending priority. |
This classification provides a structured method for organizing trending assets according to their relative positions.
However, the score should be interpreted as a ranking-based analytical measure rather than a direct indicator of price performance, trading volume, or future returns.
3.4. Stock Split Event Identification
The stock split matching mechanism compares ticker symbols between the trending dataset and the stock split dataset.
If an asset appears in both datasets, the system assigns the status SPLIT EVENT DETECTED.
If no matching ticker is identified, the system assigns NO MATCHING SPLIT EVENT.
This process allows analysts to identify trending assets that are also associated with reported corporate actions during the configured period.
Nevertheless, the existence of a stock split event does not independently establish a positive or negative market outlook. Additional examination of company fundamentals, trading volume, and price movements is necessary.
3.5. Overall Market Condition Assessment
The framework evaluates the concentration of HIGH TREND assets relative to the total number of trending assets.
The market condition is classified using the following rules:
Condition | Classification rule |
|---|---|
HIGH TREND CONCENTRATION | At least 50% of trending assets are HIGH TREND. |
MODERATE TREND ACTIVITY | At least one HIGH TREND asset exists, but its proportion is below 50%. |
LOW TREND ACTIVITY | No HIGH TREND assets are identified. |
INSUFFICIENT DATA | No trending assets are retrieved. |
This classification provides an aggregated perspective on the distribution of trending market attention.
It should not be interpreted as a bullish or bearish market indicator because the calculation is based on trending rankings rather than price direction.
3.6. Dashboard Visualization Results
The dashboard integrates the analytical outputs into four visual components.
MarketFlow Trading Intelligence Dashboard
Top Trending Assets
Relative priority ranking of the top ten assets.
Activity Distribution
Proportion of HIGH, MODERATE, and LOW TREND assets.
Corporate Actions
Total stock split events retrieved.
Market Summary
Overall market statistics and condition classification.
Components described from the source code; actual chart values are generated after API execution.
The visualization provides an integrated overview of market attention and corporate action information.
The dashboard is saved as marketflow_dashboard.png, allowing the results to be used in analytical reports and further financial examination.
3.7. Exported Analytical Outputs
The system generates the following files in the marketflow_output directory.
Filename | Description |
|---|---|
| Original stock split API response. |
| Original trending API response. |
| Normalized trending dataset. |
| Normalized stock split dataset. |
| Ranked trading intelligence watchlist. |
| Four-panel market intelligence dashboard. |
| Text-based analytical summary. |
These outputs provide a reproducible record of the data retrieval, normalization, analysis, and reporting processes.
3.8. Limitations and Future Improvements
Several limitations should be considered when interpreting the analytical results.
First, trending information represents market attention rather than price direction. The system does not retrieve historical price movements or calculate technical indicators.
Second, the priority score depends on ranking information. The calculation assumes that a smaller ranking number represents a higher priority. If the API's score field instead represents a higher-is-better value, the current calculation would need adjustment.
Third, stock split matching relies on ticker symbols. The current implementation does not independently verify company identifiers, corporate action ratios, or event dates for each matched asset.
Fourth, the market condition classification is rule-based. It summarizes the proportion of HIGH TREND assets but does not measure overall market sentiment or market returns.
Fifth, the trending endpoint is retrieved without a specified historical date range. Consequently, its results may represent the market information available when the request is executed rather than a historical snapshot corresponding to November 2–9, 2025.
Future improvements could include:
Integration of historical price and volume data.
Verification of stock split ratios and effective dates.
Market capitalization and liquidity analysis.
Historical trending data comparison.
Company identifier-based matching.
News sentiment and fundamental analysis.
Historical performance evaluation of trending assets.
Automated market monitoring and dashboard updates.
These developments could expand the framework into a more comprehensive market intelligence system.
4. Conclusion
This article presents MarketFlow Trading Intelligence Analyzer, a Python-based financial market monitoring framework that integrates trending market assets and stock split events through the MarketFlow All-in-One Market Finance API.
The system retrieves financial information from the /trending and /splits-events endpoints, processes nested JSON responses, normalizes financial datasets, and standardizes ticker symbols for consistent analysis.
The analytical framework implements a rank-based priority scoring mechanism to classify trending assets into HIGH TREND, MODERATE TREND, and LOW TREND categories. It also performs ticker matching to identify assets associated with reported stock split events.
Furthermore, the system evaluates overall market activity through the concentration of high-trend assets and generates a structured trading watchlist.
The visualization module presents trending asset rankings, market activity distribution, stock split event monitoring, and market summary information in a consolidated dashboard. The system also exports processed datasets, original API responses, and a text-based analytical report.
Overall, MarketFlow Trading Intelligence Analyzer provides a practical foundation for automated financial market monitoring and watchlist development using Python and financial APIs.
The framework emphasizes the importance of distinguishing market attention from actual price direction. Trending assets and stock split events should therefore be treated as supplementary analytical information rather than independent BUY or SELL recommendations.
Further development involving historical price analysis, company fundamentals, event verification, and predictive modeling could improve the analytical capabilities and practical application of the system.