
Stock market analysis requires more than observing price movements and technical indicators. Investors also need to understand a company's financial fundamentals, dividend sustainability, profitability, valuation, and market expectations. These factors provide a broader perspective for evaluating investment opportunities and identifying stocks that may deserve further research.
Dividend analysis is particularly important for investors seeking companies with consistent income distributions. Dividend yield measures the dividend relative to the stock price, while the payout ratio indicates how much of a company's earnings is distributed to shareholders. However, a high dividend yield does not automatically represent an attractive investment because it may also reflect declining share prices or an unsustainable dividend policy.
Fundamental analysis also involves examining profitability and valuation. Profit margin and return on equity (ROE) provide information about a company's ability to generate profits, while the price-to-earnings ratio (P/E) and forward P/E offer valuation perspectives. Analyst sentiment provides an additional view of market expectations, although analyst recommendations should not be considered guarantees of future performance.
Another important aspect of financial market monitoring is initial public offering (IPO) activity. Monitoring upcoming IPO events allows investors to identify companies entering the public market and examine their expected listing dates, exchanges, and indicative price ranges. Combining IPO monitoring with dividend and fundamental analysis creates a broader framework for tracking potential investment opportunities.
Python provides an efficient environment for automating these analytical processes. Through financial application programming interfaces (APIs), financial data can be retrieved, normalized, classified, scored, and presented in structured dashboards. Libraries such as Requests, Pandas, NumPy, and Matplotlib support the development of repeatable financial analysis workflows.
This article presents MarketFlow Trader Intelligence, a Python-based framework that uses the MarketFlow All-in-One Market Finance API through RapidAPI. The system combines dividend intelligence, fundamental stock evaluation, analyst sentiment analysis, and IPO event monitoring within a single analytical workflow.
The dividend analysis focuses on four selected stocks: PNW.US, AAPL.US, MSFT.US, and AMZN.US. The IPO monitoring component retrieves events scheduled within a dynamically defined 90-day period. Each stock is evaluated using dividend yield, dividend rate, payout ratio, profitability, valuation, and analyst sentiment.
The framework also implements a rule-based fundamental scoring model with a maximum score of 100. The resulting scores are used to rank stocks and classify them into priority watchlist, watchlist, or further-analysis categories. Meanwhile, the IPO module identifies historical and upcoming events based on their reported dates.
The objective is to demonstrate how Python can integrate dividend analysis, fundamental stock screening, and IPO monitoring into a unified financial intelligence dashboard. The resulting classifications are intended to support further investment research rather than provide automatic trading instructions or guarantees of investment performance.
2. Methodology
The MarketFlow Trader Intelligence framework consists of five computational cells.
Cell 1 — Configuration and API Setup: imports the required libraries, configures RapidAPI authentication, defines the IPO monitoring period, and establishes the dividend stock watchlist.
Cell 2 — API Data Collection: retrieves IPO event data and dividend fundamentals for each selected stock.
Cell 3 — Data Processing and Normalization: extracts IPO records, processes dividend information, and combines the relevant financial variables into structured DataFrames.
Cell 4 — Fundamental Signal Engine: calculates dividend yield, payout ratio, dividend classification, profitability classification, analyst sentiment, and fundamental scores.
Cell 5 — Trader Intelligence Dashboard: presents dividend rankings, top fundamental stocks, IPO events, market summaries, automated interpretations, and downloadable CSV outputs.
2.1. Dividend Yield and Payout Ratio
Dividend yield measures the annual dividend relative to the stock price. The system converts the API's dividend yield value into a percentage:
\[ Dividend\ Yield = Dividend\ Yield_{API}\times100 \]
The payout ratio is calculated using the annual dividend rate and earnings per share:
\[ Payout\ Ratio = \frac{Dividend\ Rate}{EPS}\times100 \]
A payout ratio above 100% indicates that the dividend rate exceeds the reported earnings per share under the assumptions used in the calculation. This may indicate dividend sustainability concerns, although additional cash-flow and earnings analysis is required before drawing a definitive conclusion.
The script classifies dividend conditions as follows:
Condition | Classification |
|---|---|
Missing dividend yield | Insufficient Data |
Zero dividend yield or dividend rate | No Dividend |
Payout ratio above 100% | Dividend Risk |
Yield at least 5%, payout ratio at most 80% or unavailable | High Dividend |
Yield at least 3%, payout ratio at most 80% or unavailable | Attractive |
Yield at least 1% | Moderate |
Yield below 1% | Low Dividend |
These thresholds are analytical rules defined by the program, not universal standards for dividend quality.
2.2. Profitability Analysis
The profitability assessment uses profit margin and return on equity (ROE).
Strong: profit margin and ROE are both above 10%.
Positive: both metrics are above zero but do not simultaneously meet the strong threshold.
Weak: either metric is zero or negative.
Insufficient Data: one or both metrics are unavailable.
2.3. Analyst Sentiment
The system classifies analyst sentiment into four categories:
Bullish
Bearish
Neutral
Unknown
The classification is based on the sentiment field returned by the API. Analyst recommendations and the latest available monthly buy, hold, sell, strong-buy, and strong-sell counts are also retained for reporting.
2.4. Fundamental Scoring Model
The fundamental score combines dividend quality, profitability, analyst sentiment, and payout ratio.
Evaluation component | Condition | Score |
|---|---|---|
Dividend | High Dividend | +25 |
Dividend | Attractive | +20 |
Dividend | Moderate | +10 |
Profitability | Strong | +25 |
Profitability | Positive | +15 |
Analyst | Bullish | +25 |
Analyst | Neutral | +15 |
Payout ratio | At most 60% | +25 |
Payout ratio | Above 60% and at most 80% | +15 |
Payout ratio | Above 100% | -20 |
The final score is restricted to a range of 0–100:
\[ Fundamental\ Score = \min(100,\max(0,\sum Score)) \]
Stocks are ranked according to their fundamental scores, with higher scores receiving higher priority in the dashboard.
Importantly, missing data do not automatically receive positive scores. The scoring model is a custom screening mechanism and should not be interpreted as a standardized valuation model.
3. Implementation and Python Code
The implementation follows the five-cell organization of the uploaded MarketFlow_Trader_Intelligence.py file. Each cell performs a separate analytical stage and shares its variables with the subsequent cells.
Cell 1 — Configuration and API Setup
The first cell imports the required Python libraries and establishes the connection to the MarketFlow API through RapidAPI. The API key is requested interactively using getpass to avoid directly displaying authentication credentials in the notebook.
The IPO monitoring period is dynamically configured from the current date to the following 90 days. The dividend watchlist contains four securities: PNW.US, AAPL.US, MSFT.US, and AMZN.US.
These parameters determine the scope of the financial data retrieved in the next stage.
Code — Cell 1
# CELL 1: CONFIGURATION

import requests
import pandas as pd
import numpy as np
import json
import re
from datetime import datetime, timedelta
from getpass import getpass
from IPython.display import display, Markdown

API_KEY = getpass("Masukkan RapidAPI Key: ")

BASE_URL = "https://marketflow-all-in-one-market-finance-api.p.rapidapi.com"

HEADERS = {
    "x-rapidapi-host": "marketflow-all-in-one-market-finance-api.p.rapidapi.com",
    "x-rapidapi-key": API_KEY
}

# Periode analisis IPO
START_DATE = datetime.now().strftime("%Y-%m-%d")
END_DATE = (datetime.now() + timedelta(days=90)).strftime("%Y-%m-%d")

# Saham yang dianalisis dividennya
TICKERS = [
    "PNW.US",
    "AAPL.US",
    "MSFT.US",
    "AMZN.US"
]

print("MARKETFLOW TRADER INTELLIGENCE")
print("IPO Period:", START_DATE, "to", END_DATE)
print("Dividend Watchlist:", TICKERS)
Cell 2 — API Data Collection
The second cell establishes a reusable fetch_api() function to retrieve financial information from the MarketFlow API.
The function sends authenticated GET requests, applies a 30-second timeout, and handles HTTP communication errors. If a request fails, the function displays an error message and returns None rather than terminating the entire data collection process.
Two categories of financial information are retrieved.
First, the /ipos-events endpoint collects IPO events within the configured 90-day period. Second, the dividend details endpoint retrieves financial fundamentals for each stock in the watchlist.
The dividend responses are stored in a dictionary using ticker symbols as keys. This structure makes it easier to process each company's financial information independently in the next cell.
Code — Cell 2
# CELL 2: DATA COLLECTION

def fetch_api(endpoint, params=None):
    url = f"{BASE_URL}/{endpoint}"

    try:
        response = requests.get(
            url,
            headers=HEADERS,
            params=params,
            timeout=30
        )

        response.raise_for_status()
        return response.json()

    except requests.exceptions.RequestException as e:
        print(f"[API ERROR] {endpoint}: {e}")
        return None


# 1. IPO EVENTS
ipo_raw = fetch_api(
    "ipos-events",
    params={
        "skip": 0,
        "start_date": START_DATE,
        "end_date": END_DATE
    }
)

# 2. DIVIDEND DETAILS
dividend_raw = {}

for ticker in TICKERS:
    result = fetch_api(
        f"dividens-details/{ticker}",
        params={"lang": "en"}
    )

    dividend_raw[ticker] = result

print("\nIPO API:", "SUCCESS" if ipo_raw is not None else "FAILED")
print("Dividend API:", sum(v is not None for v in dividend_raw.values()),
      "/", len(TICKERS), "successful")

print("\nSample IPO Response:")
print(json.dumps(ipo_raw, indent=2)[:2000] if ipo_raw else "No data")

print("\nSample Dividend Response:")
sample = next((v for v in dividend_raw.values() if v is not None), None)
print(json.dumps(sample, indent=2)[:2000] if sample else "No data")
Cell 3 — Data Processing and Normalization
The third cell transforms the raw API responses into structured analytical datasets.
The IPO processing component extracts records from the nested JSON response and converts them into a Pandas DataFrame. A helper function is included to handle the extraction of records from different nested JSON structures. This helper is necessary because the uploaded source code calls extract_records() without defining it.
The dividend processing component iterates through each stock response and extracts information from the following sections:
general_info: company sector, industry, exchange, and update date.highlights: dividend yield, dividend rate, earnings per share, and P/E ratio.valuation: forward P/E.profitability: profit margin, ROE, revenue growth, and earnings growth.analysts_recommendations: analyst sentiment, recommendation, and monthly buy, hold, and sell counts.
The latest analyst record is selected according to the highest available period value. The extracted information is then combined into a single DataFrame, with one row representing each successfully retrieved stock.
Code — Cell 3
# CELL 3: DATA PROCESSING & NORMALIZATION

# 1. IPO DATA
ipo_records = extract_records(ipo_raw)
ipo_df = pd.json_normalize(ipo_records, sep="_")


# 2. DIVIDEND FUNDAMENTAL DATA
dividend_records = []

for ticker, raw in dividend_raw.items():

    if not isinstance(raw, dict):
        print(f"[SKIP] {ticker}: API data unavailable")
        continue

    general = raw.get("general_info", {})
    highlights = raw.get("highlights", {})
    profitability = raw.get("profitability", {})
    valuation = raw.get("valuation", {})
    analyst = raw.get("analysts_recommendations", {})

    # Analyst latest monthly record
    analyst_records = analyst.get("records", [])

    latest_analyst = (
        max(
            analyst_records,
            key=lambda x: x.get("period", 0)
        )
        if analyst_records else {}
    )

    row = {
        "ticker": ticker,
        "company": raw.get("description", ""),
        "sector": general.get("Sector"),
        "industry": general.get("Industry"),
        "exchange": general.get("Exchange"),

        # Dividend
        "Dividend_Yield_Raw": highlights.get("DividendYield"),
        "Dividend_Rate": highlights.get("DividendShare"),

        # Earnings
        "EPS": highlights.get("EarningsShare"),
        "PERatio": highlights.get("PERatio"),
        "ForwardPE": valuation.get("ForwardPE"),

        # Profitability
        "Profit_Margin": profitability.get("ProfitMargin"),
        "ROE": profitability.get("ReturnOnEquityTTM"),
        "Revenue_Growth": profitability.get("QuarterlyRevenueGrowthYOY"),
        "Earnings_Growth": profitability.get("QuarterlyEarningsGrowthYOY"),

        # Analyst
        "Analyst_Sentiment": analyst.get("sentiment"),
        "Analyst_Recommendation": analyst.get("recomandation"),

        "Analyst_Buy": latest_analyst.get("buy"),
        "Analyst_Hold": latest_analyst.get("hold"),
        "Analyst_Sell": latest_analyst.get("sell"),
        "Analyst_Strong_Buy": latest_analyst.get("strong_buy"),
        "Analyst_Strong_Sell": latest_analyst.get("strong_sell"),

        "Updated_At": general.get("UpdatedAt")
    }

    dividend_records.append(row)


dividend_df = pd.DataFrame(dividend_records)

print("IPO Records:", len(ipo_df))
print("Dividend Stocks:", len(dividend_df))

display(dividend_df)
Cell 4 — Fundamental Signal Engine
The fourth cell implements the fundamental evaluation engine. It transforms the extracted financial variables into dividend classifications, profitability assessments, analyst sentiment categories, and an overall fundamental score.
The dividend yield is converted into a percentage, while financial variables such as dividend rate, EPS, P/E ratio, forward P/E, profit margin, ROE, and growth rates are converted into numerical values.
The program then calculates the payout ratio and applies the classification rules established in the methodology.
Profitability is evaluated using profit margin and ROE, while analyst sentiment is standardized into bullish, bearish, neutral, or unknown categories.
The fundamental scoring engine combines these classifications into a score between 0 and 100. Stocks are subsequently ranked from the highest to the lowest score.
The IPO dataset is also processed in this cell. Each IPO event is assigned a status based on its reported date, distinguishing events with unknown dates, past events, upcoming events within 30 days, and other upcoming events.
Code — Cell 4
# CELL 4: TRADER SIGNAL ENGINE

div = dividend_df.copy()

# Convert dividend yield to percentage
div["Dividend_Yield"] = (
    pd.to_numeric(div["Dividend_Yield_Raw"], errors="coerce") * 100
)

# Convert numerical columns
numeric_cols = [
    "Dividend_Rate", "EPS", "PERatio", "ForwardPE",
    "Profit_Margin", "ROE", "Revenue_Growth",
    "Earnings_Growth"
]

for col in numeric_cols:
    div[col] = pd.to_numeric(div[col], errors="coerce")


# Calculate payout ratio
div["Payout_Ratio"] = np.where(
    div["EPS"] > 0,
    (div["Dividend_Rate"] / div["EPS"]) * 100,
    np.nan
)


# Dividend classification
def classify_dividend(row):

    y = row["Dividend_Yield"]
    p = row["Payout_Ratio"]
    rate = row["Dividend_Rate"]

    if pd.isna(y):
        return "INSUFFICIENT DATA"

    if y == 0 or (pd.notna(rate) and rate == 0):
        return "NO DIVIDEND"

    if pd.notna(p) and p > 100:
        return "DIVIDEND RISK"

    if y >= 5 and (pd.isna(p) or p <= 80):
        return "HIGH DIVIDEND"

    if y >= 3 and (pd.isna(p) or p <= 80):
        return "ATTRACTIVE"

    if y >= 1:
        return "MODERATE"

    return "LOW DIVIDEND"


div["Dividend_Signal"] = div.apply(
    classify_dividend, axis=1
)


# Profitability assessment
def profitability_signal(row):

    margin = row["Profit_Margin"]
    roe = row["ROE"]

    if pd.isna(margin) or pd.isna(roe):
        return "INSUFFICIENT DATA"

    if margin > 0.10 and roe > 0.10:
        return "STRONG"

    if margin > 0 and roe > 0:
        return "POSITIVE"

    return "WEAK"


div["Profitability_Signal"] = div.apply(
    profitability_signal, axis=1
)


# Analyst sentiment
def analyst_signal(value):

    if pd.isna(value):
        return "UNKNOWN"

    value = str(value).upper()

    if value in ["BULLISH", "POSITIVE"]:
        return "BULLISH"

    if value in ["BEARISH", "NEGATIVE"]:
        return "BEARISH"

    if value in ["NEUTRAL"]:
        return "NEUTRAL"

    return "UNKNOWN"


div["Analyst_Signal"] = div["Analyst_Sentiment"].apply(
    analyst_signal
)


# Combined fundamental score
def calculate_score(row):

    score = 0

    if row["Dividend_Signal"] == "HIGH DIVIDEND":
        score += 25
    elif row["Dividend_Signal"] == "ATTRACTIVE":
        score += 20
    elif row["Dividend_Signal"] == "MODERATE":
        score += 10

    if row["Profitability_Signal"] == "STRONG":
        score += 25
    elif row["Profitability_Signal"] == "POSITIVE":
        score += 15

    if row["Analyst_Signal"] == "BULLISH":
        score += 25
    elif row["Analyst_Signal"] == "NEUTRAL":
        score += 15

    if pd.notna(row["Payout_Ratio"]):
        if row["Payout_Ratio"] <= 60:
            score += 25
        elif row["Payout_Ratio"] <= 80:
            score += 15
        elif row["Payout_Ratio"] > 100:
            score -= 20

    return max(0, min(score, 100))


div["Fundamental_Score"] = div.apply(
    calculate_score, axis=1
)

div["Fundamental_Rank"] = div["Fundamental_Score"].rank(
    ascending=False, method="min"
).astype(int)

dividend_analysis = div.sort_values(
    "Fundamental_Score", ascending=False
).reset_index(drop=True)


# IPO date normalization
ipo_analysis = ipo_df.copy()

if not ipo_analysis.empty:

    ipo_analysis["IPO_Event_Date"] = pd.to_datetime(
        ipo_analysis["date"], errors="coerce"
    )

    today = pd.Timestamp.today().normalize()

    ipo_analysis["IPO_Status"] = np.select(
        [
            ipo_analysis["IPO_Event_Date"].isna(),
            ipo_analysis["IPO_Event_Date"] < today,
            ipo_analysis["IPO_Event_Date"] <= today + pd.Timedelta(days=30)
        ],
        [
            "DATE UNKNOWN",
            "PAST EVENT",
            "UPCOMING 30 DAYS"
        ],
        default="UPCOMING"
    )

print("Fundamental analysis completed.")
display(dividend_analysis)
Cell 5 — MarketFlow Trader Intelligence Dashboard
The fifth cell integrates the dividend rankings, fundamental stock assessments, IPO event monitoring, and automated interpretations into a single dashboard.
The dividend intelligence table displays the main financial variables, including dividend yield, dividend rate, payout ratio, P/E ratio, forward P/E, dividend classification, profitability, analyst sentiment, fundamental score, and ranking.
The top-five fundamental stocks are then displayed with their corresponding financial indicators and analyst recommendations.
The IPO section presents available event information, including ticker, company name, exchange, reported date, status, and price range when those fields are returned by the API.
Finally, the dashboard calculates summary statistics and generates automated watchlist classifications. The resulting dividend and IPO datasets are exported into separate CSV files for further analysis.
Code — Cell 5
# CELL 5: MARKETFLOW TRADER DASHBOARD

from IPython.display import display, Markdown

display(Markdown("""
# MARKETFLOW TRADER INTELLIGENCE
### Fundamental & IPO Monitoring Dashboard
"""))

print("Analysis Date:", datetime.now().strftime("%Y-%m-%d %H:%M"))
print("=" * 65)


# 1. DIVIDEND RANKING
display(Markdown("## 1. Dividend Intelligence Ranking"))

dividend_cols = [
    "ticker",
    "Dividend_Yield",
    "Dividend_Rate",
    "Payout_Ratio",
    "PERatio",
    "ForwardPE",
    "Dividend_Signal",
    "Profitability_Signal",
    "Analyst_Signal",
    "Fundamental_Score",
    "Fundamental_Rank"
]

available_cols = [
    c for c in dividend_cols
    if c in dividend_analysis.columns
]

display(
    dividend_analysis[available_cols]
    .style
    .format({
        "Dividend_Yield": "{:.2f}%",
        "Dividend_Rate": "${:.3f}",
        "Payout_Ratio": "{:.2f}%",
        "PERatio": "{:.2f}",
        "ForwardPE": "{:.2f}",
        "Fundamental_Score": "{:.0f}"
    }, na_rep="N/A")
    .background_gradient(
        subset=["Fundamental_Score"],
        cmap="RdYlGn"
    )
)


# 2. FUNDAMENTAL LEADERS
display(Markdown("## 2. Top Fundamental Stocks"))

top_stocks = dividend_analysis.head(5)

for _, row in top_stocks.iterrows():

    print(
        f"\n{row['Fundamental_Rank']}. {row['ticker']} | "
        f"Score: {row['Fundamental_Score']}/100"
    )

    print("Dividend Yield:", row["Dividend_Yield"])
    print("Payout Ratio:", row["Payout_Ratio"])
    print("Dividend Signal:", row["Dividend_Signal"])
    print("Profitability:", row["Profitability_Signal"])
    print("Analyst:", row["Analyst_Sentiment"])
    print("Recommendation:", row["Analyst_Recommendation"])


# 3. IPO EVENT MONITOR
display(Markdown("## 3. IPO Event Intelligence"))

if not ipo_analysis.empty:

    ipo_cols = [
        c for c in [
            "ticker", "name", "exchange",
            "date", "status",
            "price_range_price_from",
            "price_range_price_to",
            "IPO_Status"
        ] if c in ipo_analysis.columns
    ]

    display(ipo_analysis[ipo_cols])

    print("\nIPO Status Distribution:")
    display(ipo_analysis["IPO_Status"].value_counts())

else:
    print("No IPO events available.")


# 4. MARKET SUMMARY
display(Markdown("## 4. Trader Summary"))

print("Total Stocks:", len(dividend_analysis))

print(
    "High Dividend:",
    (dividend_analysis["Dividend_Signal"] == "HIGH DIVIDEND").sum()
)

print(
    "Attractive Dividend:",
    (dividend_analysis["Dividend_Signal"] == "ATTRACTIVE").sum()
)

print(
    "Dividend Risk:",
    (dividend_analysis["Dividend_Signal"] == "DIVIDEND RISK").sum()
)

print(
    "Strong Profitability:",
    (dividend_analysis["Profitability_Signal"] == "STRONG").sum()
)

print(
    "Bullish Analyst:",
    (dividend_analysis["Analyst_Signal"] == "BULLISH").sum()
)

print("IPO Events:", len(ipo_analysis))


# 5. AUTOMATED TRADER INTERPRETATION
display(Markdown("## 5. Automated Fundamental Interpretation"))

for _, row in dividend_analysis.iterrows():

    ticker = row["ticker"]
    score = row["Fundamental_Score"]

    if row["Dividend_Signal"] == "DIVIDEND RISK":
        action = "CAUTION - DIVIDEND SUSTAINABILITY RISK"

    elif score >= 70:
        action = "PRIORITY WATCHLIST"

    elif score >= 50:
        action = "WATCHLIST"

    else:
        action = "FURTHER ANALYSIS REQUIRED"

    print(
        f"{ticker}: {action} | "
        f"Score: {score}/100"
    )


# 6. EXPORT
dividend_analysis.to_csv(
    "marketflow_dividend_intelligence.csv",
    index=False
)

ipo_analysis.to_csv(
    "marketflow_ipo_intelligence.csv",
    index=False
)

print("\n" + "=" * 65)
print("ANALYSIS COMPLETED")
print("CSV EXPORT SUCCESSFUL")
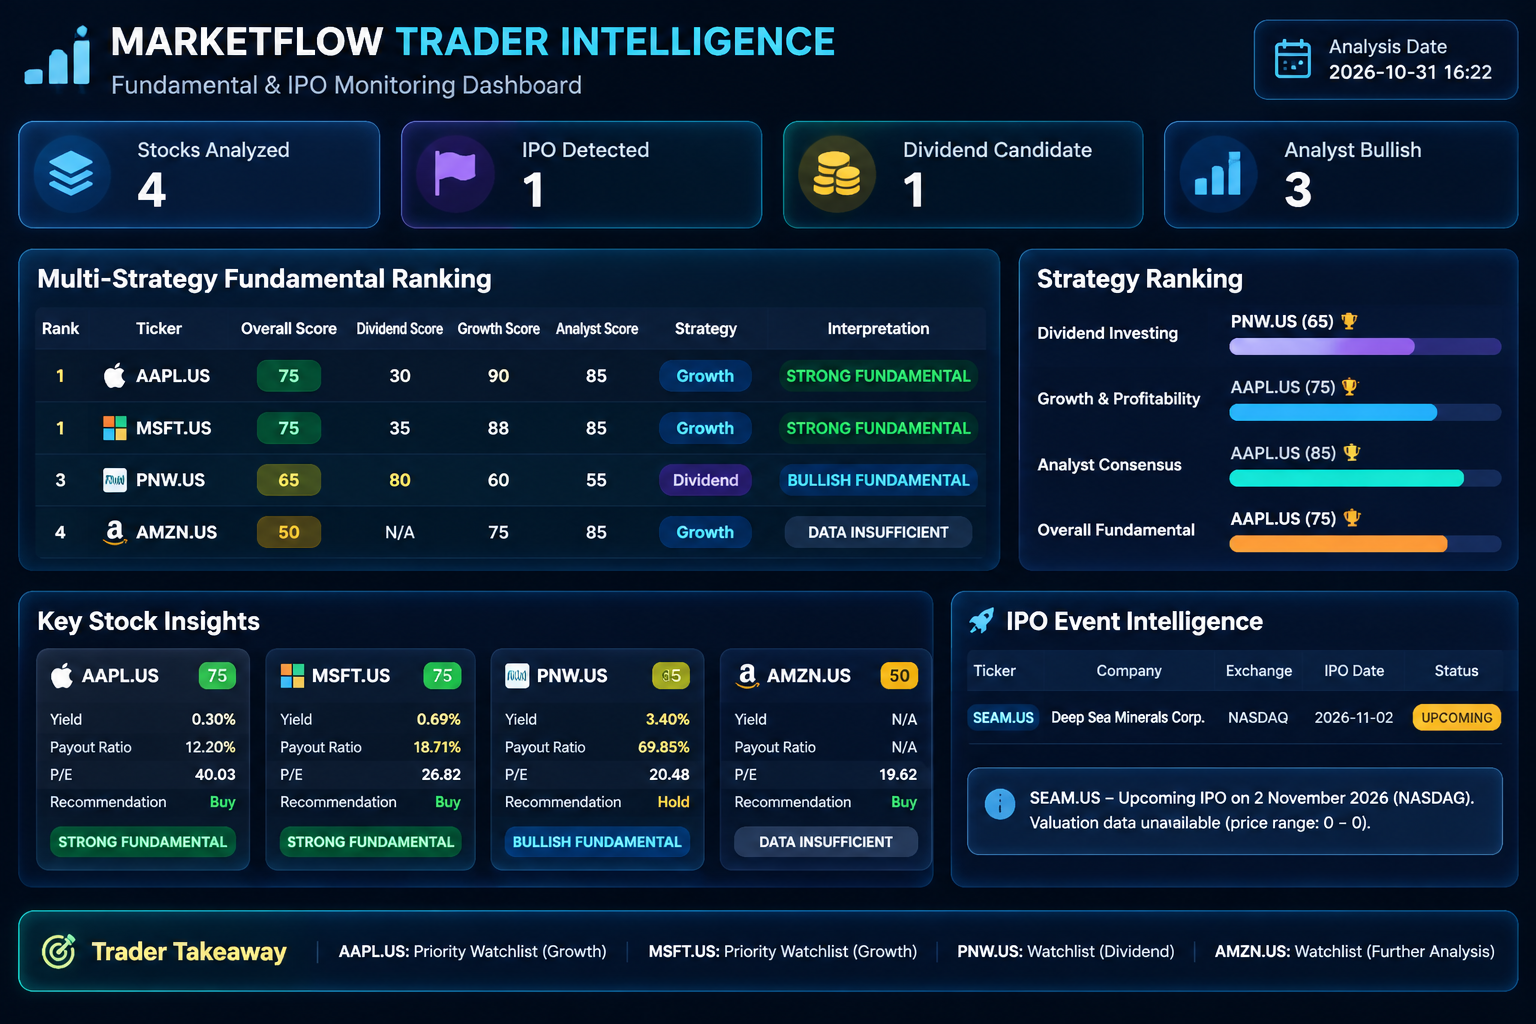
Result:
4. Results and Discussion
4.1. Dividend Fundamental Data Retrieval
The dividend data collection module retrieves financial information for PNW.US, AAPL.US, MSFT.US, and AMZN.US. Each API response is processed independently, allowing the system to retain successfully retrieved records even when one or more requests fail.
The resulting dataset contains company information, sector classification, dividend indicators, earnings metrics, profitability measures, valuation ratios, and analyst recommendations.
This structure provides a foundation for comparing the selected companies across several fundamental dimensions. However, the number of successfully retrieved stocks depends on API availability, authentication, endpoint compatibility, and data coverage.
4.2. Dividend Yield and Sustainability Assessment
The dividend intelligence module evaluates dividend yield, dividend rate, and payout ratio to classify the selected stocks.
Dividend yield provides an indication of dividend income relative to the stock price, while the payout ratio measures the relationship between dividend payments and earnings per share.
The system distinguishes between high-dividend, attractive, moderate, low-dividend, no-dividend, and dividend-risk classifications. This makes it possible to identify stocks that satisfy the predefined dividend criteria and those that may require additional sustainability analysis.
A high dividend yield should not automatically be interpreted as a favorable investment characteristic. The payout ratio, earnings consistency, and broader financial condition of the company must also be considered.
4.3. Profitability and Company Fundamentals
Profitability assessment combines profit margin and return on equity. Companies with both indicators above 10% receive a strong profitability classification under the program's predefined rules.
Companies with positive but lower profitability indicators are categorized as positive, while companies with zero or negative values receive a weak classification.
These measurements provide a simplified perspective on financial performance. Nevertheless, profitability should also be evaluated in relation to industry characteristics, business models, capital structure, and historical performance.
4.4. Analyst Sentiment and Fundamental Scoring
The analyst sentiment module categorizes reported market expectations into bullish, bearish, neutral, and unknown classifications.
These classifications are incorporated into the fundamental scoring model together with dividend quality, profitability, and payout ratio.
The resulting score ranges from 0 to 100 and is used to rank the four selected securities. Higher scores indicate stronger alignment with the program's predefined evaluation criteria.
The scoring model provides a consistent screening framework, but it does not establish intrinsic value or expected investment returns. Its usefulness depends on the quality of the input data and the appropriateness of the scoring thresholds.
4.5. IPO Event Intelligence
The IPO monitoring module processes event records returned by the MarketFlow API within the selected 90-day reporting window.
Each event is evaluated according to its reported date and assigned one of four classifications:
DATE UNKNOWN: the IPO event date cannot be identified.
PAST EVENT: the reported date is earlier than the current date.
UPCOMING 30 DAYS: the event is scheduled within the following 30 days.
UPCOMING: the event is scheduled beyond the initial 30-day window.
The dashboard presents available IPO identifiers, company names, exchanges, event dates, statuses, and price ranges.
This functionality helps organize IPO-related information and identify events that may require further investigation. However, the classification depends on the date returned by the API and does not independently verify whether an IPO has been completed, postponed, or canceled.
4.6. Fundamental Ranking and Automated Watchlist
The dashboard combines the results of dividend analysis, profitability assessment, analyst sentiment, and payout ratio into a ranked fundamental watchlist.
The automated interpretation applies three primary categories:
Fundamental score | Dashboard classification |
|---|---|
70–100 | Priority Watchlist |
50–69 | Watchlist |
0–49 | Further Analysis Required |
An additional caution classification is applied when a stock receives a dividend-risk designation.
This approach allows analysts to prioritize stocks for further investigation while maintaining a consistent evaluation process.
However, a high fundamental score does not necessarily indicate that a stock is undervalued or suitable for immediate purchase. The ranking should be considered alongside valuation, financial statements, market conditions, and individual investment objectives.
4.7. Limitations and Future Improvements
Several limitations should be considered when interpreting the results.
First, the dividend watchlist is limited to four stocks. The results therefore provide a comparison of selected securities rather than a comprehensive assessment of the broader stock market.
Second, the fundamental scoring model uses predefined thresholds. The weights assigned to dividend quality, profitability, analyst sentiment, and payout ratio are analytical assumptions rather than statistically validated predictors of future returns.
Third, the accuracy of the payout ratio depends on the API's dividend-rate and EPS definitions. Differences in reporting periods, units, and currency conventions may affect the calculated results.
Fourth, the IPO monitoring module depends on the structure and completeness of the API response. Missing dates or unavailable event records may limit the accuracy of the classification.
Fifth, the current system does not perform historical backtesting of its fundamental ranking. Consequently, it cannot establish whether stocks with higher scores subsequently outperform stocks with lower scores.
Future improvements could include expanding the stock universe, incorporating cash-flow analysis, comparing historical dividend growth, adding debt and liquidity ratios, validating the fundamental scoring model, and tracking IPO event changes over time.
These developments would create a more comprehensive financial intelligence framework for fundamental stock screening and IPO monitoring.
5. Conclusion
MarketFlow Trader Intelligence demonstrates how Python can integrate dividend fundamental analysis, profitability assessment, analyst sentiment evaluation, and IPO event monitoring into a unified financial research workflow.
The framework retrieves financial data through the MarketFlow API, normalizes the responses, calculates dividend yield and payout ratio, evaluates company profitability, classifies analyst sentiment, and generates a fundamental score between 0 and 100.
The IPO monitoring component complements the stock analysis by identifying reported upcoming events and organizing them according to their scheduled dates. Together, these functions provide a structured dashboard for examining selected investment opportunities.
The fundamental ranking and automated watchlist help prioritize securities for further research. However, the resulting classifications are based on predefined analytical rules and should not be interpreted as guaranteed investment recommendations.
Future development should focus on expanding financial coverage, validating the scoring methodology, incorporating additional financial ratios, and evaluating historical ranking performance. With these improvements, MarketFlow Trader Intelligence can serve as a foundation for more comprehensive automated fundamental research and financial market monitoring.