
Financial markets involve various instruments, corporate actions, and financial events that influence how investors monitor market conditions and evaluate potential investment opportunities. Access to structured financial information is therefore an important component of financial research and market intelligence.
Market discovery is one of the initial stages in financial data analysis. It allows analysts to identify instruments associated with a particular search query and retrieve relevant information from financial data providers. In addition to instrument identification, corporate financial events such as dividend declarations, ex-dividend dates, record dates, and payment dates provide supplementary information about publicly reported corporate activities.
Dividend events are particularly relevant to equity market analysis because they represent information about distributions made by companies to shareholders. These events may be examined to understand corporate financial schedules and identify instruments associated with dividend-related activities.
However, financial information is frequently distributed across different API endpoints and returned in nested JSON structures. Processing these responses manually can be time-consuming and may create inconsistencies when combining data from multiple sources.
Python provides an effective environment for automating financial data retrieval, normalization, statistical analysis, and visualization. By integrating financial APIs with libraries such as Requests, Pandas, NumPy, and Matplotlib, analysts can transform raw financial information into structured datasets and analytical reports.
This article presents the MarketFlow Trader Intelligence Analyzer, a Python-based financial intelligence framework developed using the MarketFlow All-in-One Market Finance API through RapidAPI.
The system is configured with the search query XAUUSD to perform market discovery through the /v2/search/market endpoint. The system also retrieves dividend event information through the /dividens-events endpoint for the period November 2–9, 2025.
The analytical workflow consists of five computational stages. These stages include API configuration, market discovery, dividend event retrieval, data processing, and dashboard generation.
The market discovery module identifies financial instruments returned by the XAUUSD search query. Meanwhile, the dividend intelligence module processes corporate event records, identifies relevant data fields, standardizes instrument symbols and dates, and calculates descriptive statistics.
The system subsequently classifies dividend events into several categories and generates an instrument ranking based on the number of associated events.
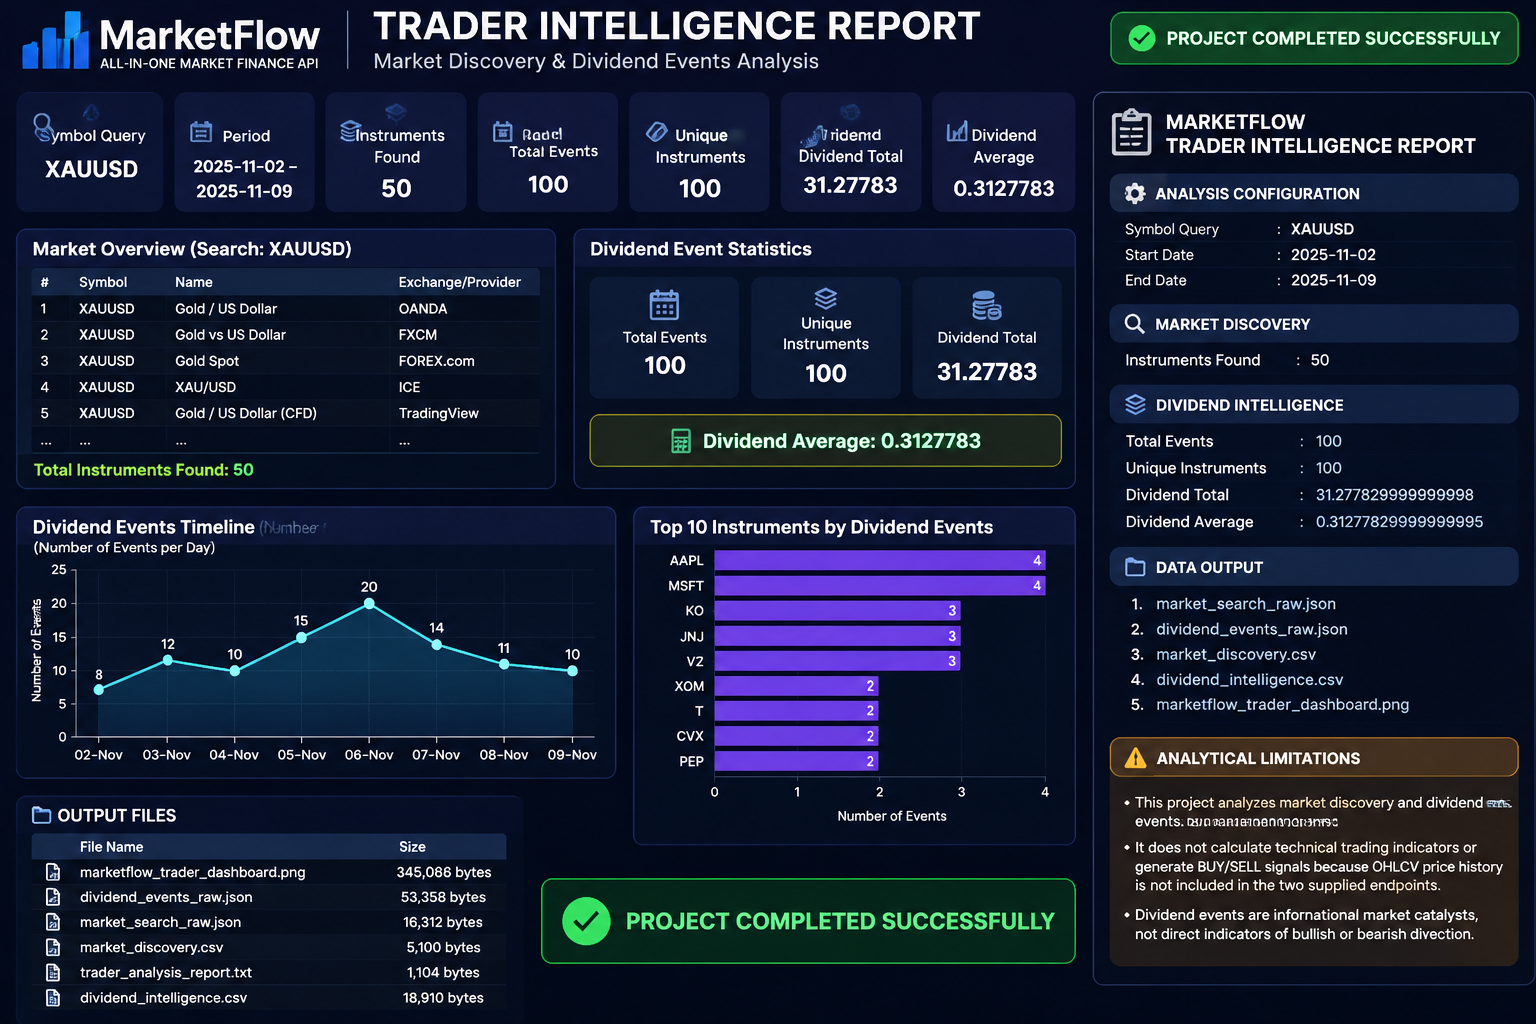
The final analytical outputs include raw JSON files, processed CSV datasets, a four-panel financial dashboard, and a consolidated text report.
The primary objective of this project is to develop an automated Python workflow that integrates market discovery and dividend event intelligence into a structured financial monitoring system.
An important distinction is that the XAUUSD search query and dividend event dataset are two separate information sources within the framework. The retrieved dividend events are not automatically established as dividend events belonging to gold or XAUUSD itself.
2. Methodology
The MarketFlow Trader Intelligence Analyzer is organized into five computational cells. Each cell performs a specific function within the data collection, processing, statistical analysis, and visualization workflow.
Cell | Main function |
|---|---|
Cell 1 | Library imports, RapidAPI authentication, analysis configuration, and API request function. |
Cell 2 | XAUUSD market discovery and raw JSON extraction. |
Cell 3 | Dividend event retrieval and JSON normalization. |
Cell 4 | Dividend data processing, event classification, and statistical analysis. |
Cell 5 | Financial dashboard visualization, CSV exports, and report generation. |
2.1. System Configuration and API Integration
The system uses Python libraries including Requests, Pandas, NumPy, Matplotlib, JSON, and Pathlib.
Requests manages HTTP communication with the MarketFlow API, while Pandas processes financial records into structured DataFrames. NumPy supports numerical calculations, and Matplotlib generates dashboard visualizations.
API authentication is performed through a RapidAPI key. The source code first attempts to retrieve the key from the RAPIDAPI_KEY environment variable. If the variable is unavailable, the program requests the key through Python's getpass function.
The analysis configuration defines the XAUUSD search query, reporting period, pagination offset, and output directory.
The reporting period is configured from November 2, 2025, to November 9, 2025. All generated files are stored in the marketflow_intelligence_output directory.
Code — Cell 1: Library Imports, Configuration, and API Authentication
# ============================================================
# CELL 1 - MARKETFLOW MARKET INTELLIGENCE ANALYZER
# ============================================================

import os
import json
import requests
import pandas as pd
import numpy as np
import matplotlib.pyplot as plt
import matplotlib.dates as mdates

from getpass import getpass
from pathlib import Path
from IPython.display import display, Markdown

# ============================================================
# RAPIDAPI CONFIGURATION
# ============================================================

API_HOST = "marketflow-all-in-one-market-finance-api.p.rapidapi.com"

BASE_URL = f"https://{API_HOST}"

API_KEY = os.getenv("RAPIDAPI_KEY") or getpass(
    "Masukkan RapidAPI Key: "
)

HEADERS = {
    "x-rapidapi-key": API_KEY,
    "x-rapidapi-host": API_HOST
}

# ============================================================
# ANALYSIS CONFIGURATION
# ============================================================

SYMBOL_QUERY = "XAUUSD"

START_DATE = "2025-11-02"
END_DATE = "2025-11-09"

SKIP = 0

OUTPUT_DIR = Path("marketflow_intelligence_output")
OUTPUT_DIR.mkdir(exist_ok=True)

# ============================================================
# API REQUEST FUNCTION
# ============================================================

def api_get(endpoint, params=None):

    url = f"{BASE_URL}{endpoint}"

    try:
        response = requests.get(
            url,
            headers=HEADERS,
            params=params,
            timeout=30
        )

        print(f"\nEndpoint : {endpoint}")
        print(f"HTTP     : {response.status_code}")

        response.raise_for_status()

        return response.json()

    except requests.exceptions.HTTPError:
        print("API ERROR:", response.text[:1500])
        raise

    except requests.exceptions.RequestException as e:
        print("CONNECTION ERROR:", str(e))
        raise

print("=" * 65)
print("MARKETFLOW MARKET INTELLIGENCE ANALYZER")
print("=" * 65)

print("Symbol       :", SYMBOL_QUERY)
print("Start Date   :", START_DATE)
print("End Date     :", END_DATE)
print("Output       :", OUTPUT_DIR)
print("API Status   : Configuration Ready")
2.2. Market Discovery: XAUUSD
The second computational cell performs market discovery using the XAUUSD search query.
The system accesses the /v2/search/market endpoint and submits XAUUSD as the search parameter.
The original API response is stored in JSON format as market_search_raw.json. This preserves the retrieved information for subsequent verification and analysis.
A flexible JSON extraction function is implemented to identify records within different nested response structures.
The extract_records() function supports both list-based and dictionary-based JSON responses. When multiple nested record collections are available, the function selects the collection containing the largest number of records.
The extracted records are converted into a Pandas DataFrame using pd.json_normalize().
The resulting dataset provides an overview of instruments identified by the market discovery process.
Code — Cell 2: Market Discovery and JSON Normalization
# ============================================================
# CELL 2 - MARKET DISCOVERY
# ============================================================

market_json = api_get(
    "/v2/search/market",
    params={
        "query": SYMBOL_QUERY
    }
)

# Save raw response
with open(
    OUTPUT_DIR / "market_search_raw.json",
    "w",
    encoding="utf-8"
) as f:

    json.dump(
        market_json,
        f,
        indent=4,
        ensure_ascii=False
    )

print("\nMARKET SEARCH RESPONSE")
print("=" * 65)

print(json.dumps(
    market_json,
    indent=2,
    ensure_ascii=False
)[:5000])

# ============================================================
# FLEXIBLE JSON NORMALIZATION
# ============================================================

def extract_records(data):

    if isinstance(data, list):

        return [
            x for x in data
            if isinstance(x, dict)
        ]

    if isinstance(data, dict):

        candidates = []

        for key, value in data.items():

            if isinstance(value, list):

                records = extract_records(value)

                if records:
                    candidates.append(records)

            elif isinstance(value, dict):

                records = extract_records(value)

                if records:
                    candidates.append(records)

        if candidates:
            return max(candidates, key=len)

        return [data]

    return []


market_records = extract_records(market_json)

market_df = pd.json_normalize(market_records)

print("\nMARKET DISCOVERY RESULT")
print("=" * 65)

if not market_df.empty:

    display(market_df)

    print("\nTotal Instruments Found:", len(market_df))

else:

    print("No market records detected.")

print("\nAvailable Columns:")
print(market_df.columns.tolist())
2.3. Dividend Events Data Collection
The third computational cell retrieves dividend-related financial events.
The system accesses the /dividens-events endpoint using three parameters:
skip: pagination offset, configured as zero.start_date: beginning of the reporting period.end_date: end of the reporting period.
The original response is stored in dividend_events_raw.json to preserve the source data.
The extracted records are subsequently converted into a Pandas DataFrame using pd.json_normalize() with an underscore separator for nested field names.
This normalization process makes the dividend event information easier to examine and prepares the dataset for subsequent statistical analysis.
The system also displays the total number of retrieved records and available data fields.
Code — Cell 3: Dividend Events Data Collection
# ============================================================
# CELL 3 - DIVIDEND EVENTS DATA COLLECTION
# ============================================================

dividend_json = api_get(
    "/dividens-events",
    params={
        "skip": SKIP,
        "start_date": START_DATE,
        "end_date": END_DATE
    }
)

# Save raw dividend response
with open(
    OUTPUT_DIR / "dividend_events_raw.json",
    "w",
    encoding="utf-8"
) as f:

    json.dump(
        dividend_json,
        f,
        indent=4,
        ensure_ascii=False
    )

print("\nDIVIDEND EVENTS RESPONSE")
print("=" * 65)

print(json.dumps(
    dividend_json,
    indent=2,
    ensure_ascii=False
)[:5000])

# ============================================================
# CONVERT TO DATAFRAME
# ============================================================

dividend_records = extract_records(dividend_json)

dividend_df = pd.json_normalize(
    dividend_records,
    sep="_"
)

print("\nDIVIDEND EVENTS DATA")
print("=" * 65)

if not dividend_df.empty:

    print("Total Events:", len(dividend_df))

    display(dividend_df.head(20))

else:

    print("No dividend events found.")

print("\nAvailable Fields:")
print(dividend_df.columns.tolist())
2.4. Data Processing and Dividend Intelligence Analysis
The fourth computational cell performs the primary data processing and dividend intelligence calculations.
The system initially identifies important fields within the retrieved dividend dataset.
The find_column() function searches for relevant column names using predefined keywords. It identifies four main data categories:
Instrument identification through symbol, ticker, or stock fields.
Event dates through date, ex-dividend date, ex-date, or payment date fields.
Dividend amounts through dividend, amount, value, or cash amount fields.
Event categories through event type, type, or category fields.
After identifying the relevant fields, the system standardizes the information.
Instrument identifiers are converted into the ANALYZED_SYMBOL column. Event dates are converted into datetime format, while dividend amounts are transformed into numerical values.
The event classification mechanism subsequently categorizes records into six categories:
Event category | Classification criteria |
|---|---|
EX-DIVIDEND | Event description contains ex-dividend or ex_dividend. |
PAYMENT | Event description contains payment. |
RECORD DATE | Event description contains record. |
DECLARATION | Event description contains declaration. |
DIVIDEND | Event description contains dividend. |
OTHER | No predefined keyword is identified. |
The system then calculates four main statistical measurements:
Total Events
\[ Total\ Events = N \]
Where \(N\) represents the number of retrieved dividend event records.
Unique Instruments
\[ Unique\ Instruments = Count(Distinct\ Symbols) \]
This calculation identifies the number of different instruments represented in the dividend dataset.
Dividend Total
\[ Dividend\ Total = \sum_{i=1}^{N} Dividend_i \]
Dividend Average
\[ Dividend\ Average = \frac{\sum_{i=1}^{N} Dividend_i}{N} \]
These calculations provide descriptive information about the retrieved dividend events.
The system also generates an instrument ranking by grouping records according to their normalized symbols and counting the number of dividend events associated with each instrument.
Code — Cell 4: Full Dividend Intelligence Engine
# ============================================================
# CELL 4 - DIVIDEND INTELLIGENCE ENGINE
# ============================================================

analysis_df = dividend_df.copy()

# ============================================================
# IDENTIFY IMPORTANT COLUMNS
# ============================================================

def find_column(df, keywords):

    for col in df.columns:

        name = col.lower().replace("_", "")

        if any(k.replace("_", "") in name for k in keywords):
            return col

    return None


symbol_col = find_column(
    analysis_df,
    ["symbol", "ticker", "stock"]
)

date_col = find_column(
    analysis_df,
    [
        "date",
        "ex_dividend_date",
        "exdate",
        "payment_date"
    ]
)

dividend_col = find_column(
    analysis_df,
    [
        "dividend",
        "amount",
        "value",
        "cash_amount"
    ]
)

event_type_col = find_column(
    analysis_df,
    [
        "event_type",
        "type",
        "category"
    ]
)

# ============================================================
# STANDARDIZE DATA
# ============================================================

if symbol_col:

    analysis_df["ANALYZED_SYMBOL"] = (
        analysis_df[symbol_col].astype(str)
    )

if date_col:

    analysis_df["ANALYZED_DATE"] = pd.to_datetime(
        analysis_df[date_col],
        errors="coerce",
        utc=True
    ).dt.tz_convert(None)

if dividend_col:

    analysis_df["DIVIDEND_VALUE"] = pd.to_numeric(
        analysis_df[dividend_col],
        errors="coerce"
    )

if event_type_col:

    analysis_df["EVENT_CATEGORY"] = (
        analysis_df[event_type_col].astype(str)
    )

# ============================================================
# EVENT CLASSIFICATION
# ============================================================

def classify_event(value):

    value = str(value).lower()

    if "ex-dividend" in value or "ex_dividend" in value:
        return "EX-DIVIDEND"

    elif "payment" in value:
        return "PAYMENT"

    elif "record" in value:
        return "RECORD DATE"

    elif "declaration" in value:
        return "DECLARATION"

    elif "dividend" in value:
        return "DIVIDEND"

    return "OTHER"


if "EVENT_CATEGORY" in analysis_df.columns:

    analysis_df["EVENT_CLASS"] = (
        analysis_df["EVENT_CATEGORY"].apply(classify_event)
    )

elif not analysis_df.empty:

    analysis_df["EVENT_CLASS"] = "DIVIDEND EVENT"

# ============================================================
# EVENT STATISTICS
# ============================================================

total_events = len(analysis_df)

unique_symbols = (
    analysis_df["ANALYZED_SYMBOL"].nunique()
    if "ANALYZED_SYMBOL" in analysis_df.columns
    else 0
)

if "DIVIDEND_VALUE" in analysis_df.columns:

    dividend_total = analysis_df["DIVIDEND_VALUE"].sum()

    dividend_average = analysis_df["DIVIDEND_VALUE"].mean()

else:

    dividend_total = np.nan
    dividend_average = np.nan

print("=" * 65)
print("DIVIDEND INTELLIGENCE REPORT")
print("=" * 65)

print("Total Events       :", total_events)
print("Unique Instruments :", unique_symbols)
print("Dividend Total     :", dividend_total)
print("Dividend Average   :", dividend_average)

# ============================================================
# EVENT DISTRIBUTION
# ============================================================

if "EVENT_CLASS" in analysis_df.columns:

    print("\nEVENT CLASSIFICATION")

    display(
        analysis_df["EVENT_CLASS"]
        .value_counts()
        .rename_axis("Event Type")
        .reset_index(name="Count")
    )

# ============================================================
# SYMBOL RANKING
# ============================================================

if "ANALYZED_SYMBOL" in analysis_df.columns:

    symbol_ranking = (
        analysis_df.groupby("ANALYZED_SYMBOL")
        .size()
        .sort_values(ascending=False)
        .reset_index(name="EVENT_COUNT")
    )

    print("\nINSTRUMENT EVENT RANKING")

    display(symbol_ranking.head(20))

# ============================================================
# SAVE PROCESSED DATA
# ============================================================

analysis_df.to_csv(
    OUTPUT_DIR / "dividend_intelligence.csv",
    index=False
)

print("\nData processing completed.")
2.5. Trader Dashboard, Visualization, and Data Export
The fifth computational cell integrates market discovery and dividend intelligence results into a consolidated dashboard.
The visualization uses a two-by-two subplot arrangement with a figure size of 17 × 11 inches.
The dashboard consists of four analytical components.
1. Market Overview
The first panel presents the XAUUSD search query, number of discovered instruments, API status, reporting period, and selected market data fields.
2. Dividend Event Statistics
The second panel compares the total number of dividend events with the number of unique instruments.
3. Dividend Events Timeline
The third panel displays the distribution of dividend events across the available event dates.
The visualization uses a time-series line chart with date formatting to provide a chronological overview of retrieved events.
4. Top 10 Dividend Event Instruments
The fourth panel presents the ten instruments with the highest number of associated dividend event records.
The dashboard is saved as marketflow_trader_dashboard.png with a resolution of 300 DPI.
In addition to the visualization, the system exports the market discovery dataset and generates a consolidated text report containing the analysis configuration, market discovery results, dividend statistics, generated files, and analytical limitations.
Code — Cell 5: Full Dashboard, Visualization, and Export
# ============================================================
# CELL 5 - TRADER INTELLIGENCE DASHBOARD
# ============================================================

fig, axes = plt.subplots(
    2, 2,
    figsize=(17, 11)
)

fig.suptitle(
    "MARKETFLOW TRADER INTELLIGENCE DASHBOARD",
    fontsize=17,
    fontweight="bold"
)

# ============================================================
# 1. MARKET DISCOVERY
# ============================================================

ax = axes[0, 0]

ax.axis("off")

market_text = f"""
MARKET DISCOVERY

Query              : {SYMBOL_QUERY}
Instruments Found  : {len(market_df)}

API Status         : SUCCESS
Analysis Period    : {START_DATE}
                     {END_DATE}

Market Fields:
{', '.join(market_df.columns[:8].astype(str))
 if not market_df.empty else 'No data'}
"""

ax.text(
    0.03, 0.95,
    market_text,
    verticalalignment="top",
    fontsize=10,
    family="monospace"
)

ax.set_title("Market Overview")

# ============================================================
# 2. DIVIDEND EVENT SUMMARY
# ============================================================

ax = axes[0, 1]

summary_labels = [
    "Total Events",
    "Unique Symbols"
]

summary_values = [
    total_events,
    unique_symbols
]

ax.bar(
    summary_labels,
    summary_values
)

ax.set_title("Dividend Event Statistics")
ax.set_ylabel("Count")

for i, value in enumerate(summary_values):

    ax.text(
        i,
        value,
        str(value),
        ha="center",
        va="bottom"
    )

# ============================================================
# 3. EVENT DISTRIBUTION BY DATE
# ============================================================

ax = axes[1, 0]

if (
    "ANALYZED_DATE" in analysis_df.columns
    and analysis_df["ANALYZED_DATE"].notna().any()
):

    daily_events = (
        analysis_df.dropna(subset=["ANALYZED_DATE"])
        .groupby(
            analysis_df.dropna(
                subset=["ANALYZED_DATE"]
            )["ANALYZED_DATE"].dt.date
        )
        .size()
    )

    ax.plot(
        pd.to_datetime(daily_events.index),
        daily_events.values,
        marker="o"
    )

    ax.xaxis.set_major_formatter(
        mdates.DateFormatter("%d-%b")
    )

    ax.tick_params(axis="x", rotation=45)

    ax.set_ylabel("Number of Events")

else:

    ax.text(
        0.5, 0.5,
        "No valid event dates available",
        ha="center",
        va="center",
        transform=ax.transAxes
    )

ax.set_title("Dividend Events Timeline")
ax.grid(alpha=0.3)

# ============================================================
# 4. TOP INSTRUMENTS
# ============================================================

ax = axes[1, 1]

if "ANALYZED_SYMBOL" in analysis_df.columns:

    top_symbols = (
        analysis_df["ANALYZED_SYMBOL"]
        .value_counts()
        .head(10)
        .sort_values()
    )

    if not top_symbols.empty:

        top_symbols.plot(
            kind="barh",
            ax=ax
        )

        ax.set_xlabel("Number of Events")

    else:

        ax.text(
            0.5, 0.5,
            "No instrument data",
            ha="center",
            va="center",
            transform=ax.transAxes
        )

else:

    ax.text(
        0.5, 0.5,
        "Symbol field unavailable",
        ha="center",
        va="center",
        transform=ax.transAxes
    )

ax.set_title("Top 10 Dividend Event Instruments")

# ============================================================
# FINAL LAYOUT
# ============================================================

plt.tight_layout(rect=[0, 0, 1, 0.95])

dashboard_path = (
    OUTPUT_DIR / "marketflow_trader_dashboard.png"
)

plt.savefig(
    dashboard_path,
    dpi=300,
    bbox_inches="tight"
)

plt.show()

# ============================================================
# EXPORT MARKET DATA
# ============================================================

market_df.to_csv(
    OUTPUT_DIR / "market_discovery.csv",
    index=False
)

# ============================================================
# GENERATE ANALYSIS REPORT
# ============================================================

report = f"""
============================================================
MARKETFLOW TRADER INTELLIGENCE REPORT
============================================================

ANALYSIS CONFIGURATION

Symbol Query       : {SYMBOL_QUERY}
Start Date         : {START_DATE}
End Date           : {END_DATE}

MARKET DISCOVERY

Instruments Found  : {len(market_df)}

DIVIDEND INTELLIGENCE

Total Events       : {total_events}
Unique Instruments : {unique_symbols}
Dividend Total     : {dividend_total}
Dividend Average   : {dividend_average}

DATA OUTPUT

1. market_search_raw.json
2. dividend_events_raw.json
3. market_discovery.csv
4. dividend_intelligence.csv
5. marketflow_trader_dashboard.png

============================================================
ANALYTICAL LIMITATIONS

This project analyzes market discovery and dividend events.

It does not calculate technical trading indicators or
generate BUY/SELL signals because OHLCV price history
is not included in the two supplied endpoints.

Dividend events are informational market catalysts,
not direct indicators of bullish or bearish direction.

============================================================
"""

with open(
    OUTPUT_DIR / "trader_analysis_report.txt",
    "w",
    encoding="utf-8"
) as f:

    f.write(report)

print(report)

print("\n" + "=" * 65)
print("PROJECT COMPLETED SUCCESSFULLY")
print("=" * 65)

print("\nOUTPUT FILES:")

for file in OUTPUT_DIR.iterdir():

    print(
        f"{file.name:<40} "
        f"{file.stat().st_size:,} bytes"
    )
Result:
3. Results and Discussion
3.1. Market Discovery Results
The market discovery module retrieves financial instrument information using the XAUUSD search query.
The system accesses the /v2/search/market endpoint and converts the returned JSON records into a structured DataFrame.
The number of instruments identified is calculated using the total number of extracted records.
The market discovery results provide an overview of the instruments returned by the API in response to the XAUUSD query.
The original API response is preserved in market_search_raw.json, allowing the retrieved information to be examined independently of the normalized dataset.
It is important to note that the number of instruments returned by the search endpoint does not necessarily represent the number of unique XAUUSD trading pairs. The actual meaning depends on the structure and content of the API response.
3.2. Dividend Events Data Collection
The dividend intelligence module retrieves corporate event records for November 2–9, 2025.
The system stores the original response in JSON format before converting the extracted records into a Pandas DataFrame.
The normalization process makes nested API information more accessible and allows the program to identify relevant fields for further analysis.
The resulting dataset is used to identify dividend amounts, event dates, instrument symbols, and event classifications.
The number of retrieved records depends on API availability and the response returned by the data provider.
3.3. Dividend Event Classification
The classification mechanism organizes dividend records into six categories based on keywords contained in the event description.
These categories provide a descriptive overview of the types of corporate events identified by the system.
The classification results can help analysts distinguish between ex-dividend events, payment schedules, record dates, and dividend declarations.
However, the classification is based on keyword matching rather than a detailed examination of corporate action documentation.
Consequently, the accuracy of each category depends on the terminology used in the original API response.
3.4. Dividend Statistical Analysis
The system calculates the total number of events, unique instruments, aggregate dividend values, and average dividend values.
These measurements provide a basic statistical summary of the retrieved dataset.
The total number of events represents the number of records processed by the system, while unique instruments indicate the number of distinct symbols identified.
The aggregate dividend value represents the sum of the numerical values extracted from the selected dividend field.
The average dividend value represents the mean of those numerical observations.
These statistics should be interpreted according to the actual API field definitions. In particular, the aggregated dividend values should not automatically be interpreted as total cash distributions across the entire market because the source code does not normalize currencies, dividend frequencies, or payment units.
3.5. Instrument Event Ranking
The instrument ranking module groups dividend records according to their standardized symbols.
Each instrument receives an event count based on the number of records associated with its symbol.
The results are sorted in descending order, allowing the system to identify the ten instruments with the highest number of dividend event records.
This ranking provides a descriptive measurement of event frequency rather than dividend profitability or investment attractiveness.
3.6. Dashboard Visualization Results
The final dashboard combines market discovery and dividend intelligence into four visualization panels.
MarketFlow Trader Intelligence Dashboard
Market Overview
XAUUSD query and discovered instrument information.
Dividend Statistics
Total event count and unique instruments.
Dividend Timeline
Chronological distribution of dividend events.
Top 10 Instruments
Ranking based on dividend event frequency.
Dashboard structure follows the uploaded Python implementation. Actual chart values are produced during execution.
The dashboard is exported as a high-resolution PNG image with 300 DPI, making it suitable for analytical reports and research documentation.
3.7. Exported Analytical Outputs
The system generates five principal output files.
Filename | Description |
|---|---|
| Original XAUUSD market discovery response. |
| Original dividend event API response. |
| Structured market discovery dataset. |
| Processed dividend event dataset. |
| Four-panel financial intelligence dashboard. |
| Consolidated analytical report. |
These outputs provide a structured record of the data retrieval and processing workflow.
The raw JSON files preserve the original API responses, while CSV files provide datasets that can be used for additional analysis in Python, Excel, or other statistical applications.
3.8. Analytical Limitations and Future Improvements
Several limitations should be considered when interpreting the results.
First, market discovery and dividend event retrieval are separate analytical processes. The XAUUSD search query does not establish that all retrieved dividend events are directly associated with gold instruments.
Second, dividend event analysis depends on API field availability. If the expected symbol, date, dividend amount, or event type fields are unavailable, some statistical measurements may not be generated as intended.
Third, event classification uses keyword matching. This approach provides a straightforward classification mechanism but may not recognize every variation of corporate action terminology.
Fourth, the dividend total does not account for currency differences. The current implementation adds numerical dividend values without currency conversion or unit normalization.
Fifth, the system does not retrieve historical OHLCV price data. Consequently, it cannot calculate technical indicators such as RSI, MACD, moving averages, or Bollinger Bands.
Sixth, the framework does not generate BUY or SELL signals. Dividend events provide information about corporate financial activities but do not independently establish bullish or bearish market direction.
Future improvements could include:
Integration of historical market price data.
Currency normalization for dividend values.
Verification of dividend event dates and categories.
Identification of market instruments through standardized identifiers.
Dividend yield calculations using corresponding share prices.
Integration of earnings announcements and corporate actions.
Historical dividend event comparisons.
Automated market monitoring and reporting.
Integration of technical indicators for supported instruments.
These developments could expand the framework into a more comprehensive financial market intelligence platform.
4. Conclusion
This article presents the MarketFlow Trader Intelligence Analyzer, a Python-based financial data analysis framework developed using the MarketFlow All-in-One Market Finance API through RapidAPI.
The system integrates XAUUSD market discovery with dividend event intelligence for the period November 2–9, 2025.
The analytical workflow consists of API authentication, financial data retrieval, JSON extraction, DataFrame normalization, dividend field identification, event classification, statistical calculations, and dashboard visualization.
The framework calculates the number of dividend events, unique instruments, aggregate dividend values, and average dividend values. It also categorizes dividend events into six classifications and generates instrument rankings based on event frequency.
The visualization module integrates market discovery information, dividend statistics, event timelines, and top instrument rankings into a consolidated financial dashboard.
The system subsequently exports raw JSON responses, processed CSV datasets, dashboard images, and a text-based analytical report.
Overall, the MarketFlow Trader Intelligence Analyzer provides a practical foundation for automated financial data collection and dividend event monitoring using Python and financial APIs.
Nevertheless, the current framework focuses exclusively on market discovery and dividend event analysis. It does not calculate technical trading indicators or generate BUY/SELL recommendations because the retrieved endpoints do not provide the historical OHLCV price information required for those calculations.
Future development involving historical market prices, dividend yield calculations, currency normalization, and technical analysis integration could improve the analytical capabilities of the framework.