
Financial markets are influenced by multiple factors, including price movements, technical indicators, market sentiment, and economic developments. Traders and investors need reliable analytical tools to monitor these factors and identify potential market conditions. In particular, gold and cryptocurrency markets provide different but complementary opportunities for financial market observation.
Gold, represented by the XAUUSD trading pair, is widely monitored because of its role as a financial asset and its sensitivity to economic uncertainty, inflation expectations, interest rates, and changes in global market sentiment. Meanwhile, cryptocurrency markets operate continuously and are characterized by substantial price volatility, rapidly changing investor interest, and frequent market developments.
Technical analysis provides a systematic approach to examining historical price movements and identifying potential market trends. Indicators such as Exponential Moving Average (EMA), Relative Strength Index (RSI), Moving Average Convergence Divergence (MACD), and Average True Range (ATR) help traders evaluate market direction, momentum, and volatility.
However, monitoring these indicators manually can become complicated, particularly when traders also need to follow cryptocurrency market events and identify trending digital assets. Integrating these different information sources into one analytical environment can improve the efficiency of market monitoring.
Python offers an effective solution through automated data retrieval, numerical processing, and financial data analysis. Libraries such as Requests, Pandas, NumPy, and IPython enable developers to retrieve financial information, organize historical price records, calculate technical indicators, and generate structured analytical reports.
This article presents MarketFlow Trader Analysis, a Python-based financial market intelligence framework that integrates XAUUSD technical analysis with cryptocurrency event monitoring and trending asset discovery through the MarketFlow All-in-One Market Finance API.
The system retrieves three categories of market information: historical XAUUSD price data, cryptocurrency events, and trending cryptocurrency assets. Historical gold prices are processed into Open, High, Low, and Close (OHLC) observations, which are subsequently used to calculate EMA 20, EMA 50, RSI 14, MACD, and ATR 14.
The analytical framework also evaluates market direction using moving average relationships and MACD momentum. Recent support and resistance levels are calculated using the highest and lowest prices from the latest 20 observations. These measurements are combined to generate a final XAUUSD market classification of BULLISH, BEARISH, or SIDEWAYS / WAIT.
In addition to gold market analysis, the system retrieves cryptocurrency events within a predefined reporting period and identifies trending cryptocurrency assets. These datasets provide additional market intelligence that complements the primary XAUUSD technical analysis.
The objective of this implementation is to demonstrate how Python and financial APIs can be integrated into a unified market monitoring system. By combining historical gold prices, technical indicators, cryptocurrency events, and trending asset information, MarketFlow Trader Analysis provides a structured foundation for financial market observation and data-driven trading decisions.
2. Methodology
The MarketFlow Trader Analysis framework consists of five computational cells. Each cell performs a specific function within the overall analytical workflow.
Cell | Main function |
|---|---|
Cell 1 | Library imports, RapidAPI authentication, XAUUSD configuration, and cryptocurrency event parameters. |
Cell 2 | API data collection for XAUUSD prices, cryptocurrency events, and trending assets. |
Cell 3 | Historical XAUUSD data extraction, OHLC normalization, and timestamp processing. |
Cell 4 | Technical indicator calculations, market trend identification, and support and resistance analysis. |
Cell 5 | Cryptocurrency event processing, trending asset presentation, and final XAUUSD market intelligence report. |
2.1. API Configuration and Data Sources
The system uses the MarketFlow All-in-One Market Finance API through RapidAPI as its primary financial data provider.
Authentication is performed using a RapidAPI key entered interactively through Python's getpass module. This approach prevents the API key from being displayed directly in the notebook output.
Three API endpoints are configured:
/v2/chart/priceretrieves historical XAUUSD price information./crypto-eventsretrieves cryptocurrency-related events./trendingretrieves trending cryptocurrency assets.
The primary instrument is configured as OANDA:XAUUSD, using a daily timeframe and a historical range of 100 observations.
The cryptocurrency event endpoint is configured to retrieve records between November 5 and November 12, 2026, with the following parameters:
Parameter | Configuration |
|---|---|
skip | 0 |
source_reliable | true |
important | false |
start_date | 2026-11-05 |
end_date | 2026-11-12 |
The trending endpoint is requested without additional query parameters.
2.2. API Data Collection and Connection Management
The second cell introduces a reusable get_api() function to manage authenticated HTTP requests.
The function sends GET requests with a 30-second timeout and evaluates the HTTP response status.
Successful responses with HTTP status 200 are converted into JSON data. If the API returns HTTP status 429, the system waits 60 seconds before attempting one additional request.
Other HTTP errors are recorded as failed requests, while connection exceptions are handled through requests.exceptions.RequestException.
A three-second delay is applied between the three primary endpoint requests to separate API calls.
The resulting API status report identifies whether each endpoint successfully returned data.
2.3. Historical XAUUSD Data Processing
The third cell transforms the raw XAUUSD API response into a structured OHLC DataFrame.
The find_records() function recursively searches the JSON response for lists containing price records. It recognizes common field names associated with open and close prices.
The pick() function standardizes the extraction of individual price fields by checking alternative column names.
The normalized dataset contains:
Time.
Open.
High.
Low.
Close.
Volume.
Numeric fields are converted using pd.to_numeric(), while timestamps are processed using Pandas datetime functions.
The system also distinguishes between timestamps expressed in seconds and milliseconds based on their numerical magnitude.
Invalid OHLC records are removed, the observations are sorted chronologically, and duplicate timestamps are eliminated.
2.4. Technical Indicator Calculation
The fourth cell calculates five technical measurements from the historical XAUUSD closing prices.
Exponential Moving Average (EMA)
EMA 20 and EMA 50 are calculated using exponentially weighted moving averages.
\[ EMA_t = \alpha P_t+(1-\alpha)EMA_{t-1} \]
where:
\[ \alpha=\frac{2}{n+1} \]
The two EMA periods provide a reference for evaluating short-term and medium-term price direction.
Relative Strength Index (RSI)
RSI 14 is calculated using exponentially weighted average gains and losses with an alpha value of \(1/14\).
\[ RSI=100-\frac{100}{1+RS} \]
The resulting values are classified as:
OVERBOUGHT when RSI is at least 70.
OVERSOLD when RSI is at most 30.
NEUTRAL when RSI is between these thresholds.
Moving Average Convergence Divergence (MACD)
MACD is calculated using the difference between EMA 12 and EMA 26.
\[ MACD=EMA_{12}-EMA_{26} \]
The signal line is calculated using EMA 9 of the MACD series.
The relationship between the MACD line and signal line provides a directional momentum assessment.
Average True Range (ATR)
ATR 14 measures price volatility through the True Range calculation.
\[ TR=\max \begin{cases} High-Low\\ |High-PreviousClose|\\ |Low-PreviousClose| \end{cases} \]
The ATR is subsequently calculated using exponentially weighted averaging with an alpha of \(1/14\).
Support and Resistance
The system identifies recent support and resistance using the latest 20 observations.
\[ Support=\min(Low_{20}) \]
\[ Resistance=\max(High_{20}) \]
These levels represent recent historical price boundaries rather than independently confirmed reversal levels.
2.5. Market Trend and Trading Bias Classification
The framework evaluates the latest XAUUSD observation using EMA relationships and MACD momentum.
The market trend is classified as follows:
Condition | Classification |
|---|---|
EMA 20 above EMA 50 and closing price above EMA 20 | BULLISH |
EMA 20 below EMA 50 and closing price below EMA 20 | BEARISH |
Other conditions | SIDEWAYS |
MACD momentum is evaluated independently by comparing the MACD line with its signal line.
The final market bias uses three simultaneous conditions:
BULLISH when EMA 20 is above EMA 50, the closing price is above EMA 20, and MACD is above its signal line.
BEARISH when EMA 20 is below EMA 50, the closing price is below EMA 20, and MACD is below its signal line.
SIDEWAYS / WAIT when the conditions do not collectively support either direction.
This approach requires agreement between trend and momentum measurements before assigning a directional market bias.
2.6. Cryptocurrency Event and Trending Asset Analysis
The fifth cell processes the cryptocurrency event and trending asset responses.
The to_dataframe() function converts JSON lists and dictionaries into Pandas DataFrames.
Cryptocurrency events are displayed as a separate dataset, while trending cryptocurrency assets are presented in another table.
The system does not calculate cryptocurrency trading signals or combine these datasets with the XAUUSD scoring conditions. Instead, they serve as supplementary market intelligence.
The final trader brief presents the latest XAUUSD price, EMA values, RSI, MACD, ATR, support, resistance, and market bias, together with the number of cryptocurrency event and trending asset records retrieved.
3. Implementation and Python Code
The implementation below follows the uploaded marketflow_trader_analysis.py source and is organized into five cells for execution in Google Colab or Jupyter Notebook.
Cell 1 — Configuration and API Key Input
The first cell imports the required libraries and establishes the API authentication configuration.
The XAUUSD instrument is configured with a daily timeframe and 100 historical observations. Cryptocurrency event monitoring is also enabled using a predefined date range from November 5 to November 12, 2026.
The API key is entered interactively using getpass, allowing authentication credentials to remain hidden during notebook execution.
Code — Cell 1
# ==========================================
# CELL 1: CONFIGURATION & API KEY INPUT
# ==========================================

import requests
import json
import time
import warnings
import numpy as np
import pandas as pd

from IPython.display import display, Markdown
from getpass import getpass

# ==========================================
# INPUT RAPIDAPI KEY
# ==========================================

API_KEY = getpass("Masukkan RapidAPI Key Anda: ")

if not API_KEY.strip():
    raise ValueError("API Key tidak boleh kosong!")

# ==========================================
# API CONFIGURATION
# ==========================================

API_HOST = "marketflow-all-in-one-market-finance-api.p.rapidapi.com"

BASE_URL = f"https://{API_HOST}"

HEADERS = {
    "x-rapidapi-host": API_HOST,
    "x-rapidapi-key": API_KEY.strip()
}

# ==========================================
# XAUUSD CONFIGURATION
# ==========================================

PRICE_PARAMS = {
    "range": "100",
    "timeframe": "D",
    "timezone": "Asia/Jakarta",
    "symbol": "OANDA:XAUUSD"
}

# ==========================================
# CRYPTO EVENTS CONFIGURATION
# ==========================================

EVENT_PARAMS = {
    "skip": 0,
    "source_reliable": "true",
    "important": "false",
    "end_date": "2026-11-12",
    "start_date": "2026-11-05"
}

# ==========================================
# CONFIGURATION STATUS
# ==========================================

print("=" * 50)
print("MARKETFLOW TRADER ANALYSIS")
print("=" * 50)

print("API KEY       : Successfully entered")
print("API HOST      :", API_HOST)
print("XAUUSD        : OANDA:XAUUSD")
print("TIMEFRAME     : Daily")
print("CANDLE RANGE  : 100")
print("CRYPTO EVENTS : Enabled")
print("TRENDING      : Enabled")

print("=" * 50)
print("CONFIGURATION READY")
Cell 2 — API Data Collection
The second cell establishes communication with the three MarketFlow API endpoints.
The get_api() function handles authenticated GET requests, checks HTTP response codes, and manages rate-limit conditions.
When HTTP status 429 is detected, the system waits 60 seconds before retrying the request once.
The three datasets are retrieved independently:
XAUUSD historical price data.
Cryptocurrency events.
Trending cryptocurrency assets.
The system also maintains an API status dictionary to record whether each endpoint successfully returned data.
Code — Cell 2
# ==========================================
# CELL 2: API DATA COLLECTION
# ==========================================

API_STATUS = {}

def get_api(endpoint, params=None, retries=1):

    url = BASE_URL + endpoint

    for attempt in range(retries + 1):

        try:

            response = requests.get(
                url,
                headers=HEADERS,
                params=params,
                timeout=30
            )

            print(f"\nEndpoint: {endpoint}")
            print("HTTP Status:", response.status_code)

            if response.status_code == 200:

                print("SUCCESS")

                API_STATUS[endpoint] = True

                return response.json()

            elif response.status_code == 429:

                print("RATE LIMIT DETECTED")

                if attempt < retries:

                    print("Waiting 60 seconds...")
                    time.sleep(60)
                    continue

                API_STATUS[endpoint] = False
                return None

            else:

                print("API ERROR:")
                print(response.text)

                API_STATUS[endpoint] = False
                return None

        except requests.exceptions.RequestException as e:

            print("CONNECTION ERROR:", e)

            API_STATUS[endpoint] = False

            return None


# 1. XAUUSD PRICE
price_raw = get_api(
    "/v2/chart/price",
    PRICE_PARAMS
)

time.sleep(3)


# 2. CRYPTO EVENTS
events_raw = get_api(
    "/crypto-events",
    EVENT_PARAMS
)

time.sleep(3)


# 3. TRENDING CRYPTO
trending_raw = get_api(
    "/trending"
)


# CONNECTION SUMMARY
print("\n========== API STATUS ==========")

for endpoint, status in API_STATUS.items():

    print(
        endpoint,
        "CONNECTED" if status else "FAILED"
    )


# RAW DATA PREVIEW
for name, data in [
    ("XAUUSD", price_raw),
    ("CRYPTO EVENTS", events_raw),
    ("TRENDING", trending_raw)
]:

    print(f"\n========== {name} ==========")

    if data is not None:

        print(json.dumps(data, indent=2)[:2500])

    else:

        print("No data available.")
Cell 3 — XAUUSD Data Normalization
The third cell processes the historical XAUUSD price response.
The find_records() function searches through nested JSON structures to identify historical price records containing OHLC information.
The pick() function extracts price values using alternative field names to accommodate differences in API response structures.
The resulting records are converted into a Pandas DataFrame containing time, open, high, low, close, and volume.
Timestamp processing automatically distinguishes between seconds and milliseconds. The system then removes incomplete price records, sorts the dataset chronologically, and eliminates duplicate timestamps.
Code — Cell 3
# ==========================================
# CELL 3: XAUUSD DATA PROCESSING
# ==========================================

def find_records(obj):

    if isinstance(obj, list) and obj:

        if isinstance(obj[0], dict):

            keys = [k.lower() for k in obj[0].keys()]

            if any(k in keys for k in ["open", "o", "close", "c"]):
                return obj

    if isinstance(obj, dict):

        for key in [
            "data", "result", "candles",
            "prices", "chart", "values"
        ]:

            if key in obj:

                found = find_records(obj[key])

                if found is not None:
                    return found

        for value in obj.values():

            found = find_records(value)

            if found is not None:
                return found

    return None


def pick(row, choices):

    for key in choices:

        if key in row and row[key] is not None:
            return row[key]

    return np.nan


if price_raw is None:
    raise ValueError("XAUUSD API tidak tersedia.")

records = find_records(price_raw)

if records is None:
    raise ValueError("Struktur candle tidak dikenali.")


rows = []

for r in records:

    rows.append({

        "time": pick(r, ["time", "timestamp", "datetime", "date", "t"]),

        "open": pick(r, ["open", "o"]),

        "high": pick(r, ["high", "h"]),

        "low": pick(r, ["low", "l"]),

        "close": pick(r, ["close", "c", "price"]),

        "volume": pick(r, ["volume", "vol", "v"])

    })


df = pd.DataFrame(rows)

for col in ["open", "high", "low", "close", "volume"]:

    df[col] = pd.to_numeric(df[col], errors="coerce")


if pd.api.types.is_numeric_dtype(df["time"]):

    median_time = pd.to_numeric(
        df["time"], errors="coerce"
    ).dropna().median()

    unit = "ms" if median_time > 1e11 else "s"

    df["time"] = pd.to_datetime(
        df["time"], unit=unit,
        errors="coerce", utc=True
    )

else:

    df["time"] = pd.to_datetime(
        df["time"], errors="coerce", utc=True
    )


df = (
    df.dropna(subset=["open", "high", "low", "close"])
    .sort_values("time")
    .drop_duplicates("time")
    .reset_index(drop=True)
)

if df.empty:
    raise ValueError("Tidak ada data OHLC valid.")

print("TOTAL CANDLES:", len(df))

display(df.tail(15))
Cell 4 — XAUUSD Technical Analysis
The fourth cell calculates the technical indicators used to evaluate the gold market.
EMA 20 and EMA 50 are calculated using exponentially weighted averages. RSI 14 is calculated using exponentially weighted average gains and losses.
MACD is generated using EMA 12 and EMA 26, with EMA 9 serving as its signal line.
ATR 14 is calculated from the True Range values, providing a measure of recent market volatility.
After calculating the indicators, the system identifies the latest market trend, evaluates momentum, classifies the RSI condition, and calculates recent support and resistance levels.
The final analytical table summarizes the latest XAUUSD market conditions.
Code — Cell 4
# ==========================================
# CELL 4: TECHNICAL ANALYSIS
# ==========================================

# EMA
df["EMA20"] = df["close"].ewm(
    span=20,
    adjust=False
).mean()

df["EMA50"] = df["close"].ewm(
    span=50,
    adjust=False
).mean()


# RSI 14
delta = df["close"].diff()

gain = delta.clip(lower=0).ewm(
    alpha=1/14,
    adjust=False
).mean()

loss = (-delta.clip(upper=0)).ewm(
    alpha=1/14,
    adjust=False
).mean()

rs = gain / loss.replace(0, np.nan)

df["RSI14"] = 100 - (100 / (1 + rs))


# MACD
ema12 = df["close"].ewm(
    span=12,
    adjust=False
).mean()

ema26 = df["close"].ewm(
    span=26,
    adjust=False
).mean()

df["MACD"] = ema12 - ema26

df["MACD_signal"] = df["MACD"].ewm(
    span=9,
    adjust=False
).mean()


# ATR 14
prev_close = df["close"].shift(1)

tr = pd.concat([

    df["high"] - df["low"],

    (df["high"] - prev_close).abs(),

    (df["low"] - prev_close).abs()

], axis=1).max(axis=1)


df["ATR14"] = tr.ewm(
    alpha=1/14,
    adjust=False
).mean()


# LAST MARKET DATA
last = df.iloc[-1]


# TREND DETECTION
if (
    last["EMA20"] > last["EMA50"]
    and last["close"] > last["EMA20"]
):

    trend = "BULLISH"

elif (
    last["EMA20"] < last["EMA50"]
    and last["close"] < last["EMA20"]
):

    trend = "BEARISH"

else:

    trend = "SIDEWAYS"


# MOMENTUM
momentum = (
    "BULLISH"
    if last["MACD"] > last["MACD_signal"]
    else "BEARISH"
)


# RSI
if last["RSI14"] >= 70:

    rsi_state = "OVERBOUGHT"

elif last["RSI14"] <= 30:

    rsi_state = "OVERSOLD"

else:

    rsi_state = "NEUTRAL"


# SUPPORT & RESISTANCE
recent = df.tail(20)

support = recent["low"].min()

resistance = recent["high"].max()

atr_pct = (
    last["ATR14"] / last["close"] * 100
)


# RESULT
analysis = pd.DataFrame({

    "METRIC": [

        "Last Price",
        "EMA 20",
        "EMA 50",
        "Market Trend",
        "RSI 14",
        "RSI Condition",
        "MACD",
        "MACD Momentum",
        "ATR 14",
        "ATR Percentage",
        "Support",
        "Resistance"

    ],

    "RESULT": [

        last["close"],
        last["EMA20"],
        last["EMA50"],
        trend,
        last["RSI14"],
        rsi_state,
        last["MACD"],
        momentum,
        last["ATR14"],
        atr_pct,
        support,
        resistance

    ]

})


print("=" * 55)
print("XAUUSD TECHNICAL ANALYSIS")
print("=" * 55)

display(analysis)

print("\nRECENT INDICATOR DATA")

display(

    df[
        [
            "time",
            "close",
            "EMA20",
            "EMA50",
            "RSI14",
            "MACD",
            "MACD_signal",
            "ATR14"
        ]
    ].tail(10)

)
Cell 5 — Crypto Events, Trending Assets, and Trader Brief
The fifth cell integrates cryptocurrency event information and trending asset data into the final market intelligence report.
The to_dataframe() function converts the API responses into structured Pandas DataFrames.
The cryptocurrency event dataset and trending asset dataset are displayed separately to preserve their respective information structures.
The system then generates a trader brief containing the latest XAUUSD price, moving averages, RSI, MACD, ATR, and market bias.
The final market bias requires agreement between the EMA trend, closing price position, and MACD momentum.
Finally, the system displays recent support and resistance levels and produces an overall MarketFlow Trader Report.
Code — Cell 5
# ==========================================
# CELL 5: CRYPTO MARKET INTELLIGENCE
# ==========================================

# ------------------------------------------
# 1. CRYPTO EVENTS
# ------------------------------------------

def to_dataframe(data):

    if data is None:
        return pd.DataFrame()

    if isinstance(data, list):
        return pd.json_normalize(data)

    if isinstance(data, dict):

        for key in ["data", "result", "events", "coins", "items"]:

            if key in data:

                value = data[key]

                if isinstance(value, list):
                    return pd.json_normalize(value)

                if isinstance(value, dict):
                    return pd.json_normalize(value)

        return pd.json_normalize(data)

    return pd.DataFrame()


events_df = to_dataframe(events_raw)

print("=" * 60)
print("CRYPTO EVENTS")
print("=" * 60)

if not events_df.empty:

    display(events_df)

else:

    print("No crypto events available.")


# ------------------------------------------
# 2. TRENDING CRYPTO
# ------------------------------------------

trending_df = to_dataframe(trending_raw)

print("\n" + "=" * 60)
print("TRENDING CRYPTO ASSETS")
print("=" * 60)

if not trending_df.empty:

    display(trending_df)

else:

    print("No trending data available.")


# ------------------------------------------
# 3. XAUUSD TRADER BRIEF
# ------------------------------------------

print("\n" + "=" * 60)
print("XAUUSD MARKET ANALYSIS")
print("=" * 60)

last = df.iloc[-1]

print("Last Price :", round(last["close"], 3))
print("EMA 20     :", round(last["EMA20"], 3))
print("EMA 50     :", round(last["EMA50"], 3))
print("RSI 14     :", round(last["RSI14"], 2))
print("MACD       :", round(last["MACD"], 3))
print("ATR 14     :", round(last["ATR14"], 3))


# ------------------------------------------
# 4. MARKET BIAS
# ------------------------------------------

if (
    last["EMA20"] > last["EMA50"]
    and last["close"] > last["EMA20"]
    and last["MACD"] > last["MACD_signal"]
):

    market_bias = "BULLISH"

elif (
    last["EMA20"] < last["EMA50"]
    and last["close"] < last["EMA20"]
    and last["MACD"] < last["MACD_signal"]
):

    market_bias = "BEARISH"

else:

    market_bias = "SIDEWAYS / WAIT"


print("\nMARKET BIAS:", market_bias)


# ------------------------------------------
# 5. SUPPORT & RESISTANCE
# ------------------------------------------

support = df.tail(20)["low"].min()

resistance = df.tail(20)["high"].max()

print("\nSUPPORT    :", round(support, 3))
print("RESISTANCE :", round(resistance, 3))


# ------------------------------------------
# 6. FINAL REPORT
# ------------------------------------------

print("\n" + "=" * 60)
print("MARKETFLOW TRADER REPORT")
print("=" * 60)

print("XAUUSD Bias       :", market_bias)

print("Crypto Events     :", len(events_df), "records")

print("Trending Assets   :", len(trending_df), "records")

print("Analysis Status   : COMPLETED")

print("\nRisk management tetap diperlukan sebelum entry.")
Result:
4. Results and Discussion
4.1. API Connectivity and Data Retrieval
The API data collection module establishes communication with three MarketFlow endpoints.
The /v2/chart/price endpoint retrieves historical XAUUSD price information, while /crypto-events and /trending provide supplementary cryptocurrency market information.
The API status dictionary records the connection results for each endpoint. Successful requests are converted into JSON responses, while unsuccessful requests are identified through their HTTP status codes or connection errors.
The raw response preview also allows analysts to examine the returned data structures before proceeding with data normalization.
The successful retrieval of these datasets provides the foundation for the subsequent analytical processes.
4.2. XAUUSD Historical Price Analysis
The historical price processing module transforms the retrieved API response into a structured OHLC dataset.
The system identifies available price records and extracts open, high, low, close, and volume information.
After normalization, invalid records are removed and the remaining observations are arranged chronologically.
The implementation is configured to request 100 daily historical observations. This provides the historical dataset used for calculating the technical indicators.
The resulting DataFrame also preserves the timestamp associated with each price observation, allowing the analyst to examine the chronological development of gold prices.
4.3. Moving Average Trend Identification
EMA 20 and EMA 50 provide the primary reference for identifying the XAUUSD trend.
The system evaluates both moving averages alongside the latest closing price.
A bullish trend is identified when EMA 20 is above EMA 50 and the closing price is above EMA 20.
A bearish trend is identified when EMA 20 is below EMA 50 and the closing price is below EMA 20.
When neither condition is satisfied, the market is classified as SIDEWAYS.
This classification helps distinguish between directional market conditions and situations where the relationship between price and moving averages does not provide sufficient directional confirmation.
4.4. RSI Momentum and MACD Analysis
RSI 14 provides an additional measurement of gold price momentum.
The system classifies RSI values of 70 or higher as OVERBOUGHT and values of 30 or lower as OVERSOLD.
Readings between these thresholds are classified as NEUTRAL.
MACD is used to evaluate the relationship between short-term and longer-term price momentum.
When the MACD line is above its signal line, momentum is classified as BULLISH. When the MACD line is below its signal line, momentum is classified as BEARISH.
Combining RSI and MACD provides two complementary perspectives on market conditions.
RSI evaluates the strength of recent price movements, while MACD examines the relationship between different exponential moving averages.
4.5. Market Volatility Assessment Using ATR
ATR 14 measures recent XAUUSD price volatility using the True Range calculation.
The indicator considers the current high-low range and the price gaps relative to the previous closing price.
The system also calculates ATR as a percentage of the latest closing price:
\[ ATR\ Percentage= \frac{ATR14}{Closing\ Price}\times100 \]
This provides a relative volatility measurement that can help contextualize the magnitude of recent gold price fluctuations.
ATR does not indicate market direction. Instead, it provides information about the magnitude of price movements.
4.6. Support and Resistance Identification
The support and resistance module evaluates the latest 20 historical observations.
Support is identified using the lowest low within the selected period, while resistance is determined using the highest high.
These values provide reference levels for examining recent gold price boundaries.
The calculation is based on rolling historical extremes rather than advanced swing-point detection or validated reversal patterns.
Consequently, the identified levels should be interpreted as preliminary technical reference points.
4.7. Cryptocurrency Events and Trending Assets
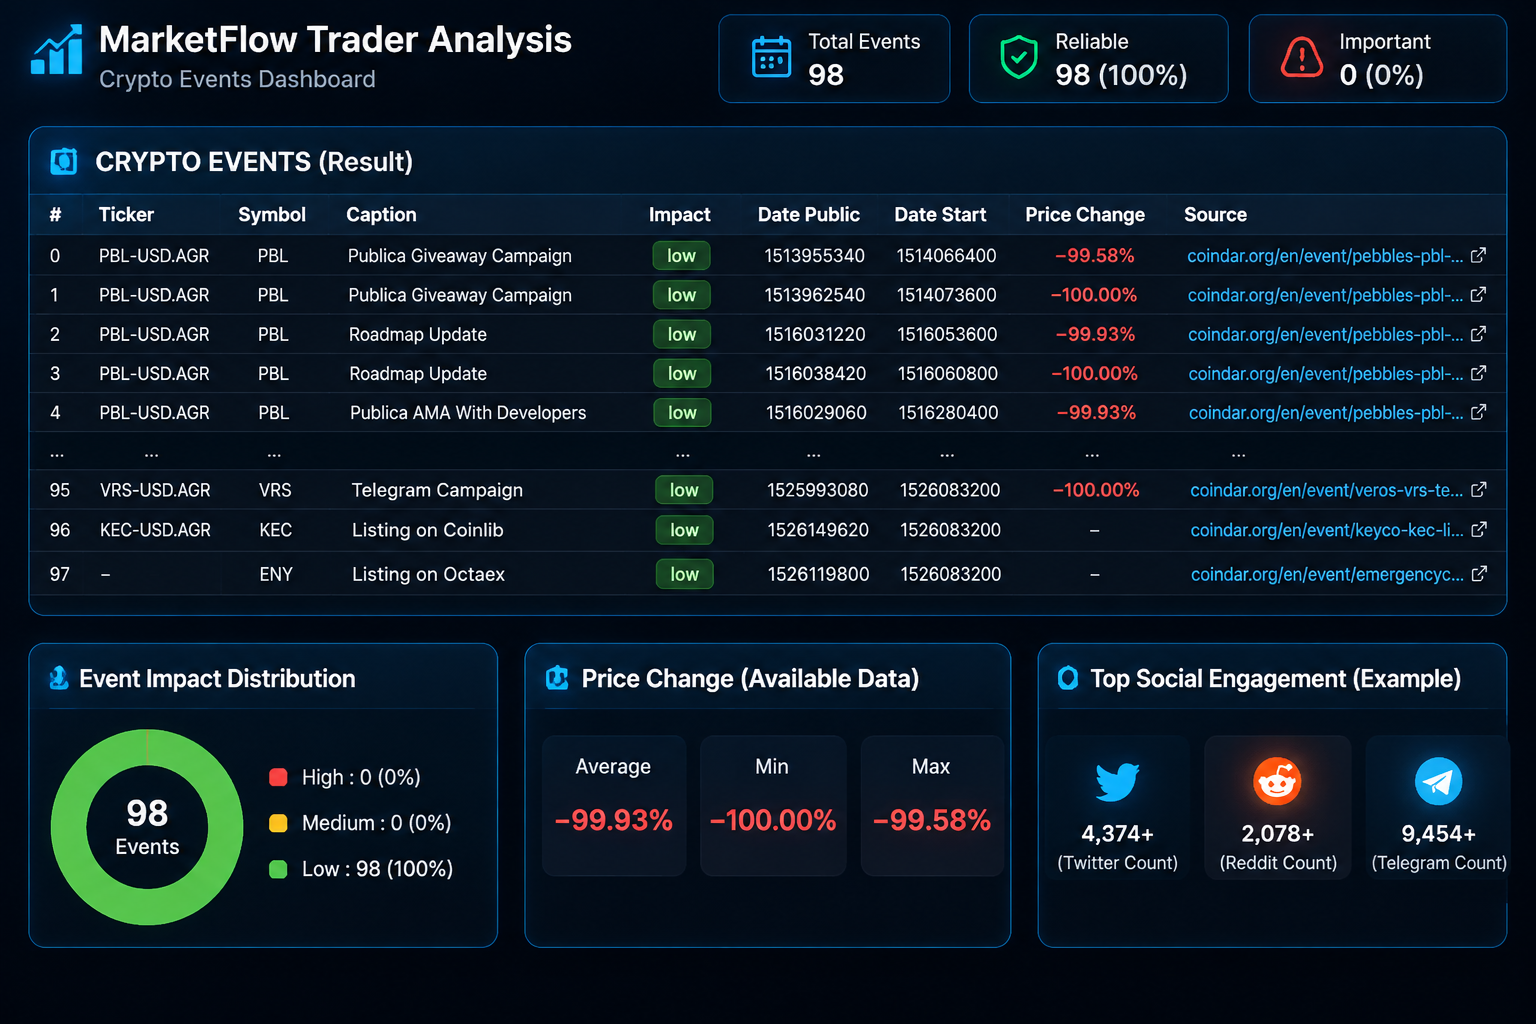
In addition to gold market analysis, MarketFlow Trader Analysis retrieves cryptocurrency events and trending digital assets.
The cryptocurrency event dataset provides information returned by the /crypto-events endpoint within the configured November 5–12, 2026 reporting period.
The trending dataset provides a separate view of cryptocurrency assets identified by the MarketFlow trending endpoint.
Both datasets are converted into Pandas DataFrames and displayed independently.
This separation allows analysts to examine cryptocurrency market developments without mixing them with the XAUUSD technical indicator calculations.
The cryptocurrency information therefore serves as supplementary market intelligence rather than a direct component of the gold trading signal.
4.8. Integrated Market Bias and Trader Report
The final analytical stage combines the EMA trend and MACD momentum conditions to determine the overall XAUUSD market bias.
The framework applies three classifications:
Market bias | Required conditions |
|---|---|
BULLISH | EMA 20 above EMA 50, closing price above EMA 20, and MACD above signal line. |
BEARISH | EMA 20 below EMA 50, closing price below EMA 20, and MACD below signal line. |
SIDEWAYS / WAIT | Neither complete directional condition is satisfied. |
The final trader brief presents the latest price, EMA values, RSI, MACD, ATR, support, resistance, and market classification.
It also reports the number of retrieved cryptocurrency event records and trending asset records.
This structure provides a concise summary of the primary gold market analysis alongside supplementary cryptocurrency information.
4.9. Limitations and Future Improvements
Several limitations should be considered when interpreting the analytical results.
First, the historical analysis is limited to 100 daily observations. A relatively short observation period may not capture longer-term gold market conditions or different volatility regimes.
Second, cryptocurrency event dates are predefined. The current implementation uses November 5–12, 2026, rather than automatically generating a rolling date range. The reporting period must therefore be updated manually when required.
Third, cryptocurrency information is not integrated into the XAUUSD market scoring mechanism. The event and trending datasets are presented as supplementary information rather than variables used to determine gold market direction.
Fourth, support and resistance calculations use simple historical extremes. The system does not independently validate price rejection, breakout confirmation, or multiple-touch support and resistance levels.
Fifth, the current framework does not include historical strategy backtesting. Consequently, the generated market classifications have not been evaluated against historical trading returns, transaction costs, or drawdown measurements.
Sixth, the implementation does not generate technical visualization charts or export CSV files. Its current outputs consist of structured DataFrames, indicator summaries, API response previews, and the final trader report.
Future improvements could include dynamic cryptocurrency event scheduling, historical market backtesting, candlestick visualization, automated support and resistance detection, and volatility-based risk management.
Additional development could also integrate economic calendars, cryptocurrency market capitalization, trading volume, and other financial indicators.
These improvements would provide a more comprehensive framework for monitoring gold and cryptocurrency market developments.
5. Conclusion
MarketFlow Trader Analysis demonstrates how Python can integrate gold market technical analysis with cryptocurrency event monitoring and trending asset discovery.
The system retrieves historical XAUUSD prices through the MarketFlow API and transforms the resulting data into a structured OHLC dataset.
The technical analysis component calculates EMA 20, EMA 50, RSI 14, MACD, and ATR 14 to evaluate market direction, momentum, and volatility. It also identifies recent support and resistance levels using the latest 20 observations.
The final market classification combines EMA positioning, closing price relationships, and MACD momentum to generate BULLISH, BEARISH, or SIDEWAYS / WAIT conditions.
In addition, the framework retrieves cryptocurrency event information and trending digital assets to provide supplementary market intelligence within the same Python environment.
Overall, the implementation demonstrates the practical application of API integration, financial data normalization, technical indicator calculations, and automated market reporting.
Nevertheless, the system should be regarded as a financial analysis and monitoring tool rather than an automated prediction or trading execution system. Its results depend on API availability, data quality, historical coverage, and the predefined technical classification rules.
Future development should focus on dynamic event monitoring, historical backtesting, advanced technical visualization, and improved risk management.
With these improvements, MarketFlow Trader Analysis can serve as a foundation for a more comprehensive financial market intelligence platform integrating precious metals and cryptocurrency market information.