
Introduction
market types search news data analysis Python API is a practical way to understand how financial news can be collected, structured, and analyzed using Python. In financial markets, news plays an important role because it can influence investor sentiment, market movement, and decision-making.
In this tutorial, we will use Python in Google Colab to fetch two types of data from an API: Market Types and Search News. The Market Types API helps identify available market categories, while the Search News API retrieves news related to specific topics such as economic growth.
This article is beginner-friendly. Every cell is explained clearly, so you can understand what the code does, why it is used, and how the data flows from API response into tables and visual charts.
Cell 1 — Import Library
import requests
import pandas as pd
import matplotlib.pyplot as plt
This cell imports the libraries needed for the notebook.
requests is used to request data from the API. pandas is used to convert and manage data in table format. matplotlib.pyplot is used to create visualizations such as bar charts and line charts.
For beginners, this cell prepares the main tools: one tool to fetch data, one tool to organize data, and one tool to visualize data.
Cell 2 — API Key Configuration
RAPIDAPI_KEY = "YOUR_RAPIDAPI_KEY_HERE"

headers = {
    "Content-Type": "application/json",
    "x-rapidapi-host": "news-flow-api.p.rapidapi.com",
    "x-rapidapi-key": RAPIDAPI_KEY
}
This cell sets up the API authentication.
The RAPIDAPI_KEY is the private key used to access the API. The headers variable contains information required by RapidAPI, including the content type, API host, and API key.
Do not publish your real API key in public articles. Use a placeholder like YOUR_RAPIDAPI_KEY_HERE.
Cell 3 — API URL
market_types_url = "https://news-flow-api.p.rapidapi.com/api/market-types"

search_news_url = "https://news-flow-api.p.rapidapi.com/api/news/search?sortOrder=asc&marketType=stock%2Cetf&search=economic%20growth&maxResults=500&sortBy=createdAt"
This cell defines two API URLs.
The first URL, market_types_url, is used to fetch available market types from the API.
The second URL, search_news_url, is used to search news data. In this code, the search query focuses on economic growth, with market types set to stock and ETF. The result is sorted by createdAt, and the maximum number of results is set to 500.
Cell 4 — Function to Get API Data
def get_api_data(url):
    response = requests.get(url, headers=headers)

    if response.status_code == 200:
        return response.json()
    else:
        print("Gagal mengambil data:", response.status_code)
        print(response.text)
        return None
This cell creates a reusable function called get_api_data().
The function receives a URL, sends a request to the API, and checks the response status. If the status code is 200, the function returns the response as JSON data. If the request fails, it prints the error status and returns None.
For beginners, this function helps avoid writing the same API request code repeatedly.
Cell 5 — Fetch Data from API
market_types_data = get_api_data(market_types_url)
search_news_data = get_api_data(search_news_url)
This cell uses the function from the previous cell to fetch data from both URLs.
market_types_data stores the response from the Market Types API. search_news_data stores the response from the Search News API.
At this stage, the data is still raw JSON data from the API.
Cell 6 — Check Data Structure
print(type(market_types_data))
print(type(search_news_data))

print(market_types_data)
print(search_news_data)
This cell checks the structure of the API responses.
The type() function tells us what kind of data was returned, for example a list or dictionary. Then the code prints the full content of both API responses.
This step is important because every API can return data in a different structure. Before converting the response into a table, we need to understand its format.
Cell 7 — Convert Market Types Data into Table
df_market_types = pd.DataFrame(market_types_data)

df_market_types.head()
This cell converts the Market Types API response into a pandas DataFrame.
A DataFrame is like a spreadsheet table in Python. The head() function displays the first few rows so we can preview the data.
For beginners, this step changes raw API data into a table that is easier to read and analyze.
Cell 8 — Convert Search News Data into Table
# Cek key utama dari response searchNews
print(search_news_data.keys())
This cell checks the main keys inside the search_news_data response.
Because search_news_data is a dictionary, .keys() shows the available top-level keys. This helps us find where the actual news list is stored.
# Ambil data berita dari response API secara otomatis
news_list = None

for key, value in search_news_data.items():
    if isinstance(value, list):
        news_list = value
        print("Data berita ditemukan di key:", key)
        break

if news_list is None:
    for key, value in search_news_data.items():
        if isinstance(value, dict):
            for sub_key, sub_value in value.items():
                if isinstance(sub_value, list):
                    news_list = sub_value
                    print("Data berita ditemukan di key:", key, "->", sub_key)
                    break

df_news = pd.DataFrame(news_list)

df_news.head()
This cell automatically searches for the list of news inside the API response.
First, the code checks whether any top-level value is a list. If it finds a list, it assumes that list contains the news data. If not, it checks inside nested dictionaries to find a list.
After the news list is found, it is converted into a pandas DataFrame called df_news.
This is useful because API responses are sometimes nested, and this code helps locate the actual news data more flexibly.
Cell 9 — Add Source Label
df_market_types["sumber_api"] = "getMarketTypes"
df_news["sumber_api"] = "searchNews"
This cell adds a new column called sumber_api to both DataFrames.
For df_market_types, the value is labeled as getMarketTypes. For df_news, the value is labeled as searchNews.
This makes it easier to identify where each dataset came from, especially if the data is later combined or compared.
Cell 10 — Check News Columns
df_news.columnsThis cell displays all column names in the news DataFrame.
This is important because we need to know what columns are available before creating visualizations. For example, later cells use columns such as marketType, createdAt, and providerId.
Cell 11 — Visualize Number of News Based on Market Type
if "marketType" in df_news.columns:
    jumlah_market_type = df_news["marketType"].value_counts()

    plt.figure(figsize=(8, 5))
    jumlah_market_type.plot(kind="bar")
    plt.title("Jumlah Berita Berdasarkan Market Type")
    plt.xlabel("Market Type")
    plt.ylabel("Jumlah Berita")
    plt.xticks(rotation=45)
    plt.show()
else:
    print("Kolom marketType tidak ditemukan.")
    print(df_news.columns.tolist())
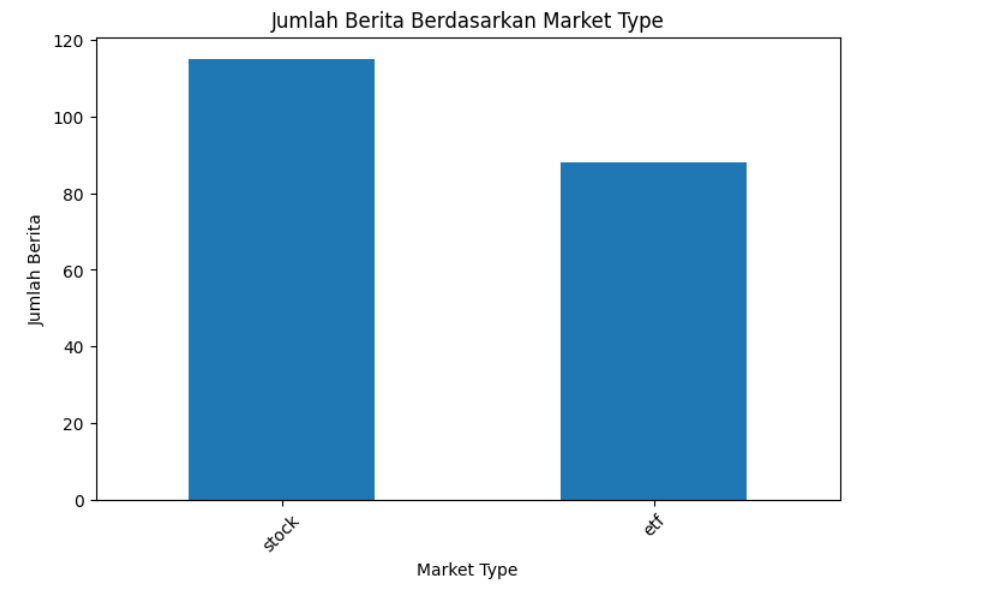
This cell creates a bar chart showing the number of news articles based on market type.
First, the code checks whether the marketType column exists. If it exists, it counts how many news articles belong to each market type using value_counts().
Then it creates a bar chart using matplotlib.
If the marketType column does not exist, the code prints a warning and displays the available column names.
For beginners, this visualization helps answer: which market type appears most often in the news data?
Result:
Cell 12 — Visualize Number of News by Date
kolom_tanggal = None

for kolom in df_news.columns:
    if "date" in kolom.lower() or "created" in kolom.lower() or "published" in kolom.lower():
        kolom_tanggal = kolom
        break

if kolom_tanggal:
    df_news[kolom_tanggal] = pd.to_datetime(df_news[kolom_tanggal], errors="coerce")
    df_news["tanggal"] = df_news[kolom_tanggal].dt.date

    berita_harian = df_news.groupby("tanggal").size()

    plt.figure(figsize=(12, 6))
    berita_harian.plot(kind="line", marker="o")
    plt.title("Tren Jumlah Berita per Tanggal")
    plt.xlabel("Tanggal")
    plt.ylabel("Jumlah Berita")
    plt.xticks(rotation=45)
    plt.show()
else:
    print("Kolom tanggal tidak ditemukan.")
    print(df_news.columns.tolist())
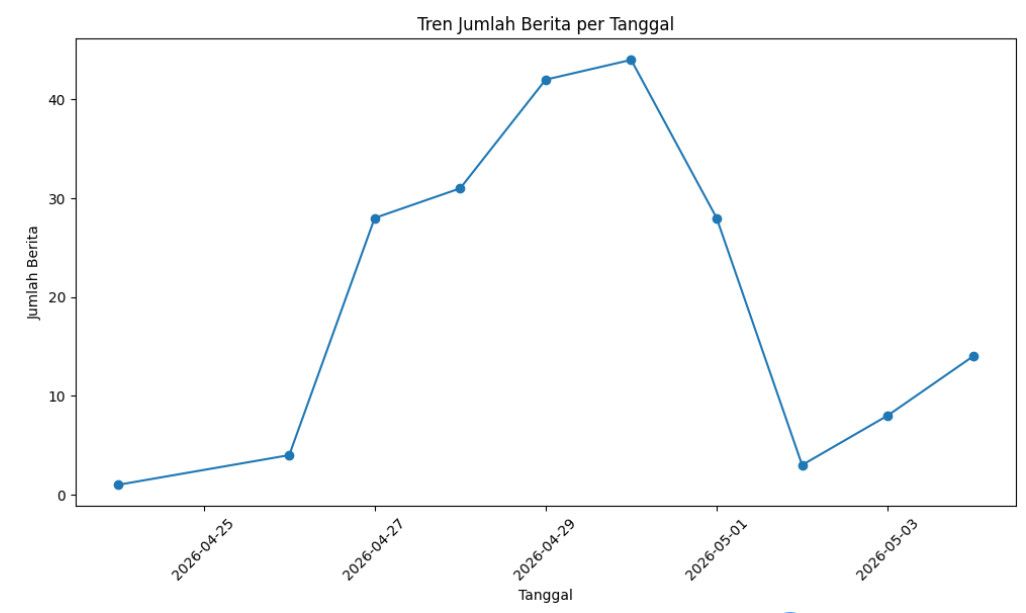
This cell creates a line chart showing the trend of news articles by date.
The code first searches for a date-related column by checking whether the column name contains words like date, created, or published.
If a date column is found, it converts that column into datetime format. Then it creates a new column called tanggal, groups the news by date, and counts how many articles appear each day.
Finally, it displays the result as a line chart.
For beginners, this helps answer: on which dates did the news volume increase or decrease?
Result :
Cell 13 — Visualize Top News Sources
top_source = df_news["providerId"].value_counts().head(10)

plt.figure(figsize=(10, 6))
top_source.plot(kind="bar")
plt.title("Top 10 Sumber Berita (Provider)")
plt.xlabel("Provider ID")
plt.ylabel("Jumlah Berita")
plt.xticks(rotation=45)
plt.show()
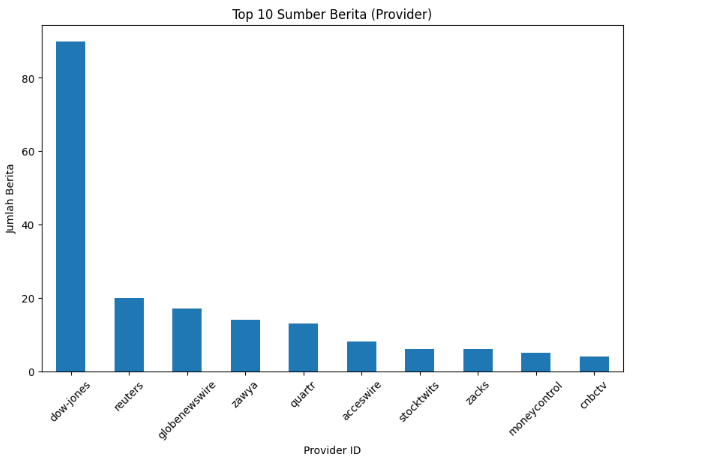
This cell visualizes the top 10 news providers.
The code counts how many news articles come from each providerId, selects the top 10, and displays them in a bar chart.
For beginners, this helps identify which providers contribute the most news in the dataset.
Result :
Conclusion
market types search news data analysis Python API helps transform raw news API responses into useful market insights. By using Python, we can fetch market type data, search financial news, convert responses into tables, and visualize the results.
This notebook demonstrates a complete beginner-friendly workflow: collecting data from an API, checking its structure, converting it into DataFrames, adding source labels, and creating visualizations. The analysis helps us understand news distribution by market type, daily news trends, and top news providers.
The key takeaway is simple: financial news becomes more meaningful when it is organized, counted, and visualized clearly. This workflow can be expanded into a financial news dashboard, sentiment analysis tool, or market monitoring system.