
Building an IDX Stock Split Economic Calendar Dashboard is a practical way to monitor Stock Split Calendar data and Economic Calendar data from the Indonesia Stock Exchange API.
The IDX Stock Split Economic Calendar Dashboard combines Stock Split Calendar information and Economic Calendar information into a single dashboard. By using Python and the IDX API, users can retrieve, process, and display market-related information through a structured workflow.
In this project, the IDX Stock Split Economic Calendar Dashboard retrieves Stock Split Calendar data and Economic Calendar data, converts the API responses into dataframes, and displays the results through a simple dashboard interface.
CELL 1 — INSTALL & IMPORT LIBRARY
# ==========================================
# CELL 1 : INSTALL & IMPORT LIBRARY
# ==========================================

import requests
import pandas as pd
import time
from IPython.display import display, Markdown
Explanation
The project begins by importing the libraries required throughout the notebook.
The requests library is used to communicate with the IDX API, while pandas is used to process API responses into structured dataframes. The time library is used to create delays between API requests, and display together with Markdown is used to create a cleaner dashboard presentation inside Google Colab.
With these libraries imported, the notebook is ready to retrieve and process data from the API.
CELL 2 — KONFIGURASI API
# ==========================================
# CELL 2 : KONFIGURASI API
# ==========================================

BASE_URL = "https://indonesia-stock-exchange-idx.p.rapidapi.com"

HEADERS = {
    "Content-Type": "application/json",
    "x-rapidapi-host": "indonesia-stock-exchange-idx.p.rapidapi.com",
    "x-rapidapi-key": "your api key"
}
Explanation
After importing the required libraries, the notebook defines the API configuration.
The BASE_URL variable stores the IDX API endpoint, while HEADERS contains the request configuration required to access the API through RapidAPI.
These settings are reused whenever the notebook sends requests to retrieve Stock Split Calendar and Economic Calendar data.
CELL 3 — FUNCTION FETCH API & DATA PROCESSING
# ==========================================
# CELL 3 : FUNCTION FETCH API & DATA PROCESSING
# ==========================================

def fetch_api(endpoint, retries=3, delay=5):
    """
    Mengambil data dari API IDX dengan retry
    apabila terjadi rate limit atau error sementara.
    """

    url = BASE_URL + endpoint

    for attempt in range(retries):

        try:

            response = requests.get(
                url,
                headers=HEADERS
            )

            if response.status_code == 200:
                return response.json()

            elif response.status_code == 429:

                print(
                    f"Rate limit terkena "
                    f"(percobaan {attempt+1}/{retries})"
                )

                time.sleep(delay)

            else:

                print(
                    f"Error {response.status_code}"
                )

                print(response.text)

                return None

        except Exception as e:

            print(
                f"Terjadi error: {e}"
            )

            time.sleep(delay)

    return None


def extract_list(data):
    """
    Mengambil list utama dari response API.
    """

    if isinstance(data, list):
        return data

    if isinstance(data, dict):

        for value in data.values():

            if isinstance(value, list):
                return value

    return []
Explanation
This cell creates helper functions used throughout the notebook.
The fetch_api() function is responsible for retrieving data from the IDX API. To improve reliability, the function includes a retry mechanism that attempts multiple requests whenever temporary errors occur. If the API returns a rate-limit response (429), the notebook waits before attempting another request.
The extract_list() function is designed to retrieve the primary list from an API response. This simplifies the process of handling response structures and prepares the data for further processing.
CELL 4 — PENGAMBILAN DATA API
# ==========================================
# CELL 4 : PENGAMBILAN DATA API
# ==========================================

display(Markdown("## 📥 Mengambil Data dari API IDX"))

stock_split_raw = fetch_api("/api/calendar/stock-split")

time.sleep(5)

economic_calendar_raw = fetch_api("/api/calendar/economic")

display(Markdown("✅ Proses pengambilan data selesai"))

print("STOCK SPLIT RAW:")
print(stock_split_raw)

print("\nECONOMIC CALENDAR RAW:")
print(economic_calendar_raw)
Explanation
This cell retrieves data from two different IDX API endpoints.
The notebook first requests Stock Split Calendar data and stores the response in stock_split_raw.
After a five-second delay, the notebook retrieves Economic Calendar data and stores the response in economic_calendar_raw.
Once both requests have been completed, the notebook displays a confirmation message and prints the raw API responses so users can inspect the returned data structure.
CELL 5 — IDX STOCK SPLIT & ECONOMIC CALENDAR DASHBOARD
# ==========================================
# CELL 5 : IDX STOCK SPLIT & ECONOMIC
# CALENDAR DASHBOARD
# ==========================================

display(Markdown("# 📊 IDX Stock Split & Economic Calendar Dashboard"))

display(
    Markdown(
        "Dashboard sederhana untuk membaca data "
        "**Stock Split Calendar** dan **Economic Calendar** "
        "dari Bursa Efek Indonesia."
    )
)


def make_dataframe(raw_data):
    if raw_data is None:
        return pd.DataFrame()

    if isinstance(raw_data, list):
        return pd.json_normalize(raw_data, sep="_")

    if isinstance(raw_data, dict):

        for key in ["data", "result", "results", "items", "calendar"]:
            if key in raw_data and isinstance(raw_data[key], list):
                return pd.json_normalize(raw_data[key], sep="_")

        for value in raw_data.values():
            if isinstance(value, list):
                return pd.json_normalize(value, sep="_")

        return pd.json_normalize(raw_data, sep="_")

    return pd.DataFrame()


# ==================================================
# STOCK SPLIT CALENDAR
# ==================================================

display(Markdown("## 🔀 Stock Split Calendar"))

try:
    df_stock_split = make_dataframe(stock_split_raw)

    if not df_stock_split.empty:
        display(
            Markdown(
                f"Jumlah data Stock Split yang berhasil ditampilkan: "
                f"**{len(df_stock_split)} data**"
            )
        )
        display(df_stock_split)

    else:
        display(Markdown("Tidak ada data Stock Split."))

except Exception as e:
    display(Markdown(f"❌ Gagal mengolah data Stock Split: {e}"))


# ==================================================
# ECONOMIC CALENDAR
# ==================================================

display(Markdown("## 🗓️ Economic Calendar"))

try:
    df_economic_calendar = make_dataframe(economic_calendar_raw)

    if not df_economic_calendar.empty:
        display(
            Markdown(
                f"Jumlah agenda ekonomi yang berhasil ditampilkan: "
                f"**{len(df_economic_calendar)} agenda**"
            )
        )
        display(df_economic_calendar)

    else:
        display(Markdown("Tidak ada data Economic Calendar."))

except Exception as e:
    display(Markdown(f"❌ Gagal mengolah data Economic Calendar: {e}"))


display(Markdown("---"))
display(Markdown("✅ Dashboard berhasil dibuat."))
Explanation
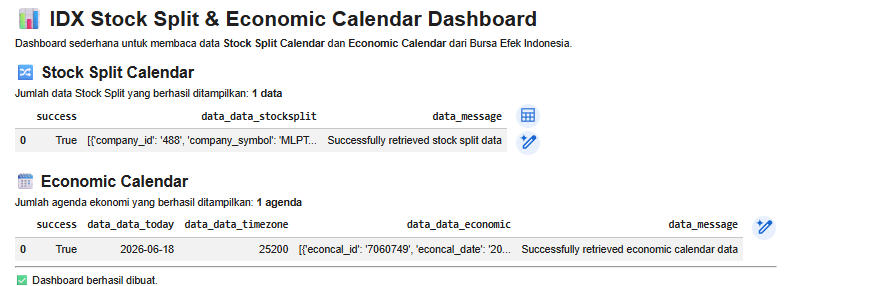
The final cell builds the IDX Stock Split & Economic Calendar Dashboard.
The dashboard starts by displaying a title and a short description explaining that the dashboard is designed to read Stock Split Calendar and Economic Calendar data from the Indonesia Stock Exchange.
A helper function called make_dataframe() is then created to convert API responses into pandas dataframes. The function supports different response formats, including lists and dictionaries, allowing the notebook to process API data more consistently.
The first dashboard section focuses on Stock Split Calendar data. The notebook converts the API response into a dataframe, displays the total number of Stock Split records, and presents the resulting dataframe.
The second dashboard section focuses on Economic Calendar data. Similar to the Stock Split section, the notebook converts the API response into a dataframe, displays the total number of economic agendas retrieved, and presents the resulting dataframe.
After both sections are displayed, the notebook shows a completion message indicating that the dashboard has been successfully created.
Result:
Overall Workflow
The notebook follows a simple workflow:
Import the required libraries.
Configure API access.
Create helper functions for API retrieval and data extraction.
Retrieve Stock Split Calendar data.
Retrieve Economic Calendar data.
Convert API responses into dataframes.
Display the information through a dashboard interface.
Why This Project Matters
Stock Split Calendar and Economic Calendar data are valuable sources of information for market participants.
Stock Split data helps users monitor corporate actions related to share structure, while Economic Calendar data provides visibility into economic events that may influence market sentiment.
By combining both datasets into a single dashboard, users can monitor important market information more efficiently.
Conclusion
The IDX Stock Split Economic Calendar Dashboard demonstrates how Python can be used to retrieve Stock Split Calendar data and Economic Calendar data from the Indonesia Stock Exchange API.
By combining both datasets into a single workflow, the IDX Stock Split Economic Calendar Dashboard provides a simple way to process API responses, convert them into dataframes, and display the information through a dashboard interface.