
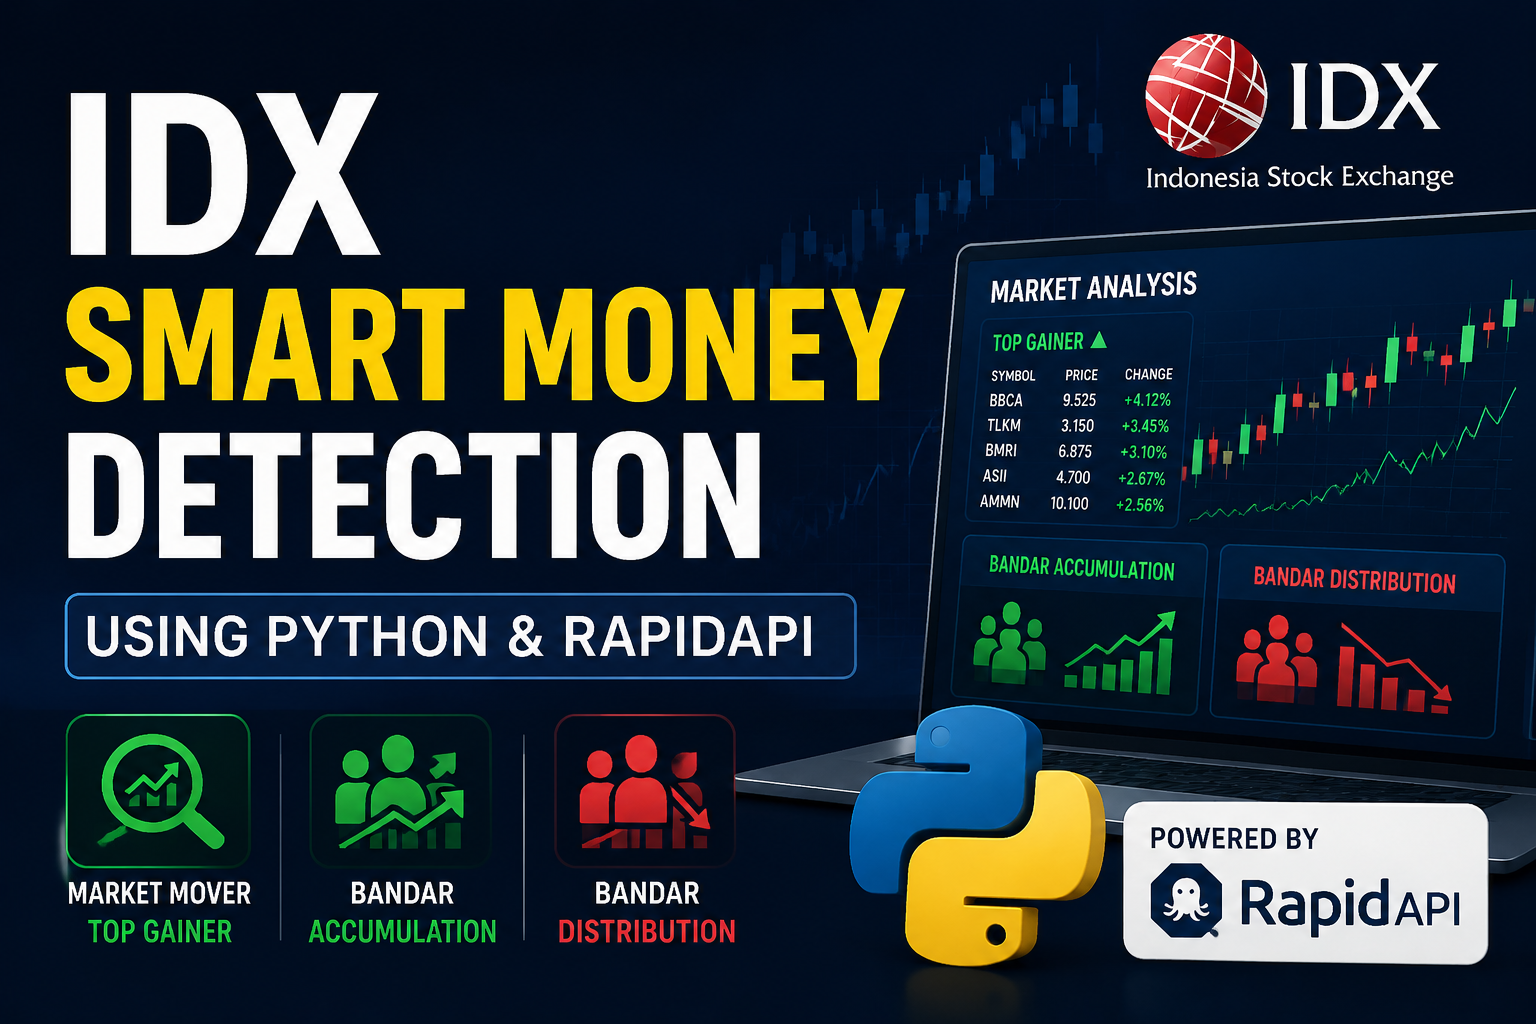
This project develops an automated IDX Smart Money Detection System using Python and RapidAPI. The system is designed to analyze Indonesian stock market activity by combining three important market indicators:
Market Mover Analysis
Bandar Accumulation Detection
Bandar Distribution Detection
The objective of this project is to build a simple framework for identifying potential institutional activity, monitoring top-performing stocks, and detecting possible accumulation or distribution behavior from market participants.
The project uses Python libraries such as requests for API communication, pandas for data processing, json for handling API responses, and tabulate for generating structured reports.
The complete workflow is organized into five cells, starting from API configuration, retrieving market mover data, analyzing bandar activity, creating stock analysis functions, and generating an automated market report.
The five main components are:
Cell 1: Library installation and API configuration
Cell 2: Market mover (top gainer) retrieval
Cell 3: Bandar accumulation and distribution analysis
Cell 4: Automated bandar scanner
Cell 5: Smart money report generation
Cell 1 - Install Library and API Configuration
# =====================================
# CELL 1 : SETUP
# =====================================

!pip install requests pandas tabulate -q

import requests
import pandas as pd
import json
from tabulate import tabulate


API_HOST = "indonesia-stock-exchange-idx.p.rapidapi.com"


HEADERS = {
    "Content-Type": "application/json",
    "x-rapidapi-host": API_HOST,
    "x-rapidapi-key": "YOUR_API_KEY"
}
Explanation
Cell 1 prepares the Python environment and configures the connection to the Indonesia Stock Exchange API.
The required libraries are installed and imported:
requestsis used for sending API requests.pandasis used for data processing.jsonis used for processing API responses.tabulateis used for generating structured table output.
The API configuration defines the RapidAPI host and authentication headers required to access IDX market data.
The API key should be stored securely and should not be publicly shared.
Cell 2 - Get Market Mover (Top Gainer)
# =====================================
# CELL 2 : MARKET MOVER
# =====================================


def getMarketMover():

    url = (
        "https://indonesia-stock-exchange-idx.p.rapidapi.com/"
        "api/movers/top-gainer?"
        "filterStocks=FILTER_STOCKS_TYPE_MAIN_BOARD,"
        "FILTER_STOCKS_TYPE_DEVELOPMENT_BOARD"
    )


    response = requests.get(
        url,
        headers=HEADERS
    )


    print(
        "Status:",
        response.status_code
    )


    data = response.json()


    return data


# Execute

market_mover = getMarketMover()

market_mover
Explanation
Cell 2 retrieves market mover data from the IDX API.
The function:
getMarketMover()accesses the top gainer endpoint:
/api/movers/top-gainerThe analysis includes stocks from:
Main Board
Development Board
as defined in the API filter parameters.
The API response is stored in:
market_moverwhich contains information about stocks experiencing significant price increases.
Market mover analysis is useful as an initial screening tool to identify stocks with strong short-term momentum.
Cell 3 - Bandar Distribution and Accumulation Analysis
# =====================================
# CELL 3 : BANDAR ANALYSIS
# =====================================


def getBandarDistribution(symbol="BUMI", days=30):

    url = (
        f"https://indonesia-stock-exchange-idx.p.rapidapi.com/"
        f"api/analysis/bandar/distribution/{symbol}?days={days}"
    )


    response = requests.get(
        url,
        headers=HEADERS
    )


    print(
        "Distribution Status:",
        response.status_code
    )


    return response.json()


def getBandarAccumulation(symbol="BUMI", days=30):

    url = (
        f"https://indonesia-stock-exchange-idx.p.rapidapi.com/"
        f"api/analysis/bandar/accumulation/{symbol}?days={days}"
    )


    response = requests.get(
        url,
        headers=HEADERS
    )


    print(
        "Accumulation Status:",
        response.status_code
    )


    return response.json()


# Test BUMI

symbol = "BUMI"


distribution = getBandarDistribution(symbol)

accumulation = getBandarAccumulation(symbol)


print("DISTRIBUTION")

display(distribution)


print("ACCUMULATION")

display(accumulation)
Explanation
Cell 3 analyzes bandar activity through two separate indicators:
Bandar Distribution
Bandar Accumulation
The function:
getBandarDistribution()retrieves information about potential selling activity from large market participants.
The function:
getBandarAccumulation()retrieves information about potential buying activity or accumulation behavior.
Both functions analyze the selected stock using a specific observation period:
days = 30and default stock:
symbol = "BUMI"The API endpoints used are:
/api/analysis/bandar/distribution/{symbol}and
/api/analysis/bandar/accumulation/{symbol}These indicators are useful for identifying possible smart money behavior.
Cell 4 - Simple Bandar Scanner
# =====================================
# CELL 4 : BANDAR SCANNER
# =====================================


def analyzeStock(symbol):

    acc = getBandarAccumulation(symbol)

    dist = getBandarDistribution(symbol)


    result = {

        "Symbol": symbol,

        "Accumulation": acc,

        "Distribution": dist

    }


    return result


# Example

stock_analysis = analyzeStock("BUMI")


stock_analysis
Explanation
Cell 4 creates an automated stock analysis function.
The function:
analyzeStock()combines two separate analyses:
Accumulation data
Distribution data
into one dictionary output:
resultThis approach simplifies the process because users only need to enter one stock symbol to retrieve both bandar indicators.
For example:
analyzeStock("BUMI")will automatically retrieve accumulation and distribution information for BUMI.
Cell 5 - Smart Money Report Generator
# =====================================
# CELL 5 : REPORT TABLE
# =====================================


def extract_value(data):

    if isinstance(data, dict):

        if "data" in data:

            return data["data"]

        else:

            return data


    return data


def bandar_signal(acc, dist):

    acc_text = json.dumps(acc).lower()

    dist_text = json.dumps(dist).lower()


    if "exceeded" in acc_text or "429" in acc_text:

        acc_status = (
            "Data akumulasi tidak tersedia"
        )

    else:

        acc_status = (
            "Bandar terlihat melakukan akumulasi"
        )


    if "exceeded" in dist_text or "429" in dist_text:

        dist_status = (
            "Data distribusi tidak tersedia"
        )

    else:

        dist_status = (
            "Bandar terlihat melakukan distribusi"
        )


    if (
        "akumulasi" in acc_status.lower()
        and "tidak tersedia" not in acc_status
    ):

        conclusion = (
            "POTENSI SMART MONEY MASUK"
        )


    elif "distribusi" in dist_status.lower():

        conclusion = (
            "WASPADA DISTRIBUSI"
        )


    else:

        conclusion = (
            "WAIT / BELUM ADA SINYAL"
        )


    return (
        acc_status,
        dist_status,
        conclusion
    )


def create_easy_report(symbol):


    acc = getBandarAccumulation(symbol)

    dist = getBandarDistribution(symbol)


    acc_status, dist_status, conclusion = bandar_signal(
        acc,
        dist
    )


    report = {

        "symbol": symbol,

        "acc_status": acc_status,

        "dist_status": dist_status,

        "kesimpulan": conclusion

    }


    return report


# RUN

report = create_easy_report("BUMI")

report
Explanation
Cell 5 generates a simplified smart money report.
The function:
bandar_signal()evaluates accumulation and distribution responses from the API.
The system checks:
Availability of accumulation data.
Availability of distribution data.
Potential accumulation signals.
Potential distribution signals.
Based on these conditions, the program generates three possible conclusions:
Potential Smart Money Entry
Warning Distribution
Wait / No Clear Signal
The final report is generated through:
create_easy_report()which combines all information into a simple output containing:
Stock symbol
Accumulation status
Distribution status
Final conclusion
Conclusion
This project demonstrates how Python and RapidAPI can be used to build an automated IDX Smart Money Detection System.
The system integrates three important market analysis approaches:
Market Mover Analysis
To identify stocks with strong price momentum.Bandar Accumulation Analysis
To detect potential buying activity from large market participants.Bandar Distribution Analysis
To identify possible selling pressure from major holders.
The generated report provides a simple framework for monitoring market behavior and identifying potential smart money signals.
However, accumulation and distribution indicators should not be used as standalone trading decisions. Additional confirmation using price action, trading volume, company fundamentals, valuation, and overall market conditions is still required before making investment decisions.