
The development of data-driven market analysis has allowed investors to evaluate stock activity beyond traditional price movement. Transaction behavior, broker flow, and market participant distribution can provide additional information to understand how capital moves within the market.
The IDX Smart Money Dashboard Python is a Python-based market analysis project that integrates IDX market data into a structured workflow. The project combines three important market signals: Top Broker activity, Broker Activity, and Bandar Distribution.
The system uses IDX API integration to collect market data, processes complex JSON responses, extracts relevant information, and presents the result through a dashboard. The workflow consists of five main stages: API configuration, data collection, JSON processing, data extraction, and dashboard visualization.
This project is designed as an analytical framework to help users study broker transactions and smart money activity. It is not intended to become an automatic trading system, therefore the generated insights should still be evaluated together with fundamental analysis, valuation, liquidity, market conditions, and risk management.
Cell 1 — Import Library & API Configuration
This cell prepares the Python environment and configures the IDX API connection. The project uses several libraries for data retrieval, processing, and visualization.
# -*- coding: utf-8 -*-

# =====================================================
# IDX SMART BROKER INTELLIGENCE PROJECT
# =====================================================

import requests
import pandas as pd
import numpy as np
import matplotlib.pyplot as plt
from datetime import datetime


# ==============================
# API CONFIG
# ==============================

BASE_URL = "https://indonesia-stock-exchange-idx.p.rapidapi.com"


HEADERS = {
    "Content-Type": "application/json",
    "x-rapidapi-host": "indonesia-stock-exchange-idx.p.rapidapi.com",
    "x-rapidapi-key": "YOUR_RAPIDAPI_KEY"
}


print("IDX Intelligence System Ready")
print(datetime.now())
Explanation
This cell initializes the project environment. The imported libraries support API communication, data manipulation, numerical processing, and visualization.
The API configuration defines the IDX endpoint and authentication header required for retrieving market information. The system then displays a confirmation message and execution time before moving to the data collection stage.
Cell 2 — API Request Engine
This cell creates a reusable function to communicate with IDX API and handle possible request limitations.
# =====================================================
# API REQUEST ENGINE V2
# WITH RATE LIMIT HANDLING
# =====================================================

import time


def api_get(endpoint, params=None, retry=3):

    url = BASE_URL + endpoint


    for attempt in range(retry):

        response = requests.get(
            url,
            headers=HEADERS,
            params=params
        )


        # SUCCESS

        if response.status_code == 200:

            print(
                "SUCCESS:",
                endpoint
            )

            return response.json()


        # RATE LIMIT

        elif response.status_code == 429:

            wait_time = (attempt + 1) * 10

            print(
                f"RATE LIMIT 429. Waiting {wait_time} seconds..."
            )

            time.sleep(wait_time)


        else:

            print(
                "ERROR:",
                response.status_code,
                response.text[:200]
            )

            return None


    print(
        "FAILED AFTER RETRY:",
        endpoint
    )

    return None


# =====================================================
# DOWNLOAD DATA
# =====================================================

top_broker = api_get(
    "/api/market-detector/top-broker",
    {
        "marketType":"MARKET_TYPE_ALL",
        "period":"TB_PERIOD_LAST_1_DAY",
        "order":"ORDER_BY_ASC",
        "sort":"TB_SORT_BY_TOTAL_VALUE"
    }
)


time.sleep(3)


broker_activity = api_get(
    "/api/market-detector/broker-activity/DH",
    {
        "limit":50,
        "marketBoard":"MARKET_BOARD_ALL",
        "page":1,
        "investorType":"INVESTOR_TYPE_ALL",
        "from":"2026-08-24",
        "to":"2026-08-24",
        "transactionType":"TRANSACTION_TYPE_NET"
    }
)


time.sleep(3)


bandar_distribution = api_get(
    "/api/analysis/bandar/distribution/BUMI",
    {
        "days":30
    }
)


print("\nAPI COLLECTION FINISHED")
Explanation
The api_get() function manages API requests, validates responses, and handles HTTP 429 rate limit errors by applying a retry mechanism.
The system collects three main datasets:
Top Broker
Broker Activity
Bandar Distribution
These datasets become the foundation for the smart money dashboard analysis.
Cell 3 — JSON Explorer & Data Normalization
This cell is responsible for understanding and converting raw IDX API responses into structured datasets. Financial APIs often return nested JSON structures, therefore the system requires a normalization process before further analysis.
# =====================================================
# JSON EXPLORER
# =====================================================


def inspect_json(data, name):

    print("="*50)
    print(name)

    print(
        "TYPE:",
        type(data)
    )

    if isinstance(data,dict):

        print(
            "KEYS:"
        )

        print(
            data.keys()
        )

    print("="*50)


inspect_json(
    top_broker,
    "TOP BROKER"
)


inspect_json(
    broker_activity,
    "BROKER ACTIVITY"
)


inspect_json(
    bandar_distribution,
    "BANDAR DISTRIBUTION"
)


# =====================================================
# NORMALIZER
# =====================================================


def normalize_json(data):

    """
    mencari dataframe paling informatif
    """

    if data is None:
        return pd.DataFrame()


    if isinstance(data,list):

        return pd.DataFrame(data)


    if isinstance(data,dict):


        # cari nested list

        for key,value in data.items():

            if isinstance(value,list):

                return pd.DataFrame(value)


        # cari nested dict

        for key,value in data.items():

            if isinstance(value,dict):

                result = normalize_json(value)

                if len(result)>0:

                    return result


    return pd.DataFrame()


# Convert

df_top = normalize_json(top_broker)

df_activity = normalize_json(
    broker_activity
)

df_bandar = normalize_json(
    bandar_distribution
)


print("NORMALIZATION RESULT")

print(
    "Top Broker:",
    len(df_top)
)

print(
    "Activity:",
    len(df_activity)
)

print(
    "Bandar:",
    len(df_bandar)
)


display(df_top.head())
Explanation
This cell explores the structure of API responses before converting them into DataFrames.
The inspect_json() function identifies the response type and available keys, while normalize_json() searches for useful data structures inside nested JSON responses and converts them into pandas DataFrames.
The output creates three datasets:
df_topfor Top Broker datadf_activityfor Broker Activity datadf_bandarfor Bandar Distribution data
These structured datasets are required for the next stage, where the system performs deeper extraction and dashboard processing.
Cell 4 — Smart Data Extraction Engine
This cell extracts the relevant information from complex JSON responses. The recursive approach allows the system to locate data even when the API structure changes or contains multiple nested layers.
# =====================================================
# SMART DATA EXTRACTION ENGINE
# =====================================================


def recursive_find_list(obj):
    """
    Mencari list terdalam pada JSON
    """

    result = []


    if isinstance(obj,list):

        if len(obj) > 0:
            return obj


    elif isinstance(obj,dict):

        for key, value in obj.items():

            found = recursive_find_list(value)

            if len(found) > 0:
                return found


    return result


def recursive_find_dict(obj, keyword):

    """
    Cari object berdasarkan keyword
    """

    if isinstance(obj,dict):

        for key,value in obj.items():

            if keyword.lower() in key.lower():

                return value


            result = recursive_find_dict(
                value,
                keyword
            )

            if result:

                return result


    return None


# ======================================
# TOP BROKER
# ======================================

top_rows = recursive_find_list(
    top_broker
)


df_top = pd.DataFrame(
    top_rows
)


# ======================================
# BROKER ACTIVITY
# ======================================

activity_rows = recursive_find_list(
    broker_activity
)


df_activity = pd.DataFrame(
    activity_rows
)


# ======================================
# BANDAR DISTRIBUTION
# ======================================

bandar_rows = recursive_find_list(
    bandar_distribution
)


df_bandar = pd.DataFrame(
    bandar_rows
)


print("="*60)
print("DATA EXTRACTION RESULT")
print("="*60)


print(
    "Top Broker:",
    len(df_top)
)


print(
    "Broker Activity:",
    len(df_activity)
)


print(
    "Bandar:",
    len(df_bandar)
)


print("\nTOP BROKER SAMPLE")

display(
    df_top.head()
)
Explanation
The extraction engine uses recursive functions to search through nested JSON structures and identify the required data.
The extracted information is converted into DataFrames:
Top Broker dataset
Broker Activity dataset
Bandar Distribution dataset
This process creates cleaner data that can be directly used by the dashboard visualization stage.
Cell 5 — IDX Smart Money Intelligence Dashboard
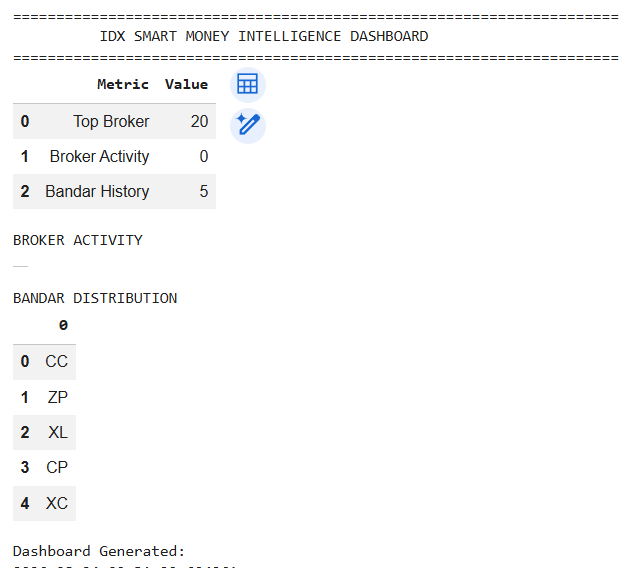
This cell presents the processed data into a simple dashboard format. The dashboard provides summary information, broker visualization, activity tables, and bandar distribution data.
# =====================================================
# IDX SMART MONEY INTELLIGENCE DASHBOARD
# =====================================================


from IPython.display import display


print("="*70)
print("          IDX SMART MONEY INTELLIGENCE DASHBOARD")
print("="*70)


# SUMMARY CARD

summary = pd.DataFrame({

    "Metric":[

        "Top Broker",
        "Broker Activity",
        "Bandar History"

    ],


    "Value":[

        len(df_top),
        len(df_activity),
        len(df_bandar)

    ]

})


display(summary)


# TOP BROKER CHART

if len(df_top)>0:


    numeric_cols = df_top.select_dtypes(
        include=np.number
    ).columns


    if len(numeric_cols)>0:


        value_col = numeric_cols[0]


        broker_chart = (
            df_top
            .sort_values(
                value_col,
                ascending=False
            )
            .head(10)
        )


        plt.figure(
            figsize=(12,5)
        )


        plt.bar(
            broker_chart.index.astype(str),
            broker_chart[value_col]
        )


        plt.title(
            "TOP BROKER TRANSACTION FLOW"
        )


        plt.xticks(
            rotation=45
        )


        plt.show()


# BROKER ACTIVITY TABLE

print("\nBROKER ACTIVITY")

display(
    df_activity.head(10)
)


# BANDAR DISTRIBUTION

print("\nBANDAR DISTRIBUTION")

display(
    df_bandar.head(10)
)


print("\nDashboard Generated:")

print(datetime.now())
Explanation
The dashboard summarizes the processed market data into a readable format.
The output includes:
summary card showing dataset availability,
top broker transaction visualization,
broker activity table,
bandar distribution table.
This presentation layer transforms raw API data into information that is easier to evaluate.
Understanding Smart Money Analysis
The IDX Smart Money Dashboard combines three perspectives:
Top Broker
Top Broker analysis identifies broker channels with significant transaction activity. It provides information about where major transaction flows occur within the market.
Broker Activity
Broker Activity provides additional transaction-level information to understand buying and selling participation from different broker channels.
Bandar Distribution
Bandar Distribution provides another perspective regarding transaction distribution over a selected period.
These indicators should not be interpreted individually as direct trading signals. Instead, they should be combined with other market factors to build a more complete analysis framework.
Limitations
Although the dashboard provides useful market intelligence, several limitations remain.
First, broker and transaction data do not automatically represent investor intentions. A broker code does not always reveal the final identity or strategy of the market participant.
Second, smart money indicators cannot predict future price movement independently. Market decisions should also consider:
company fundamentals,
valuation,
liquidity,
technical analysis,
macroeconomic conditions,
risk management.
The dashboard functions as an analytical tool rather than an automated trading system.
Conclusion
The IDX Smart Money Dashboard Python demonstrates how IDX API data can be transformed into a structured market analysis workflow using Python.
The project integrates API data collection, JSON processing, data extraction, and dashboard visualization into a single system. By combining Top Broker, Broker Activity, and Bandar Distribution data, the dashboard provides a broader perspective of market participation.
This framework can support deeper stock market research by making complex transaction data easier to analyze. However, the dashboard should be used as a supporting analytical tool and combined with comprehensive investment evaluation before making any decisions.