
Sector analysis is an important part of understanding how different industries interact within the stock market. Investors often begin by identifying companies that belong to a particular subsector before evaluating external factors that may influence the sector's overall performance.
Rather than gathering this information manually, both datasets can be obtained automatically through the Indonesia Stock Exchange API available on RapidAPI.
In this project, we will build a Python dashboard using two API endpoints:
getSectorCompanies
getSectorCorrelation
The notebook consists of five cells. The first two cells configure the API connection and retrieve data from both endpoints. The following cells normalize nested JSON responses, clean the extracted records, convert them into pandas DataFrames, and finally generate a dashboard summarizing sector companies together with sector correlation information.
For security purposes, the RapidAPI key should be replaced with YOUR_RAPIDAPI_KEY. Apart from that replacement, every notebook cell should remain identical to the original implementation.
Cell 1 — Import Libraries and Configure the API
The first cell imports the required Python libraries and prepares the RapidAPI configuration that will be reused throughout the notebook.
It defines the authentication headers, API host, base URL, and configures pandas display options before any request is executed.
# ============================================================
# CELL 1 - IMPORT LIBRARY & KONFIGURASI
# ============================================================

import requests
import pandas as pd
from datetime import datetime
import time

# ==========================
# MASUKKAN API KEY DISINI
# ==========================
API_KEY = "YOUR_API_KEY"

BASE_URL = "https://indonesia-stock-exchange-idx.p.rapidapi.com"

HEADERS = {
    "x-rapidapi-key": API_KEY,
    "x-rapidapi-host": "indonesia-stock-exchange-idx.p.rapidapi.com",
    "Content-Type": "application/json"
}

pd.set_option("display.max_columns", None)
pd.set_option("display.width", 200)
The notebook imports four primary libraries:
requests performs HTTP requests to the Indonesia Stock Exchange API.
pandas converts normalized responses into structured DataFrames.
datetime records the processing timestamp.
time introduces delays between API requests to reduce the possibility of rate limiting.
Several pandas display options are also configured to improve DataFrame readability inside Google Colab.
The API authentication settings are stored inside the HEADERS dictionary so that every request can reuse the same configuration throughout the notebook.
Cell 2 — Retrieve Sector Companies and Sector Correlation Data
The second cell defines the API endpoints and retrieves data from both Indonesia Stock Exchange services.
# ============================================================
# CELL 2 - REQUEST API
# ============================================================

endpoints = {
    "companies":
    "/api/sectors/7/subsectors/19/companies",

    "correlation":
    "/api/sectors/correlation/energy"
}

responses = {}

for name, endpoint in endpoints.items():

    print("="*90)
    print("Endpoint :", endpoint)

    try:

        r = requests.get(
            BASE_URL + endpoint,
            headers=HEADERS,
            timeout=30
        )

        print("Status   :", r.status_code)

        if r.status_code == 200:
            responses[name] = r.json()
        else:
            responses[name] = None
            print(r.text)

    except Exception as e:

        responses[name] = None
        print("ERROR :", e)

    time.sleep(2)
The notebook stores both endpoint paths inside the endpoints dictionary before processing them sequentially.
The first endpoint retrieves companies that belong to Subsector 19 under Sector 7, providing the list of companies associated with the selected subsector.
The second endpoint retrieves Sector Correlation data for the Energy sector, which contains factors and indicators that may influence sector performance.
Instead of creating separate request functions, the notebook loops through each endpoint and performs the following steps:
Builds the complete request URL.
Sends an authenticated HTTP GET request.
Prints the requested endpoint.
Displays the returned HTTP status code.
Stores successful responses inside the
responsesdictionary.Stores
Nonewhenever the request fails.Waits two seconds before requesting the next endpoint to reduce the possibility of hitting RapidAPI rate limits.
At the end of this process, both API responses are available for normalization in the following notebook cells through the shared responses dictionary.
Cell 3 — Normalize API Responses
The third cell extracts useful records from both API responses and converts them into standardized lists that can later be transformed into pandas DataFrames.
# ============================================================
# CELL 3 - NORMALISASI DATA DAN DEBUG STRUKTUR RESPONSE
# ============================================================

def get_nested_value(data, possible_keys):
    """
    Mencari nilai berdasarkan beberapa kemungkinan key
    di dalam dictionary bertingkat.
    """

    if not isinstance(data, dict):
        return None

    # Cari langsung pada level saat ini
    for key in possible_keys:
        if key in data and data[key] is not None:
            return data[key]

    # Cari secara rekursif
    for value in data.values():
        if isinstance(value, dict):
            result = get_nested_value(value, possible_keys)

            if result is not None:
                return result

    return None


def normalize_records(raw_data, possible_keys):
    """
    Mengubah response API menjadi list of dictionaries
    agar dapat diproses menjadi DataFrame.
    """

    if raw_data is None:
        return []

    # Response langsung berupa list
    if isinstance(raw_data, list):
        return raw_data

    # Response berupa dictionary
    if isinstance(raw_data, dict):

        extracted = get_nested_value(raw_data, possible_keys)

        # Data ditemukan dalam bentuk list
        if isinstance(extracted, list):
            return extracted

        # Data ditemukan dalam bentuk dictionary
        if isinstance(extracted, dict):

            # Dictionary berisi records berdasarkan kode/nama
            records = []

            for key, value in extracted.items():

                if isinstance(value, dict):
                    item = value.copy()

                    if not any(
                        field in item
                        for field in ["symbol", "code", "ticker", "sector"]
                    ):
                        item["key"] = key

                    records.append(item)

                elif isinstance(value, list):
                    records.extend(value)

                else:
                    records.append({
                        "key": key,
                        "value": value
                    })

            return records

        # Jika tidak menemukan key khusus,
        # tetapi response mempunyai key data
        data_value = raw_data.get("data")

        if isinstance(data_value, list):
            return data_value

        if isinstance(data_value, dict):

            records = []

            for key, value in data_value.items():

                if isinstance(value, list):
                    records.extend(value)

                elif isinstance(value, dict):
                    item = value.copy()
                    item.setdefault("key", key)
                    records.append(item)

                else:
                    records.append({
                        "key": key,
                        "value": value
                    })

            return records

    return []


# ============================================================
# NORMALISASI SECTOR COMPANIES
# ============================================================

company_raw = responses.get("companies")

company_records = normalize_records(
    company_raw,
    [
        "companies",
        "company",
        "sectorCompanies",
        "sector_companies",
        "items",
        "results",
        "records",
        "data"
    ]
)

company_df = (
    pd.json_normalize(company_records)
    if company_records
    else pd.DataFrame()
)


# ============================================================
# NORMALISASI SECTOR CORRELATION
# ============================================================

corr_raw = responses.get("correlation")

corr_records = normalize_records(
    corr_raw,
    [
        "correlations",
        "correlation",
        "sectorCorrelation",
        "sectorCorrelations",
        "sector_correlation",
        "items",
        "results",
        "records",
        "data"
    ]
)

corr_df = (
    pd.json_normalize(corr_records)
    if corr_records
    else pd.DataFrame()
)


# ============================================================
# HASIL NORMALISASI
# ============================================================

print("=" * 90)
print("HASIL NORMALISASI")
print("=" * 90)

print("Companies   :", len(company_df))
print("Correlation :", len(corr_df))

print("\nCompany Columns")
print(company_df.columns.tolist())

print("\nCorrelation Columns")
print(corr_df.columns.tolist())


# ============================================================
# DEBUG STRUKTUR RESPONSE
# ============================================================

print("\n")
print("=" * 90)
print("DEBUG STRUKTUR RESPONSE")
print("=" * 90)

print("\nSECTOR COMPANIES")
print("-" * 90)
print("Tipe response :", type(company_raw).__name__)

if isinstance(company_raw, dict):
    print("Top-level keys:", list(company_raw.keys()))
else:
    print("Raw response :", company_raw)


print("\nSECTOR CORRELATION")
print("-" * 90)
print("Tipe response :", type(corr_raw).__name__)

if isinstance(corr_raw, dict):
    print("Top-level keys:", list(corr_raw.keys()))
else:
    print("Raw response :", corr_raw)


# ============================================================
# PREVIEW RECORD HASIL EKSTRAKSI
# ============================================================

print("\n")
print("=" * 90)
print("PREVIEW HASIL EKSTRAKSI")
print("=" * 90)

print("\nCompanies Preview:")

if company_records:
    for item in company_records[:3]:
        print(item)
else:
    print("Tidak ada Companies yang berhasil dinormalisasi.")
    print("Raw Companies Response:")
    print(company_raw)


print("\nCorrelation Preview:")

if corr_records:
    for item in corr_records[:3]:
        print(item)
else:
    print("Tidak ada Correlation yang berhasil dinormalisasi.")
    print("Raw Correlation Response:")
    print(corr_raw)
Extracting Nested Data
The notebook begins by defining two helper functions:
get_nested_value()and
normalize_records()The first function recursively searches nested dictionaries for one of several possible keys, while the second converts different response structures into a standardized list of dictionaries.
This flexible normalization logic enables the notebook to process API responses regardless of whether the data is returned as a list, dictionary, or nested object.
Normalizing Sector Companies
The notebook retrieves the response stored under:
responses["companies"]It then searches for possible keys such as:
companies
company
sectorCompanies
items
results
records
data
When valid records are found, they are converted into a pandas-compatible structure and stored inside:
company_dfusing:
pd.json_normalize()This produces a flat table that is easier to inspect and analyze.
Normalizing Sector Correlation
The notebook performs the same process for the Sector Correlation endpoint.
It searches for keys including:
correlations
correlation
sectorCorrelation
sectorCorrelations
items
records
data
The extracted records are normalized and converted into:
corr_dfwhich becomes the primary DataFrame for the correlation analysis.
Response Inspection
Before continuing to the next stage, the notebook prints several diagnostics, including:
Total normalized company records.
Total normalized correlation records.
Available DataFrame columns.
Original response type.
Top-level JSON keys.
Preview of the extracted records.
These diagnostics help verify that the normalization process completed successfully and make troubleshooting much easier whenever the API response changes.
Cell 4 — Clean and Preview the Data
After the normalization process is complete, the notebook cleans both DataFrames and prepares them for the final dashboard.
# ============================================================
# CELL 4 - PEMBERSIHAN DAN PREVIEW DATA
# ============================================================

# ============================================================
# MEMBERSIHKAN DATA SECTOR COMPANIES
# ============================================================

company_clean_df = company_df.copy()

if not company_clean_df.empty:

    # Hapus baris yang seluruh nilainya kosong
    company_clean_df = company_clean_df.dropna(how="all")

    # Hapus kolom yang seluruh nilainya kosong
    company_clean_df = company_clean_df.dropna(axis=1, how="all")

    # Reset index
    company_clean_df = company_clean_df.reset_index(drop=True)


# ============================================================
# MEMBERSIHKAN DATA SECTOR CORRELATION
# ============================================================

corr_clean_df = corr_df.copy()

if not corr_clean_df.empty:

    # Hapus baris metadata seperti sector dan sectorKey
    if "key" in corr_clean_df.columns:
        corr_clean_df = corr_clean_df[
            ~corr_clean_df["key"].isin(["sector", "sectorKey"])
        ]

    # Ambil hanya baris yang mempunyai factor atau symbol
    valid_condition = pd.Series(False, index=corr_clean_df.index)

    if "factor" in corr_clean_df.columns:
        valid_condition = valid_condition | corr_clean_df["factor"].notna()

    if "symbol" in corr_clean_df.columns:
        valid_condition = valid_condition | corr_clean_df["symbol"].notna()

    corr_clean_df = corr_clean_df[valid_condition]

    # Hapus baris kosong
    corr_clean_df = corr_clean_df.dropna(how="all")

    # Hapus kolom metadata yang tidak diperlukan
    columns_to_remove = ["key", "value"]

    corr_clean_df = corr_clean_df.drop(
        columns=[
            col for col in columns_to_remove
            if col in corr_clean_df.columns
        ],
        errors="ignore"
    )

    # Hapus kolom yang seluruh nilainya kosong
    corr_clean_df = corr_clean_df.dropna(axis=1, how="all")

    # Reset index
    corr_clean_df = corr_clean_df.reset_index(drop=True)


# Agar Cell 5 tetap dapat menggunakan nama variabel sebelumnya
company_df = company_clean_df
corr_df = corr_clean_df


# ============================================================
# PREVIEW SECTOR COMPANIES
# ============================================================

print("=" * 90)
print("SECTOR COMPANIES")
print("=" * 90)

if not company_df.empty:

    print("Jumlah Data :", len(company_df))
    print("Kolom       :", company_df.columns.tolist())
    print()

    display(company_df.head(10))

else:
    print("Tidak ada data Sector Companies.")


# ============================================================
# PREVIEW SECTOR CORRELATION
# ============================================================

print("\n")
print("=" * 90)
print("SECTOR CORRELATION")
print("=" * 90)

if not corr_df.empty:

    print("Jumlah Data :", len(corr_df))
    print("Kolom       :", corr_df.columns.tolist())
    print()

    preferred_columns = [
        "factor",
        "symbol",
        "type",
        "correlationType",
        "currentPrice",
        "change",
        "changePercent",
        "impact",
        "impactDescription",
        "explanation"
    ]

    available_columns = [
        col for col in preferred_columns
        if col in corr_df.columns
    ]

    if available_columns:
        display(corr_df[available_columns].head(10))
    else:
        display(corr_df.head(10))

else:
    print("Tidak ada data Sector Correlation.")


# ============================================================
# INFORMASI TAMBAHAN
# ============================================================

print("\n")
print("=" * 90)
print("RINGKASAN PEMBERSIHAN")
print("=" * 90)

print("Sector Companies   :", len(company_df))
print("Sector Correlation :", len(corr_df))
Cleaning Sector Companies
The notebook first processes the Sector Companies DataFrame.
The cleaning process includes:
Removing rows containing only empty values.
Removing columns that contain no useful information.
Resetting the DataFrame index.
These steps ensure that only meaningful company information remains before it is displayed.
Cleaning Sector Correlation
The Sector Correlation DataFrame undergoes additional processing.
The notebook removes metadata rows such as:
sectorsectorKey
It then keeps only rows containing meaningful analytical fields such as factor or symbol.
Finally, unnecessary metadata columns are removed before resetting the DataFrame index. This produces a cleaner dataset focused on sector correlation analysis.
Previewing the Results
The notebook concludes this stage by displaying:
Total Sector Companies records.
Available company columns.
Company DataFrame preview.
Total Sector Correlation records.
Available correlation columns.
Correlation DataFrame preview.
A final cleaning summary showing the number of records retained after preprocessing.
This validation step confirms that both datasets are ready to be used in the final dashboard.
Cell 5 — IDX Sector Analysis Dashboard
# ============================================================
# CELL 5 - DASHBOARD
# ============================================================

print("="*100)
print("IDX SECTOR ANALYSIS DASHBOARD")
print("="*100)

# =====================================================
# COMPANIES
# =====================================================

print("\n🏢 Sector Companies")
print("-"*80)

if len(company_df):

    print("Jumlah Data :", len(company_df))
    print()

    code_col = next((c for c in company_df.columns if "symbol" in c.lower() or "code" in c.lower()), None)
    name_col = next((c for c in company_df.columns if "name" in c.lower()), None)
    sector_col = next((c for c in company_df.columns if "sector" in c.lower()), None)

    for i, row in company_df.head(10).iterrows():

        code = row[code_col] if code_col else "-"
        name = row[name_col] if name_col else "-"
        sector = row[sector_col] if sector_col else "-"

        print(f"{i+1:02d}. {code} | {name} | {sector}")

else:

    print("Tidak ada data.")


# =====================================================
# CORRELATION
# =====================================================

print("\n")
print("🔗 Sector Correlation")
print("-"*80)

if len(corr_df):

    print("Jumlah Data :", len(corr_df))
    print()

    sector_col = next((c for c in corr_df.columns if "sector" in c.lower()), None)
    corr_col = next((c for c in corr_df.columns if "corr" in c.lower()), None)
    score_col = next((c for c in corr_df.columns if "score" in c.lower()), None)

    for i, row in corr_df.head(10).iterrows():

        sector = row[sector_col] if sector_col else "-"
        corr = row[corr_col] if corr_col else "-"
        score = row[score_col] if score_col else "-"

        print(f"{i+1:02d}. {sector} | Correlation : {corr} | Score : {score}")

else:

    print("Tidak ada data.")


# =====================================================
# SUMMARY
# =====================================================

print("\n")
print("="*100)
print("RINGKASAN")
print("="*100)

print("🏢 Companies        :", len(company_df))
print("🔗 Correlation      :", len(corr_df))

print()

print(
    "Status Companies   :",
    "Berhasil" if responses.get("companies") else "Gagal"
)

print(
    "Status Correlation :",
    "Berhasil" if responses.get("correlation") else "Gagal"
)

print()

print(
    "Selesai diproses :",
    datetime.now().strftime("%d-%m-%Y %H:%M:%S")
)
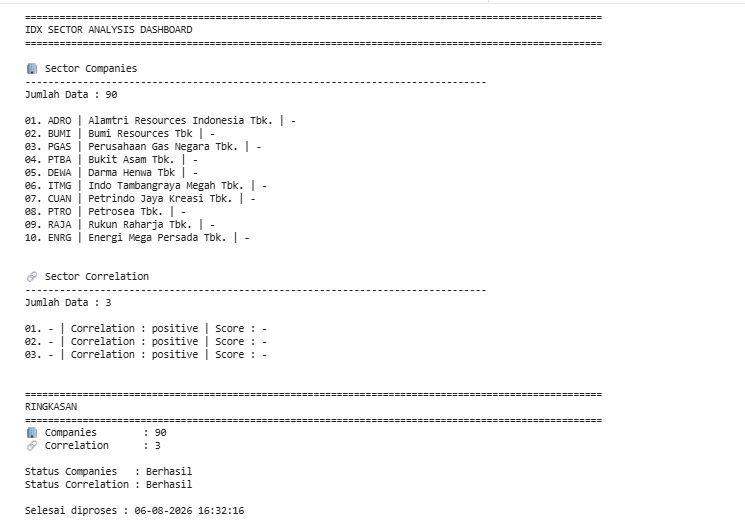
Sector Companies Dashboard
The first section searches dynamically for columns containing stock codes, company names, and sector information. It then displays up to the first ten available company records.
When the DataFrame is empty, the notebook prints a simple no-data message instead of raising an error.
Sector Correlation Dashboard
The second section searches for columns related to sector names, correlation values, and scores.
Up to ten records are displayed in a compact format. If the expected columns are unavailable, the notebook substitutes a dash so that execution can continue safely.
Final Summary
The notebook concludes by displaying:
Total Sector Companies records.
Total Sector Correlation records.
Request status for both endpoints.
Final processing timestamp.
The request status is determined directly from the corresponding objects stored inside the responses dictionary.
Final Result
After executing all five notebook cells, this project can:
Retrieve companies from a selected IDX subsector.
Retrieve Energy sector correlation data.
Handle failed or empty API responses.
Search nested JSON structures recursively.
Normalize different response formats.
Convert extracted records into pandas DataFrames.
Remove empty rows, empty columns, and metadata records.
Display company codes, names, and sector information.
Display correlation-related values and scores.
Generate a concise dashboard with endpoint status and completion time.
Conclusion
This project demonstrates how to build an IDX Sector Companies and Sector Correlation Dashboard using Python and RapidAPI.
The Sector Companies endpoint provides insight into the listed companies within a selected subsector, while the Sector Correlation endpoint helps identify external factors and market relationships connected to the Energy sector.
The notebook follows a complete workflow that includes API requests, nested JSON normalization, DataFrame cleaning, structured data previews, and final dashboard generation. Its flexible normalization logic also helps the project remain usable when the API returns different response structures.
This workflow can serve as a foundation for broader sector research, company screening, macro-factor analysis, and automated Indonesia Stock Exchange monitoring tools.