
This project develops an automated IDX market intelligence system using Python and RapidAPI. The system combines three important market analysis components:
Subsector Analysis
Broker Activity Monitoring
Pump and Dump Detection
The objective of this project is to build a simple framework for monitoring market structure, tracking broker transaction activity, and identifying potential abnormal price movements in Indonesian stocks.
The project uses Python libraries such as requests for API communication, pandas for data processing, and JSON handling for transforming API responses into structured datasets.
The complete workflow is organized into five cells, starting from API configuration, data retrieval, pump-dump analysis, and finally generating a market intelligence dashboard.
Cell 1 - Setup Library and API Configuration
# =====================================
# CELL 1 : SETUP
# =====================================

import requests
import pandas as pd
import json
from datetime import datetime


API_KEY = "YOUR_API_KEY"

HOST = "indonesia-stock-exchange-idx.p.rapidapi.com"


HEADERS = {
    "Content-Type": "application/json",
    "x-rapidapi-host": HOST,
    "x-rapidapi-key": API_KEY
}


def call_api(url, params=None):

    try:

        response = requests.get(
            url,
            headers=HEADERS,
            params=params,
            timeout=30
        )


        print("Status :", response.status_code)


        try:
            return response.json()

        except:

            print(response.text)
            return None


    except Exception as e:

        print("ERROR :",e)

        return None
Explanation
Cell 1 prepares the Python environment and creates the basic API request function.
The program imports:
requestsfor sending HTTP requests.pandasfor data processing.jsonfor handling JSON responses.datetimefor recording analysis time.
The call_api() function acts as the main communication layer between Python and the IDX API. It sends GET requests with configured headers, checks the response status, and converts valid responses into JSON format.
Error handling is included to prevent the program from stopping when API requests fail or when the returned response is not valid JSON.
Cell 2 - Get Subsector Information
# =====================================
# CELL 2 : SUBSECTORS
# =====================================


sector_id = 7


subsector_url = (
    f"https://{HOST}/api/sectors/{sector_id}/subsectors"
)


subsector_json = call_api(
    subsector_url
)


if subsector_json:


    subsector_data = (
        subsector_json.get("data")
        if isinstance(subsector_json,dict)
        else subsector_json
    )


    subsector_df = pd.DataFrame(
        subsector_data
    )


    print(
        "Jumlah Subsector:",
        len(subsector_df)
    )


    display(
        subsector_df.head()
    )
Explanation
Cell 2 retrieves subsector information from a selected IDX sector.
The selected sector is defined using:
sector_id = 7The program then accesses the endpoint:
/api/sectors/{sector_id}/subsectorsto retrieve the list of subsectors associated with that sector.
The returned JSON response is converted into a pandas DataFrame:
subsector_dfwhich allows further analysis and filtering.
Subsector analysis provides a more detailed market view compared with analyzing only broad sectors. Investors can identify which industries contribute to a sector's overall movement.
Cell 3 - Broker Activity Analysis
# =====================================
# CELL 3 : BROKER ACTIVITY
# =====================================


broker_code = "DH"


broker_url = (
"https://indonesia-stock-exchange-idx.p.rapidapi.com"
f"/api/market-detector/broker-activity/{broker_code}"
)


params = {

    "limit":50,
    "marketBoard":"MARKET_BOARD_ALL",
    "page":1,
    "investorType":"INVESTOR_TYPE_ALL",
    "from":"2026-01-02",
    "to":"2026-01-02",
    "transactionType":"TRANSACTION_TYPE_NET"

}


broker_json = call_api(
    broker_url,
    params
)


if broker_json:


    broker_data = (
        broker_json.get("data")
        if isinstance(broker_json,dict)
        else broker_json
    )


    broker_df = pd.DataFrame(
        broker_data
    )


    print(
        "Jumlah Data Broker:",
        len(broker_df)
    )


    display(
        broker_df.head()
    )
Explanation
Cell 3 analyzes broker transaction activity.
The selected broker is:
broker_code = "DH"The API endpoint retrieves broker activity data:
/api/market-detector/broker-activity/{broker_code}with several parameters:
Market board: all boards
Investor type: all investors
Transaction type: net transaction
Date range analysis
The response is converted into:
broker_dfwhich contains broker trading activity data.
Broker activity analysis is useful for monitoring transaction concentration and identifying potential accumulation or distribution behavior from specific market participants.
Cell 4 - Pump and Dump Detection
# =====================================
# CELL 4 : PUMP DUMP DETECTION
# =====================================


symbol = "BUMI"

days = 14


pumpdump_url = (
    "https://indonesia-stock-exchange-idx.p.rapidapi.com"
    f"/api/analysis/bandar/pump-dump/{symbol}"
)


params = {
    "days": days
}


pumpdump_json = call_api(
    pumpdump_url,
    params
)


if pumpdump_json:


    print(
        json.dumps(
            pumpdump_json,
            indent=2
        )
    )


    if pumpdump_json.get("success"):


        data = pumpdump_json["data"]


        pumpdump_df = pd.DataFrame(
            [{
                "Symbol":
                    data.get("symbol"),

                "Company":
                    data.get("company_name"),

                "Analysis Date":
                    data.get("analysis_date"),

                "Risk Score":
                    data.get("risk_score"),

                "Status":
                    data.get("status"),

                "Recommendation":
                    data.get("recommendation"),

                "Safe Entry Price":
                    data.get("safe_entry_price"),

                "Confidence":
                    data.get("confidence")
            }]
        )


        display(
            pumpdump_df
        )
Explanation
Cell 4 performs pump and dump detection analysis.
The analyzed stock is:
symbol = "BUMI"with an analysis period:
days = 14The program accesses:
/api/analysis/bandar/pump-dump/{symbol}to retrieve risk analysis related to abnormal price movements.
The returned data contains several important metrics:
Symbol
Company name
Analysis date
Risk score
Status
Recommendation
Safe entry price
Confidence level
The system also extracts additional information:
Pump Indicators
pump_indicatorswhich evaluates possible price movement signals.
Historical Pattern
historical_patternwhich provides historical behavior related to similar events.
Warning Information
The program displays warnings returned by the API to highlight possible risks.
Cell 5 - Market Intelligence Dashboard
# =====================================
# CELL 5 : MARKET INTELLIGENCE DASHBOARD
# =====================================


dashboard = {}


dashboard["Analysis Time"] = datetime.now().strftime(
    "%Y-%m-%d %H:%M:%S"
)


if "subsector_df" in globals():

    dashboard["Total Subsector"] = len(
        subsector_df
    )

else:

    dashboard["Total Subsector"] = 0


if "broker_df" in globals():

    dashboard["Broker Activity Data"] = len(
        broker_df
    )

else:

    dashboard["Broker Activity Data"] = 0


if "data" in globals():

    dashboard["Symbol"] = data.get(
        "symbol"
    )

    dashboard["Status"] = data.get(
        "status"
    )

    dashboard["Risk Score"] = data.get(
        "risk_score"
    )

    dashboard["Recommendation"] = data.get(
        "recommendation"
    )

    dashboard["Confidence"] = data.get(
        "confidence"
    )

    dashboard["Safe Entry"] = data.get(
        "safe_entry_price"
    )


dashboard_df = pd.DataFrame(
    dashboard.items(),
    columns=[
        "Metric",
        "Value"
    ]
)


display(
    dashboard_df
)
Explanation
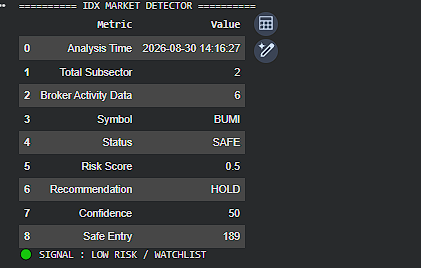
Cell 5 combines all previous analysis results into a simple market intelligence dashboard.
The dashboard summarizes:
Analysis time
Total subsector records
Broker activity data count
Stock symbol
Risk score
Recommendation
Confidence level
Safe entry price
The program also creates a simple market signal based on pump-dump risk:
Low risk / watchlist
Monitor
High risk
The signal is generated using the API status and risk score values.
Conclusion
This project demonstrates how Python and RapidAPI can be used to build an automated IDX market intelligence system.
The system integrates:
Subsector Analysis
To understand detailed industry classification.Broker Activity Monitoring
To observe transaction behavior from selected brokers.Pump and Dump Detection
To identify potential abnormal market movements and risk conditions.
The dashboard provides a structured approach for monitoring market activity and generating early risk signals. However, the output should not be interpreted as a direct trading recommendation. Additional evaluation using fundamental analysis, technical analysis, liquidity conditions, and broader market factors remains necessary before making investment decisions.