
This tutorial demonstrates how to build an Economic Calendar & Top Gainers Market Intelligence workflow using Python and the Indonesia Stock Exchange (IDX) API.
The Economic Calendar & Top Gainers Market Intelligence approach combines macroeconomic event monitoring with stock momentum tracking, allowing investors to gain a broader understanding of market conditions.
This notebook demonstrates how to build a simple market intelligence workflow using two Indonesia Stock Exchange API endpoints:
getEconomicCalendar
getMarketMover (Top Gainers)
The goal is to combine economic event monitoring with top-performing stock analysis so investors can monitor potential market catalysts and identify strong market momentum in a single workflow.
CELL 1 — Import Libraries
import requests
import pandas as pd
import time

from IPython.display import display, Markdown

pd.set_option("display.max_columns", None)
pd.set_option("display.max_colwidth", 100)
Explanation
Cell 1 prepares the notebook environment.
The notebook imports:
requests for API communication.
pandas for data processing and dataframe creation.
time for handling API delays.
display and Markdown for dashboard presentation.
The pandas display configuration is adjusted to ensure that large datasets can be displayed more clearly inside Google Colab.
CELL 2 — Configure API
BASE_URL = "https://indonesia-stock-exchange-idx.p.rapidapi.com"

HEADERS = {
    "Content-Type": "application/json",
    "x-rapidapi-host": "indonesia-stock-exchange-idx.p.rapidapi.com",
    "x-rapidapi-key": "YOUR_API_KEY"
}

display(Markdown("## ⚙️ Konfigurasi API Berhasil"))
Explanation
Cell 2 configures the API connection.
The notebook defines the base URL and request headers required to access the Indonesia Stock Exchange API through RapidAPI.
The API key is stored inside the request header and will be used for every API request performed throughout the notebook.
This centralized configuration simplifies future maintenance and updates.
CELL 3 — Create Helper Functions
def fetch_api(endpoint, retries=3):

    url = BASE_URL + endpoint

    for attempt in range(retries):

        try:
            response = requests.get(
                url,
                headers=HEADERS,
                timeout=30
            )

            if response.status_code == 429:
                wait_time = (attempt + 1) * 5

                print(
                    f"⚠️ Rate Limit (429). "
                    f"Menunggu {wait_time} detik..."
                )

                time.sleep(wait_time)
                continue

            response.raise_for_status()

            return response.json()

        except Exception as e:

            print(
                f"❌ Percobaan {attempt+1} gagal : {e}"
            )

            time.sleep(3)

    return {}

def extract_list(data):

    if isinstance(data, list):
        return data

    if isinstance(data, dict):

        possible_keys = [
            "data",
            "results",
            "items",
            "economic",
            "calendar",
            "stocks",
            "gainers",
            "topGainers"
        ]

        for key in possible_keys:

            if key in data and isinstance(data[key], list):
                return data[key]

    return []
Explanation
Cell 3 creates reusable helper functions.
fetch_api()
The function handles:
API communication.
Request retries.
Timeout management.
Rate-limit handling.
If the API returns status code 429, the notebook automatically waits before retrying the request.
extract_list()
The function extracts list-based data structures from API responses.
Since different endpoints may return different JSON formats, this helper function helps standardize data extraction and simplifies downstream processing.
CELL 4 — Retrieve Data from APIs
display(Markdown("## 📥 Mengambil Data dari API IDX"))

economic_calendar_raw = fetch_api(
    "/api/calendar/economic"
)

time.sleep(5)

market_mover_raw = fetch_api(
    "/api/movers/top-gainer?filterStocks=FILTER_STOCKS_TYPE_MAIN_BOARD,FILTER_STOCKS_TYPE_DEVELOPMENT_BOARD"
)

display(Markdown("✅ Pengambilan Data Selesai"))
Explanation
Cell 4 retrieves data from two IDX API endpoints.
The notebook calls:
Economic Calendar API
This endpoint provides economic events and macroeconomic schedules that may influence investor sentiment and overall market conditions.
Top Gainers Market API
This endpoint provides stocks with the strongest positive performance during the latest trading session.
The notebook applies filters to retrieve stocks from:
Main Board
Development Board
After both API requests are completed, the raw responses are stored for further processing.
CELL 5 — Display Market Intelligence Dashboard
# ==========================================
# CELL 5 : DASHBOARD MARKET INTELLIGENCE
# ==========================================

display(Markdown("# 📊 IDX Market Intelligence Dashboard"))

display(
    Markdown(
        """
Dashboard sederhana untuk membaca data
Top Gainers dan Economic Calendar
dari Bursa Efek Indonesia.
"""
    )
)

# ==================================================
# ECONOMIC CALENDAR
# ==================================================

display(Markdown("## 🗓️ Economic Calendar"))

economic_data = extract_list(
    economic_calendar_raw
)

if len(economic_data) > 0:

    try:

        df_economic = pd.json_normalize(
            economic_data
        )

        display(
            Markdown(
                f"Jumlah agenda ekonomi yang berhasil ditampilkan: **{len(df_economic)} agenda**"
            )
        )

        display(df_economic.head(20))

    except Exception as e:

        print(
            f"❌ Gagal mengolah Economic Calendar: {e}"
        )

else:

    display(
        Markdown(
            "Tidak ada data Economic Calendar."
        )
    )


# ==================================================
# TOP GAINERS
# ==================================================

display(Markdown("---"))
display(Markdown("## 🚀 Top Gainers Market"))

gainer_data = extract_list(
    market_mover_raw
)

if len(gainer_data) > 0:

    try:

        df_gainer = pd.json_normalize(
            gainer_data
        )

        display(
            Markdown(
                f"Jumlah saham top gainer yang berhasil ditampilkan: **{len(df_gainer)} saham**"
            )
        )

        preferred_columns = [
            col for col in df_gainer.columns
            if any(
                keyword in col.lower()
                for keyword in [
                    "symbol",
                    "name",
                    "price",
                    "change",
                    "percent",
                    "volume",
                    "value"
                ]
            )
        ]

        if len(preferred_columns) > 0:
            display(
                df_gainer[
                    preferred_columns
                ].head(20)
            )
        else:
            display(
                df_gainer.head(20)
            )

        # Ringkasan Pasar

        display(Markdown("### 📈 Ringkasan Market"))

        total_stocks = len(df_gainer)

        display(
            Markdown(
                f"""
- Total saham yang masuk daftar top gainer: **{total_stocks} saham**
- Data menunjukkan saham dengan kenaikan harga tertinggi pada periode perdagangan terbaru.
- Data dapat digunakan untuk memantau momentum pasar dan minat investor.
"""
            )
        )

    except Exception as e:

        print(
            f"❌ Gagal mengolah Top Gainer: {e}"
        )

else:

    display(
        Markdown(
            "Tidak ada data Top Gainer."
        )
    )

display(Markdown("---"))
display(Markdown("✅ Dashboard berhasil dibuat"))
Explanation
Cell 5 is the final part of the notebook. This cell builds the main dashboard called IDX Market Intelligence Dashboard.
The dashboard is designed to display two main datasets:
Economic Calendar
Top Gainers Market
The first section displays the Economic Calendar data. The notebook uses extract_list() to extract the economic data from the raw API response. If data is available, it converts the result into a dataframe using pd.json_normalize() and displays the first 20 records.
If the Economic Calendar data is empty, the dashboard will show:
Tidak ada data Economic Calendar.The second section displays the Top Gainers Market data. The notebook extracts the top gainer data from market_mover_raw, then converts it into a dataframe.
The code also selects important columns related to:
symbol
name
price
change
percent
volume
value
This makes the dashboard easier to read because it focuses only on the most relevant market information.
After displaying the Top Gainers table, the notebook creates a simple Market Summary. This summary explains the total number of stocks included in the top gainer list and describes how the data can be used to monitor market momentum and investor interest.
At the end of the cell, the notebook displays:
✅ Dashboard berhasil dibuatThis confirms that the Market Intelligence Dashboard has been successfully generated.
Top Gainers Market Section
The notebook:
Extracts top gainer data.
Converts API responses into a dataframe.
Displays the number of top-performing stocks.
Shows important market metrics.
These metrics may include:
Stock symbols.
Company names.
Price information.
Percentage gain.
Trading volume.
Trading value.
Market Summary
The dashboard also generates a simple market summary highlighting overall market momentum based on the available top gainer data.
RESULT
The final dashboard produces two market intelligence datasets:
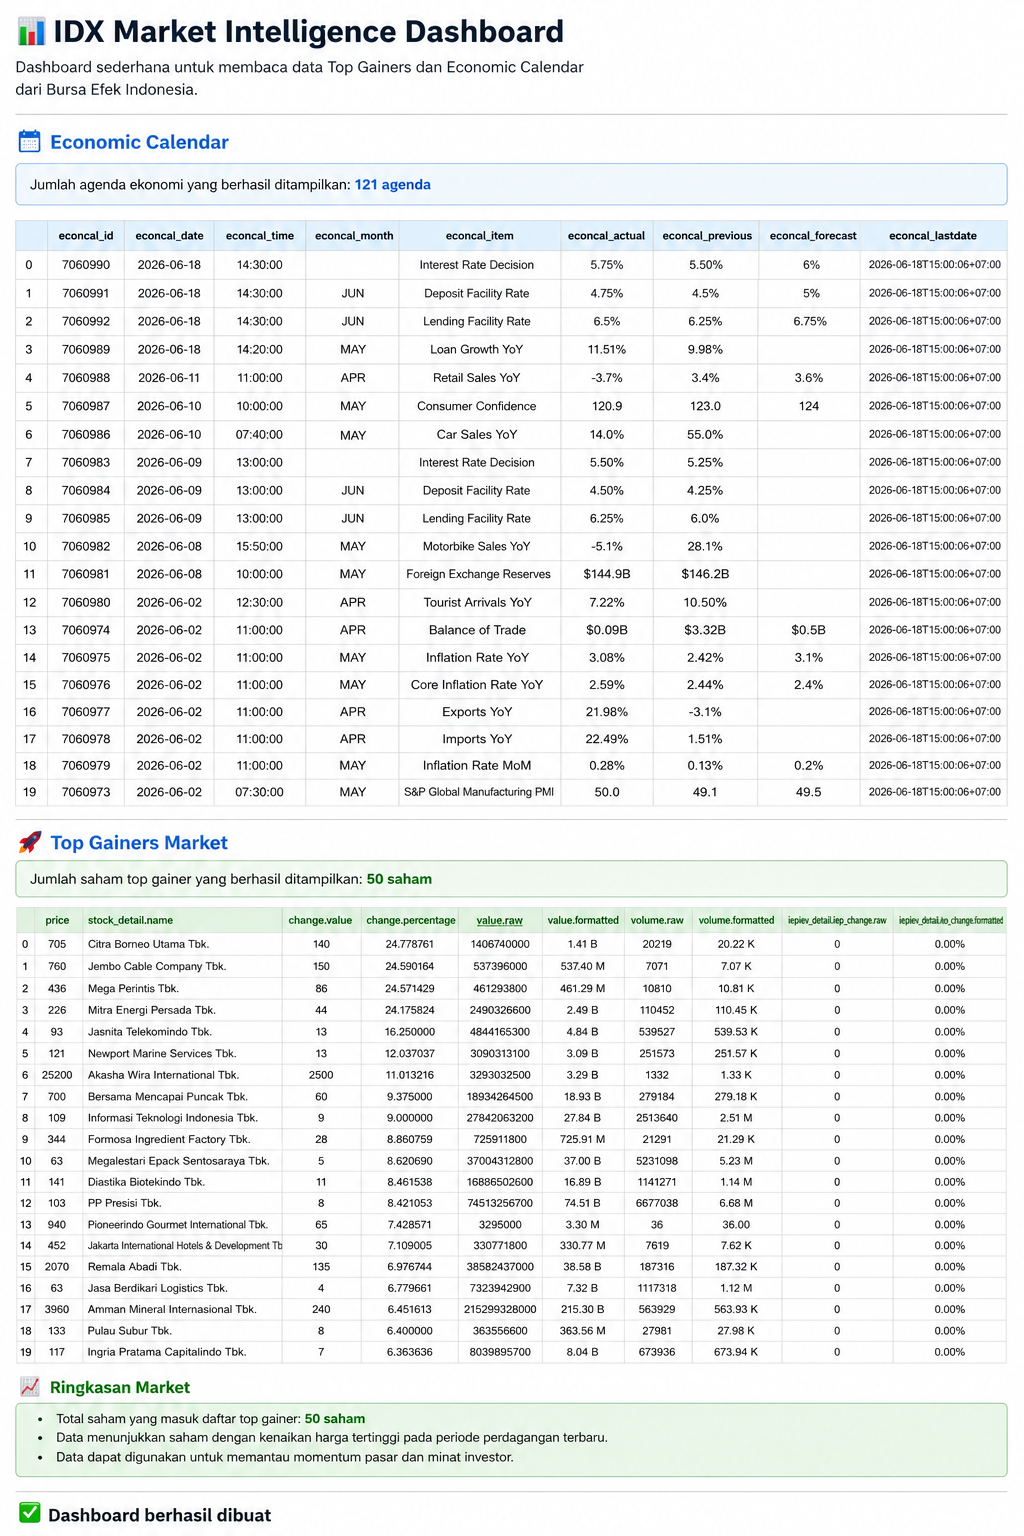
Economic Calendar
Displays upcoming economic events that may affect market sentiment and investor behavior.
Top Gainers Market
Displays stocks with the highest positive price movement and strongest momentum during the selected trading period.
Together, these datasets provide a broader perspective on both macroeconomic developments and stock market performance.
OVERALL WORKFLOW
This notebook follows a simple market intelligence workflow.
First, it imports the required Python libraries.
Second, it configures API authentication using RapidAPI headers.
Third, it creates reusable helper functions for API communication and data extraction.
Fourth, it retrieves data from Economic Calendar and Top Gainers Market endpoints.
Fifth, it processes and displays both datasets inside a unified market intelligence dashboard.
Finally, it generates summary information that helps investors quickly interpret market conditions.
WHY THIS CASE MATTERS
Investors do not only need stock price information.
They also need to understand economic developments that may influence market behavior.
Economic Calendar data helps investors monitor:
Economic releases.
Policy announcements.
Market-moving events.
Meanwhile, Top Gainers data helps investors identify:
Strong momentum stocks.
Increased buying activity.
Emerging market opportunities.
By combining both APIs, investors gain a more complete understanding of market conditions from both macroeconomic and price-performance perspectives.
This creates a stronger foundation for market monitoring and investment research.
CONCLUSION
This tutorial demonstrates how to build an Economic Calendar & Top Gainers Market Intelligence workflow using Python.
The notebook retrieves economic event data, collects top-performing stock information, handles API responses, normalizes data structures, and presents the results in a structured dashboard.
The final workflow provides:
Economic event monitoring.
Top gainer tracking.
Market momentum analysis.
Market intelligence reporting.
Investor decision support.
Ultimately, this project is not only about calling two APIs.
It is about transforming economic and market data into actionable intelligence that helps investors better understand market conditions and identify potential opportunities.