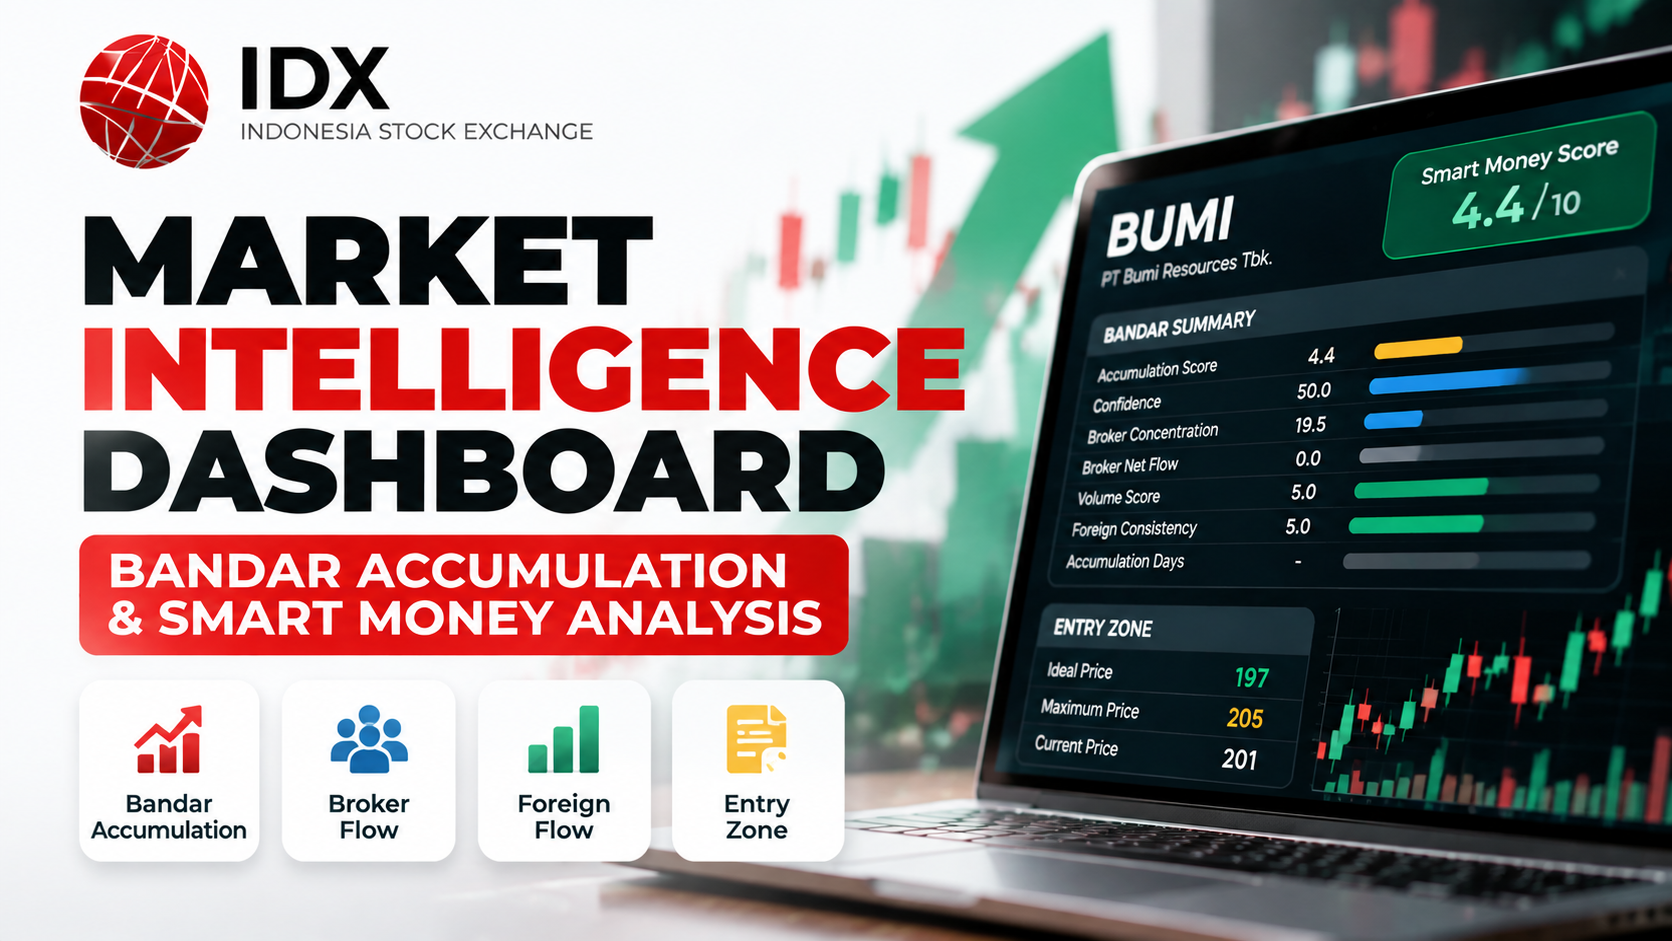
Understanding institutional activity and smart money movement is an important aspect of stock market analysis. Price movement alone does not always describe the behavior of large market participants. Accumulation patterns, broker concentration, foreign flow consistency, and volume confirmation can provide additional information regarding market participation.
This project develops an IDX Market Intelligence Dashboard using IDX RapidAPI data to analyze bandar accumulation and generate a smart money assessment. The system retrieves stock accumulation data, processes JSON responses, calculates smart money scores, evaluates entry zones, and provides an automated interpretation dashboard.
The analysis workflow consists of five main stages:
IDX API configuration
Bandar accumulation data retrieval
JSON data processing
Market overview and commodity impact monitoring
Smart money dashboard generation
The system is developed using Python with Requests for API communication, Pandas for data processing, NumPy for numerical calculation, and Matplotlib/Seaborn for visualization. The project structure consists of a maximum of five analysis cells.
Cell 1 — Import Library and API Configuration
The first cell prepares the analysis environment and creates the API connection. The get_api() function is used as a reusable function to retrieve IDX market data from different endpoints.
# ==============================
# IDX MARKET ANALYSIS PROJECT
# Max 5 Cells
# ==============================

import requests
import pandas as pd
import numpy as np
import matplotlib.pyplot as plt
import seaborn as sns
from datetime import datetime


# API Configuration

API_HOST = "indonesia-stock-exchange-idx.p.rapidapi.com"


HEADERS = {
    "x-rapidapi-host": API_HOST,
    "x-rapidapi-key": "YOUR_API_KEY"
}


BASE_URL = "https://indonesia-stock-exchange-idx.p.rapidapi.com"


def get_api(endpoint, params=None):

    url = BASE_URL + endpoint


    response = requests.get(
        url,
        headers=HEADERS,
        params=params
    )


    if response.status_code == 200:

        return response.json()

    else:

        print("ERROR:", response.status_code)

        return None
Cell 2 — Bandar Accumulation Analysis
The second cell retrieves bandar accumulation data for the selected stock. In this analysis, the system uses BUMI as the sample stock and retrieves 30 days of accumulation data.
# ==============================
# BANDAR ACCUMULATION ANALYSIS
# ==============================


symbol = "BUMI"


bandar_data = get_api(

    f"/api/analysis/bandar/accumulation/{symbol}",

    {
        "days":30
    }

)


bandar_data
Cell 3 — Convert Data and Accumulation Processing
The third cell converts API JSON responses into a structured DataFrame. The flatten_json() function allows nested JSON data to be transformed into a table format for analysis.
# ==============================
# PROCESS BANDAR DATA
# ==============================


def flatten_json(data):

    if isinstance(data, dict):

        return pd.json_normalize(data)


    elif isinstance(data,list):

        return pd.DataFrame(data)


bandar_df = flatten_json(

    bandar_data

)


print(

    "Jumlah Data :",

    bandar_df.shape

)


bandar_df.head()
Cell 4 — Market Morning Briefing and Commodity Impact
The fourth cell retrieves market overview information and commodity impact data. These datasets provide additional market context that can support the smart money interpretation.
# ==============================
# MARKET OVERVIEW
# ==============================


morning = get_api(

    "/api/main/morning-briefing"

)


commodity = get_api(

    "/api/main/commodities-impact"

)


print(
    "===== MORNING BRIEFING ====="
)


print(

    pd.json_normalize(morning)

)


print(
    "\n===== COMMODITY IMPACT ====="
)


print(

    pd.json_normalize(commodity)

)
Cell 5 — IDX Market Intelligence Dashboard Final Analysis Engine
The fifth cell is the main analysis engine. It generates the complete dashboard by extracting bandar indicators, calculating smart money scores, creating visualization, evaluating entry zones, and producing final interpretation.
The dashboard evaluates several indicators:
Accumulation Score
Confidence Level
Broker Concentration
Broker Net Flow
Volume Score
Foreign Flow Consistency
Accumulation Days
# ============================================================
# IDX MARKET INTELLIGENCE DASHBOARD
# CELL 5 - FINAL ANALYSIS ENGINE
# ============================================================


print("="*65)

print("IDX MARKET INTELLIGENCE DASHBOARD")

print("="*65)


print(

    "Tanggal Analisa:",

    datetime.now()

)


print(

    "\nStock:",

    symbol

)


# ============================================================
# LOAD BANDAR DATA
# ============================================================


if 'bandar_df' not in globals():

    raise Exception(

        "bandar_df belum tersedia. Jalankan Cell 2-3 terlebih dahulu."

    )


data = bandar_df.iloc[0]


# ============================================================
# BANDAR SUMMARY
# ============================================================


metrics = {


    "Accumulation Score":

        data.get(

            "data.accumulation_score",

            np.nan

        ),


    "Confidence":

        data.get(

            "data.confidence",

            np.nan

        ),


    "Broker Concentration (%)":

        data.get(

            "data.indicators.broker_concentration.concentration_percentage",

            np.nan

        ),


    "Broker Net Flow":

        data.get(

            "data.indicators.broker_concentration.net_flow",

            np.nan

        ),


    "Volume Score":

        data.get(

            "data.indicators.volume_pattern.score",

            np.nan

        ),


    "Foreign Consistency":

        data.get(

            "data.indicators.foreign_flow.consistency_score",

            np.nan

        ),


    "Accumulation Days":

        data.get(

            "data.accumulation_days",

            np.nan

        )

}


summary_df = pd.DataFrame(

    list(metrics.items()),

    columns=[

        "Indicator",

        "Value"

    ]

)


print(

    "\n===== BANDAR SUMMARY ====="

)


display(summary_df)


# ============================================================
# VISUALIZATION
# ============================================================


chart_df = summary_df.dropna()


plt.figure(

    figsize=(10,5)

)


plt.barh(

    chart_df["Indicator"],

    chart_df["Value"]

)


plt.title(

    f"{symbol} - Smart Money Indicator"

)


plt.xlabel(

    "Score / Value"

)


plt.grid(

    axis="x"

)


plt.show()
Smart Money Score Calculation
The system calculates a composite smart money score using three main components:
Accumulation score weight: 50%
Volume score weight: 30%
Foreign flow consistency weight: 20%
The resulting score is classified into four conditions:
Strong Accumulation
Accumulation
Early Observation
Distribution
# ============================================================
# SMART MONEY SCORE ENGINE
# ============================================================


acc_score = data.get(

    "data.accumulation_score",

    0

)


volume_score = data.get(

    "data.indicators.volume_pattern.score",

    0

)


foreign_score = data.get(

    "data.indicators.foreign_flow.consistency_score",

    0

)


smart_money_score = (

    acc_score * 0.5

    +

    volume_score * 0.3

    +

    foreign_score * 0.2

)


print(

    "\n===== SMART MONEY ANALYSIS ====="

)


print(

    f"Smart Money Score : {smart_money_score:.2f} / 10"

)


if smart_money_score >= 7:

    status = "STRONG ACCUMULATION"


elif smart_money_score >= 5:

    status = "ACCUMULATION"


elif smart_money_score >= 3:

    status = "EARLY OBSERVATION"


else:

    status = "DISTRIBUTION"


print(

    "Status:",

    status

)
Entry Zone Analysis
The dashboard also evaluates the stock entry zone by comparing current price, ideal price, and maximum price levels. The system calculates the distance between current price and ideal price to provide additional price positioning information.
# ============================================================
# ENTRY ZONE ANALYSIS
# ============================================================


entry_df = pd.DataFrame(

    [

        [

            "Ideal Price",

            data.get(

                "data.entry_zone.ideal_price"

            )

        ],


        [

            "Maximum Price",

            data.get(

                "data.entry_zone.max_price"

            )

        ],


        [

            "Current Price",

            data.get(

                "data.entry_zone.current_price"

            )

        ]

    ],

    columns=[

        "Parameter",

        "Value"

    ]

)


display(entry_df)
Conclusion
This project successfully develops an IDX Market Intelligence Dashboard using IDX RapidAPI data to evaluate bandar accumulation and smart money conditions.
The system integrates accumulation indicators, broker concentration, volume confirmation, foreign flow consistency, and price entry zone analysis into a structured dashboard.
The smart money scoring engine converts multiple market indicators into a simplified classification system, allowing users to identify potential accumulation, observation, or distribution conditions.
However, bandar accumulation analysis should not be considered a standalone trading signal. The dashboard itself highlights that additional validation is required, including price trend, volume breakout, fundamental analysis, valuation, and market sentiment.
Overall, this IDX Market Intelligence Dashboard demonstrates how API-based financial data processing can transform complex market participant activity into a systematic analytical framework for stock market monitoring.