
An IDX Insider Trading Dashboard provides a structured way to monitor insider activity while connecting it with fundamental chart data.
This project uses three endpoints: getInsiderTradingBySymbol, getAllInsiderTrading, and getFundachart. Insider trading data covers November 1 to December 31, 2025, while Fundachart retrieves one-year data for BBCA and TLKM using item 2661.
The complete notebook consists of five cells covering API configuration, requests, normalization, detailed data inspection, and the final dashboard.
Cell 1 — Setup and API Configuration
# ============================================================
# CELL 1 — SETUP & KONFIGURASI API
# ============================================================

import requests
import pandas as pd
import numpy as np
import time
from datetime import datetime
from IPython.display import display

# ------------------------------------------------------------
# RAPIDAPI CONFIG
# ------------------------------------------------------------

RAPIDAPI_KEY = "YOUR_RAPIDAPI_KEY"

BASE_URL = "https://indonesia-stock-exchange-idx.p.rapidapi.com"

HEADERS = {
    "Content-Type": "application/json",
    "x-rapidapi-host": "indonesia-stock-exchange-idx.p.rapidapi.com",
    "x-rapidapi-key": RAPIDAPI_KEY
}

# ------------------------------------------------------------
# ENDPOINT
# ------------------------------------------------------------

ENDPOINT_INSIDER_SYMBOL = "/api/emiten/BBCA/insider"
ENDPOINT_ALL_INSIDER = "/api/emiten/insider"
ENDPOINT_FUNDACHART = "/api/emiten/fundachart"

# ------------------------------------------------------------
# PARAMETER
# ------------------------------------------------------------

PARAMS_INSIDER_SYMBOL = {
    "date_end": "2025-12-31",
    "date_start": "2025-11-01",
    "limit": 20,
    "source_type": "SOURCE_TYPE_UNSPECIFIED",
    "action_type": "ACTION_TYPE_UNSPECIFIED",
    "page": 1
}

PARAMS_ALL_INSIDER = {
    "source_type": "SOURCE_TYPE_UNSPECIFIED",
    "page": 1,
    "limit": 20,
    "symbols": "BBCA,BUMI,TLKM",
    "date_end": "2025-12-31",
    "date_start": "2025-11-01",
    "action_type": "ACTION_TYPE_UNSPECIFIED"
}

PARAMS_FUNDACHART = {
    "companies": "BBCA,TLKM",
    "timeframe": "1y",
    "item": 2661
}

print("=" * 100)
print("IDX INSIDER TRADING & FUNDACHART PROJECT")
print("=" * 100)
print("Konfigurasi API berhasil disiapkan.")
print()
print("Endpoint:")
print("1.", ENDPOINT_INSIDER_SYMBOL)
print("2.", ENDPOINT_ALL_INSIDER)
print("3.", ENDPOINT_FUNDACHART)
Cell 1 prepares the libraries, RapidAPI configuration, three endpoints, and their original parameters. The only change from the uploaded notebook is replacing the private API key with YOUR_RAPIDAPI_KEY.
Cell 2 — Request Data from Three Endpoints
# ============================================================
# CELL 2 — REQUEST DATA DARI 3 ENDPOINT
# ============================================================

def request_api(name, endpoint, params=None):
    url = BASE_URL + endpoint

    print("\n" + "=" * 100)
    print(name)
    print("-" * 100)
    print("Endpoint    :", endpoint)

    try:
        response = requests.get(
            url,
            headers=HEADERS,
            params=params,
            timeout=30
        )

        print("Request URL :", response.url)
        print("Status      :", response.status_code)

        try:
            data = response.json()
        except Exception:
            data = {
                "success": False,
                "message": "Response bukan JSON",
                "raw": response.text[:1000]
            }

        success = (
            response.status_code == 200 and
            isinstance(data, (dict, list))
        )

        print("Success     :", success)

        if isinstance(data, dict):
            message = (
                data.get("message")
                or data.get("error")
                or ("Request berhasil" if success else "Request gagal")
            )
        else:
            message = "Request berhasil" if success else "Request gagal"

        print("Pesan       :", message)

        return data

    except requests.exceptions.Timeout:
        print("Status      : TIMEOUT")
        print("Success     : False")
        print("Pesan       : Request melebihi batas waktu.")
        return {
            "success": False,
            "message": "Request timeout",
            "data": None
        }

    except requests.exceptions.RequestException as e:
        print("Status      : ERROR")
        print("Success     : False")
        print("Pesan       :", str(e))
        return {
            "success": False,
            "message": str(e),
            "data": None
        }


# ------------------------------------------------------------
# 1. INSIDER TRADING BY SYMBOL
# ------------------------------------------------------------

insider_symbol_raw = request_api(
    "getInsiderTradingBySymbol",
    ENDPOINT_INSIDER_SYMBOL,
    PARAMS_INSIDER_SYMBOL
)

print("\n⏳ Jeda 5 detik sebelum request berikutnya...")
time.sleep(5)


# ------------------------------------------------------------
# 2. ALL INSIDER TRADING
# ------------------------------------------------------------

all_insider_raw = request_api(
    "getAllInsiderTrading",
    ENDPOINT_ALL_INSIDER,
    PARAMS_ALL_INSIDER
)

print("\n⏳ Jeda 5 detik sebelum request berikutnya...")
time.sleep(5)


# ------------------------------------------------------------
# 3. FUNDACHART
# ------------------------------------------------------------

fundachart_raw = request_api(
    "getFundachart",
    ENDPOINT_FUNDACHART,
    PARAMS_FUNDACHART
)

print("\n" + "=" * 100)
print("SELURUH REQUEST SELESAI")
print("=" * 100)
Cell 2 sends requests to all three endpoints with a 30-second timeout and a five-second delay between calls. It also handles invalid JSON, timeouts, and request errors.
Cell 3 — Normalize Insider Trading and Fundachart Data
# ============================================================
# CELL 3 — NORMALISASI DATA SESUAI STRUKTUR API
# ============================================================

def extract_movement(response):
    """
    Struktur Insider API:
    {
        "success": True,
        "data": {
            "is_more": False,
            "movement": [...]
        }
    }
    """

    if not isinstance(response, dict):
        return []

    data = response.get("data", {})

    if not isinstance(data, dict):
        return []

    movement = data.get("movement", [])

    return movement if isinstance(movement, list) else []


def extract_fundachart(response):
    """
    Struktur Fundachart:
    data -> company -> ratios -> chart_data
    """

    records = []

    if not isinstance(response, dict):
        return records

    data = response.get("data", [])

    if isinstance(data, dict):
        data = [data]

    if not isinstance(data, list):
        return records

    for company in data:

        if not isinstance(company, dict):
            continue

        company_id = company.get("company_id")
        company_name = company.get("company_name", "-")

        ratios = company.get("ratios", [])

        if not isinstance(ratios, list):
            continue

        for ratio in ratios:

            if not isinstance(ratio, dict):
                continue

            item_id = ratio.get("item_id")
            item_name = ratio.get("item_name", "-")
            suffix = ratio.get("suffix", "")

            chart_data = ratio.get("chart_data", [])

            if not isinstance(chart_data, list):
                continue

            for point in chart_data:

                if not isinstance(point, dict):
                    continue

                records.append({
                    "company_id": company_id,
                    "company_name": company_name,
                    "item_id": item_id,
                    "item_name": item_name,
                    "date": point.get("date"),
                    "formatted_date": point.get("formated_date"),
                    "value": point.get("value"),
                    "ratio_value": point.get("ratio_value"),
                    "suffix": suffix
                })

    return records


# ============================================================
# NORMALISASI INSIDER
# ============================================================

insider_symbol_records = extract_movement(insider_symbol_raw)
all_insider_records = extract_movement(all_insider_raw)

insider_symbol_df = pd.json_normalize(insider_symbol_records)
all_insider_df = pd.json_normalize(all_insider_records)


# ============================================================
# NORMALISASI FUNDACHART
# ============================================================

fundachart_records = extract_fundachart(fundachart_raw)

fundachart_df = pd.DataFrame(fundachart_records)


# ============================================================
# HASIL NORMALISASI
# ============================================================

print("=" * 100)
print("HASIL NORMALISASI")
print("=" * 100)

print(
    "Insider Trading BBCA Records :",
    len(insider_symbol_df)
)

print(
    "All Insider Trading Records  :",
    len(all_insider_df)
)

print(
    "Fundachart Price Records      :",
    len(fundachart_df)
)


# ============================================================
# STATUS MOVEMENT
# ============================================================

print("\n" + "=" * 100)
print("STATUS DATA INSIDER")
print("=" * 100)

if len(insider_symbol_df) == 0:
    print(
        "BBCA Insider : API berhasil, "
        "tetapi movement kosong."
    )
else:
    print(
        "BBCA Insider :",
        len(insider_symbol_df),
        "transaksi"
    )


if len(all_insider_df) == 0:
    print(
        "All Insider  : API berhasil, "
        "tetapi movement kosong."
    )
else:
    print(
        "All Insider  :",
        len(all_insider_df),
        "transaksi"
    )


# ============================================================
# FUNDACHART COMPANY
# ============================================================

print("\n" + "=" * 100)
print("FUNDACHART COMPANY")
print("=" * 100)

if not fundachart_df.empty:

    summary_company = (
        fundachart_df
        .groupby("company_name")
        .size()
        .reset_index(name="records")
    )

    for _, row in summary_company.iterrows():
        print(
            f"{row['company_name']:<8} : "
            f"{row['records']} price records"
        )

else:
    print("Fundachart kosong.")
Cell 3 follows the actual response structures. Insider data is extracted from data → movement, while Fundachart traverses company, ratios, and chart_data before converting the results into DataFrames.
It then reports the normalized record counts and Fundachart records available for each company.
Cell 4 — Display the Complete Normalized Data
# ============================================================
# CELL 4 — TAMPILKAN DATA HASIL NORMALISASI
# ============================================================

print("=" * 100)
print("INSIDER TRADING — BBCA")
print("=" * 100)

if not insider_symbol_df.empty:

    print("Jumlah Transaksi :", len(insider_symbol_df))
    print("Kolom            :", insider_symbol_df.columns.tolist())

    display(
        insider_symbol_df.head(20)
    )

else:

    print("Jumlah Transaksi : 0")
    print()
    print(
        "Tidak ditemukan transaksi insider BBCA "
        "pada periode 01-11-2025 s/d 31-12-2025."
    )


print("\n\n" + "=" * 100)
print("ALL INSIDER TRADING — BBCA, BUMI, TLKM")
print("=" * 100)

if not all_insider_df.empty:

    print("Jumlah Transaksi :", len(all_insider_df))
    print("Kolom            :", all_insider_df.columns.tolist())

    display(
        all_insider_df.head(20)
    )

else:

    print("Jumlah Transaksi : 0")
    print()
    print(
        "Tidak ditemukan transaksi insider "
        "BBCA, BUMI, dan TLKM "
        "pada periode 01-11-2025 s/d 31-12-2025."
    )


print("\n\n" + "=" * 100)
print("FUNDACHART — BBCA & TLKM")
print("=" * 100)

if not fundachart_df.empty:

    print("Jumlah Price Records :", len(fundachart_df))

    print(
        "Perusahaan           :",
        ", ".join(
            fundachart_df["company_name"]
            .dropna()
            .astype(str)
            .unique()
        )
    )

    print(
        "Item                 :",
        ", ".join(
            fundachart_df["item_name"]
            .dropna()
            .astype(str)
            .unique()
        )
    )

    display(
        fundachart_df[
            [
                "company_name",
                "item_name",
                "formatted_date",
                "value"
            ]
        ].tail(20)
    )

else:

    print("Tidak ada data Fundachart.")
Cell 4 displays up to 20 insider transactions and the latest Fundachart records. Empty insider datasets are clearly reported for the selected November–December 2025 period.
Cell 5 — IDX Insider Trading and Fundamental Dashboard
# ============================================================
# CELL 5 — IDX INSIDER & FUNDAMENTAL DASHBOARD
# ============================================================

def rupiah(value):

    try:
        return f"Rp {float(value):,.0f}".replace(",", ".")
    except:
        return "-"


def percent(value):

    try:
        return f"{float(value):+.2f}%"
    except:
        return "-"


print("=" * 100)
print("IDX INSIDER TRADING & FUNDAMENTAL DASHBOARD")
print("=" * 100)


# ============================================================
# INSIDER TRADING BBCA
# ============================================================

print("\n👤 INSIDER TRADING — BBCA")
print("-" * 100)

print(
    "Periode      : 01-11-2025 s/d 31-12-2025"
)

print(
    "Transaksi    :",
    len(insider_symbol_df)
)

if insider_symbol_df.empty:

    print(
        "Status       : Tidak ada movement / "
        "transaksi insider"
    )

else:

    print("Status       : Data tersedia")

    display(
        insider_symbol_df.head(10)
    )


# ============================================================
# ALL INSIDER
# ============================================================

print("\n\n📊 ALL INSIDER TRADING — BBCA, BUMI, TLKM")
print("-" * 100)

print(
    "Periode      : 01-11-2025 s/d 31-12-2025"
)

print(
    "Transaksi    :",
    len(all_insider_df)
)

if all_insider_df.empty:

    print(
        "Status       : Tidak ada movement / "
        "transaksi insider"
    )

else:

    print("Status       : Data tersedia")

    display(
        all_insider_df.head(10)
    )


# ============================================================
# FUNDACHART
# ============================================================

print("\n\n📈 FUNDACHART — PRICE PERFORMANCE")
print("-" * 100)

if not fundachart_df.empty:

    companies = (
        fundachart_df["company_name"]
        .dropna()
        .unique()
    )

    for company in companies:

        company_data = (
            fundachart_df[
                fundachart_df["company_name"] == company
            ]
            .copy()
        )

        company_data = company_data.sort_values(
            "formatted_date"
        )

        if company_data.empty:
            continue

        first_row = company_data.iloc[0]
        last_row = company_data.iloc[-1]

        first_price = first_row["value"]
        last_price = last_row["value"]

        try:

            change = last_price - first_price

            change_pct = (
                change / first_price * 100
                if first_price != 0
                else 0
            )

        except:

            change = 0
            change_pct = 0

        highest = company_data["value"].max()
        lowest = company_data["value"].min()

        print(f"\n🏢 {company}")

        print(
            f"   Periode       : "
            f"{first_row['formatted_date']} "
            f"s/d {last_row['formatted_date']}"
        )

        print(
            f"   Harga Awal    : "
            f"{rupiah(first_price)}"
        )

        print(
            f"   Harga Terakhir: "
            f"{rupiah(last_price)}"
        )

        print(
            f"   Perubahan     : "
            f"{rupiah(change)} "
            f"({percent(change_pct)})"
        )

        print(
            f"   Tertinggi     : "
            f"{rupiah(highest)}"
        )

        print(
            f"   Terendah      : "
            f"{rupiah(lowest)}"
        )

        print(
            f"   Jumlah Data   : "
            f"{len(company_data)}"
        )

else:

    print("Tidak ada data Fundachart.")


# ============================================================
# PERBANDINGAN BBCA VS TLKM
# ============================================================

print("\n\n" + "=" * 100)
print("PERBANDINGAN PERFORMA FUNDACHART")
print("=" * 100)

performance = []

if not fundachart_df.empty:

    for company in fundachart_df["company_name"].unique():

        df_company = (
            fundachart_df[
                fundachart_df["company_name"] == company
            ]
            .sort_values("formatted_date")
        )

        if df_company.empty:
            continue

        first_price = df_company.iloc[0]["value"]
        last_price = df_company.iloc[-1]["value"]

        try:

            change_pct = (
                (last_price - first_price)
                / first_price
                * 100
            )

        except:

            change_pct = 0

        performance.append({
            "company": company,
            "first": first_price,
            "last": last_price,
            "change_pct": change_pct
        })


for item in performance:

    print(
        f"{item['company']:<8} | "
        f"{rupiah(item['first']):>12} → "
        f"{rupiah(item['last']):>12} | "
        f"{percent(item['change_pct']):>9}"
    )


# ============================================================
# RINGKASAN
# ============================================================

print("\n\n" + "=" * 100)
print("RINGKASAN")
print("=" * 100)

print(
    f"👤 Insider Trading BBCA      : "
    f"{len(insider_symbol_df)} transaksi"
)

print(
    f"📊 All Insider Trading       : "
    f"{len(all_insider_df)} transaksi"
)

print(
    f"📈 Fundachart Price Records  : "
    f"{len(fundachart_df)} record"
)


if insider_symbol_df.empty:
    insider_status = "Tidak ada movement"
else:
    insider_status = "Berhasil"


if all_insider_df.empty:
    all_status = "Tidak ada movement"
else:
    all_status = "Berhasil"


fundachart_status = (
    "Berhasil"
    if not fundachart_df.empty
    else "Tidak ada data"
)


print()
print(
    "Status Insider BBCA        :",
    insider_status
)

print(
    "Status All Insider         :",
    all_status
)

print(
    "Status Fundachart          :",
    fundachart_status
)


print(
    "\nSelesai diproses :",
    datetime.now().strftime("%d-%m-%Y %H:%M:%S")
)
Cell 5 creates the final dashboard without removing any of the original analysis logic. It summarizes BBCA insider activity, broader insider trading across BBCA, BUMI, and TLKM, and Fundachart price performance.
For Fundachart, the dashboard calculates the first and latest values, absolute and percentage changes, highest and lowest values, and the number of records for each company. It then compares BBCA and TLKM before producing the final status summary and timestamp.
Final Result
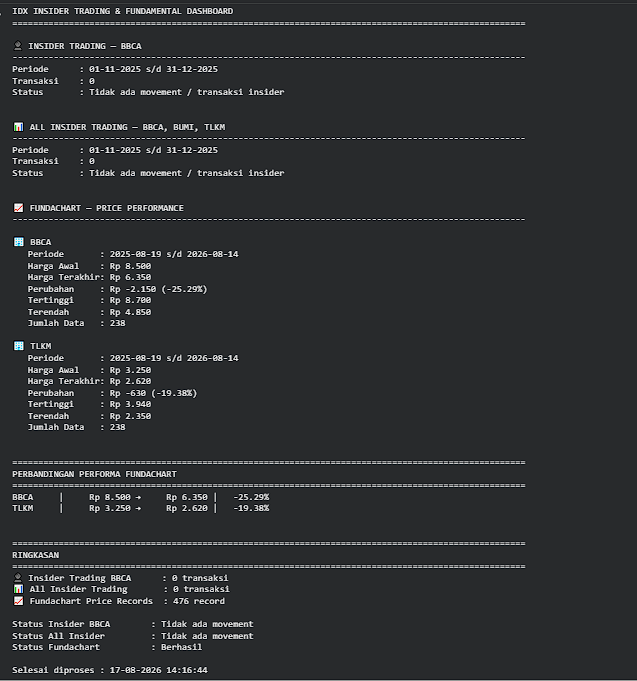
The completed IDX Insider Trading Dashboard combines three analysis components in one workflow: BBCA insider transactions, insider activity across BBCA, BUMI, and TLKM, and one-year Fundachart data for BBCA and TLKM.
The notebook also handles empty insider movements, normalizes nested API responses, calculates Fundachart performance, and produces a final comparison dashboard.
Conclusion
The IDX Insider Trading Dashboard demonstrates how Python and RapidAPI can combine insider activity and Fundachart data in a five-cell Google Colab project.
The workflow covers API requests, normalization, transaction inspection, price performance analysis, BBCA versus TLKM comparison, and a final dashboard while keeping the original notebook logic intact.