
Corporate actions are important events that can influence the number of shares outstanding, company capital structure, and investor perception. Because of this, many investors monitor corporate action schedules to stay informed about significant changes that may occur in listed companies.
Among the most frequently monitored corporate actions are Right Issues and Stock Splits. A Right Issue allows companies to raise additional capital by offering new shares to existing shareholders, while a Stock Split changes the number of shares outstanding without changing the company's overall value.
In this project, we build an IDX Corporate Action Calendar Dashboard using Python and data from the Indonesia Stock Exchange API. The dashboard combines Right Issue Calendar and Stock Split Calendar information into a single workflow, making it easier to monitor upcoming corporate actions from the Indonesian stock market.
CELL 1 — Import Library
# ==========================================
# CELL 1 : IMPORT LIBRARY
# ==========================================

import requests
import pandas as pd
import time

from IPython.display import display, Markdown

pd.set_option("display.max_columns", None)
pd.set_option("display.max_colwidth", 200)
Explanation
The project begins by importing the required libraries.
requests is used for API communication, pandas is used for data processing, and time is used to provide delays between requests when necessary.
The notebook also imports display and Markdown from IPython so the dashboard can present information in a more structured format.
Additionally, pandas display settings are configured so all columns can be shown and longer text values can be displayed more clearly.
CELL 2 — Konfigurasi API
# ==========================================
# CELL 2 : KONFIGURASI API
# ==========================================

BASE_URL = "https://indonesia-stock-exchange-idx.p.rapidapi.com"

HEADERS = {
    "x-rapidapi-key": "YOUR_API_KEY",
    "x-rapidapi-host": "indonesia-stock-exchange-idx.p.rapidapi.com",
    "Content-Type": "application/json"
}
Explanation
Cell 2 contains the API configuration.
The notebook defines the IDX API base URL and prepares the request headers required to communicate with the API.
These settings are used whenever the notebook requests data from the available endpoints.
CELL 3 — Helper Function
def extract_list(data):
    """
    Mengambil list dari struktur JSON API IDX
    """

    if isinstance(data, list):
        return data

    if not isinstance(data, dict):
        return []

    possible_keys = [
        "rightissue",
        "stocksplit",
        "data",
        "list",
        "items",
        "results",
        "calendar"
    ]

    def search_list(obj):
        if isinstance(obj, list):
            return obj

        if isinstance(obj, dict):
            for key in possible_keys:
                if key in obj:
                    result = search_list(obj[key])
                    if isinstance(result, list):
                        return result

        return []

    return search_list(data)
Explanation
Cell 3 creates a helper function called extract_list().
The function is responsible for extracting list-based data from IDX API responses. Because API responses can have different JSON structures, the function searches multiple possible keys such as:
rightissue
stocksplit
data
list
items
results
calendar
This allows the notebook to consistently retrieve list data that can later be processed into dataframes.
CELL 4 — Ambil Data
# ==========================================
# CELL 4 : AMBIL DATA
# ==========================================

print("Mengambil Right Issue Calendar...")

right_issue_raw = fetch_api(
    "/api/calendar/right-issue"
)

time.sleep(3)

print("Mengambil Stock Split Calendar...")

stock_split_raw = fetch_api(
    "/api/calendar/stock-split"
)

print("Selesai mengambil data.")
Explanation
Cell 4 retrieves data from two corporate action endpoints.
The notebook first requests Right Issue Calendar data from the IDX API.
After a short delay of three seconds, the notebook requests Stock Split Calendar data.
When both requests are completed, a confirmation message is displayed indicating that the retrieval process has finished successfully.
CELL 5 — Dashboard
# ==========================================
# CELL 5 : DASHBOARD
# ==========================================

display(Markdown("# 📊 IDX Corporate Action Calendar Dashboard"))

display(
    Markdown(
        "Dashboard sederhana untuk membaca data "
        "**Right Issue Calendar** dan "
        "**Stock Split Calendar** dari "
        "Bursa Efek Indonesia."
    )
)

# ==================================================
# RIGHT ISSUE
# ==================================================

display(Markdown("## 💰 Right Issue Calendar"))

try:

    right_issue_list = extract_list(right_issue_raw)

    df_right_issue = pd.json_normalize(
        right_issue_list,
        sep="_"
    )

    if not df_right_issue.empty:

        display(
            Markdown(
                f"Jumlah data Right Issue yang berhasil "
                f"ditampilkan: **{len(df_right_issue)} data**"
            )
        )

        cols = [
            c for c in df_right_issue.columns
            if any(
                k in c.lower()
                for k in [
                    "symbol",
                    "company",
                    "date",
                    "price",
                    "share",
                    "ratio"
                ]
            )
        ]

        if cols:
            display(df_right_issue[cols])
        else:
            display(df_right_issue.head(20))

        # Statistik sederhana

        display(
            Markdown(
                f"""
### 📈 Ringkasan Right Issue

- Total Data : **{len(df_right_issue)}**
- Total Kolom : **{len(df_right_issue.columns)}**
"""
            )
        )

    else:
        display(
            Markdown(
                "⚠️ Tidak ada data Right Issue."
            )
        )

except Exception as e:

    display(
        Markdown(
            f"❌ Gagal mengolah Right Issue: {e}"
        )
    )


# ==================================================
# STOCK SPLIT
# ==================================================

display(Markdown("---"))
display(Markdown("## ✂️ Stock Split Calendar"))

try:

    stock_split_list = extract_list(
        stock_split_raw
    )

    df_stock_split = pd.json_normalize(
        stock_split_list,
        sep="_"
    )

    if not df_stock_split.empty:

        display(
            Markdown(
                f"Jumlah data Stock Split yang berhasil "
                f"ditampilkan: **{len(df_stock_split)} data**"
            )
        )

        cols = [
            c for c in df_stock_split.columns
            if any(
                k in c.lower()
                for k in [
                    "symbol",
                    "company",
                    "date",
                    "ratio",
                    "share"
                ]
            )
        ]

        if cols:
            display(df_stock_split[cols])
        else:
            display(df_stock_split.head(20))

        display(
            Markdown(
                f"""
### 📊 Ringkasan Stock Split

- Total Data : **{len(df_stock_split)}**
- Total Kolom : **{len(df_stock_split.columns)}**
"""
            )
        )

    else:
        display(
            Markdown(
                "⚠️ Tidak ada data Stock Split."
            )
        )

except Exception as e:

    display(
        Markdown(
            f"❌ Gagal mengolah Stock Split: {e}"
        )
    )


# ==================================================
# KESIMPULAN
# ==================================================

display(Markdown("---"))

right_count = (
    len(df_right_issue)
    if "df_right_issue" in locals()
    else 0
)

split_count = (
    len(df_stock_split)
    if "df_stock_split" in locals()
    else 0
)

display(
    Markdown(
        f"""
# 📋 Kesimpulan Dashboard

| Corporate Action | Jumlah Data |
|-----------------|------------|
| Right Issue | {right_count} |
| Stock Split | {split_count} |

Dashboard ini membantu investor memonitor
agenda aksi korporasi yang berpotensi
mempengaruhi jumlah saham beredar,
harga saham, serta struktur modal perusahaan.
"""
    )
)
Explanation
Cell 5 builds the final IDX Corporate Action Calendar Dashboard.
This cell displays the dashboard title and explains that the dashboard reads Right Issue Calendar and Stock Split Calendar data from the Indonesia Stock Exchange.
The first section processes Right Issue Calendar data. It extracts the list from right_issue_raw, normalizes it into a dataframe, displays the number of Right Issue records, shows relevant columns when available, and provides a simple summary containing total data and total columns.
The second section processes Stock Split Calendar data. It extracts the list from stock_split_raw, normalizes it into a dataframe, displays the number of Stock Split records, shows relevant columns when available, and provides a simple summary containing total data and total columns.
The final section creates a conclusion table showing the number of Right Issue and Stock Split records. It also explains that the dashboard helps investors monitor corporate action agendas that may affect outstanding shares, stock prices, and company capital structure.
Result:
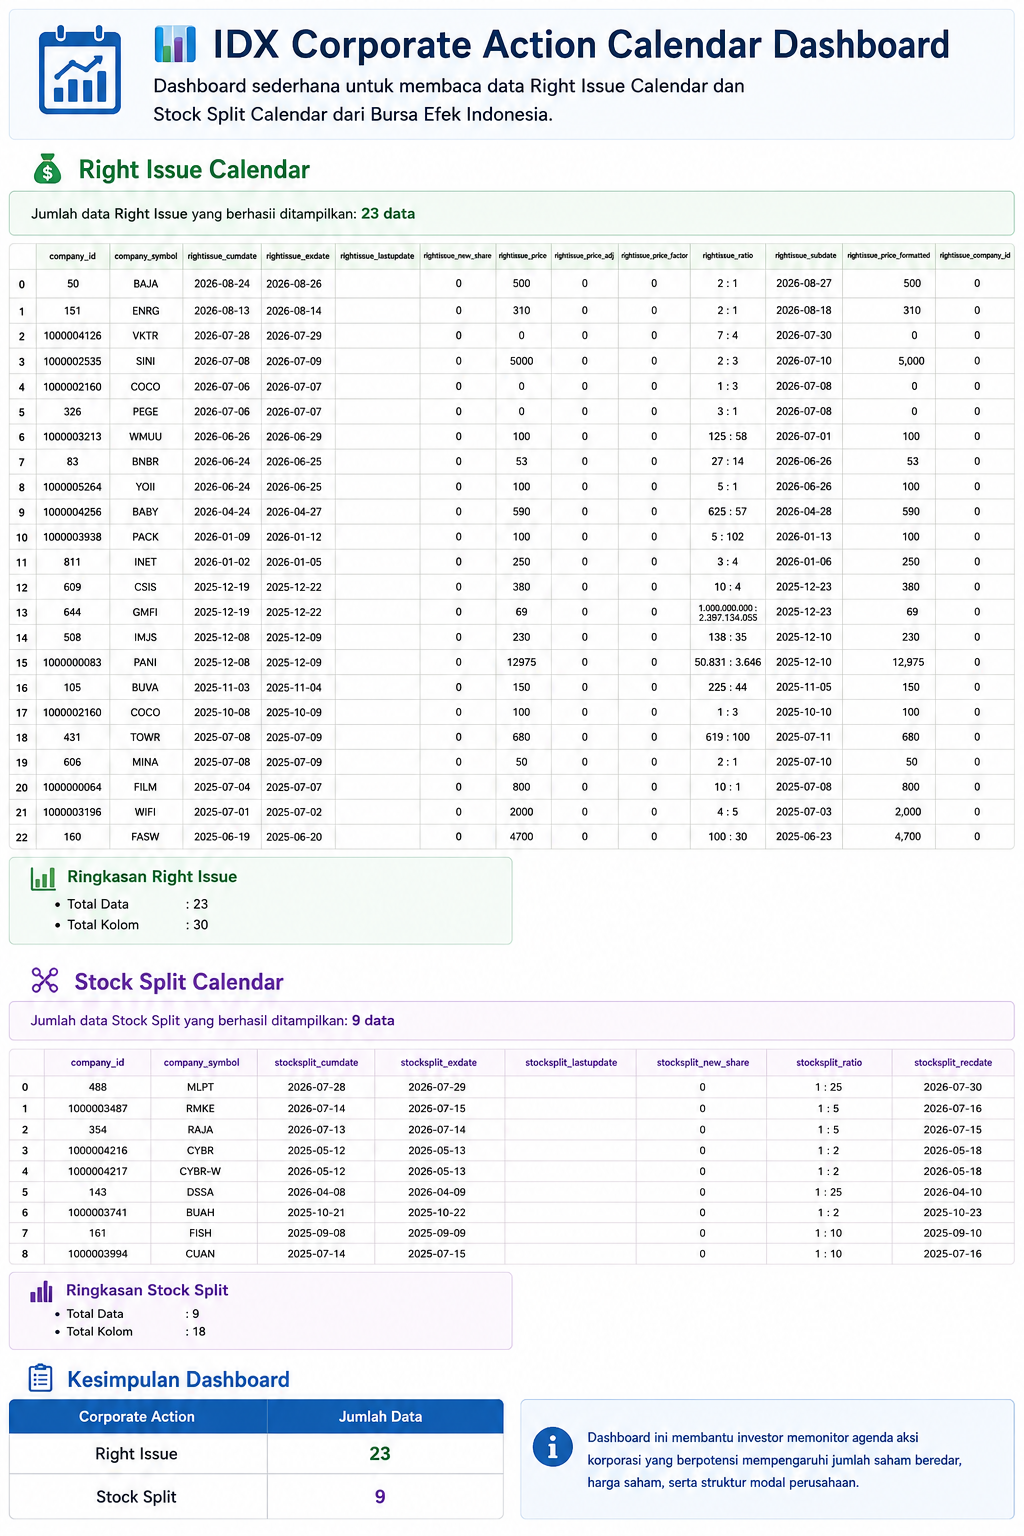
Dashboard
The dashboard finishes by displaying a summary table containing:
Corporate Action | Jumlah Data |
|---|---|
Right Issue | right_count |
Stock Split | split_count |
The dashboard then provides the following conclusion:
Dashboard ini membantu investor memonitor agenda aksi korporasi yang berpotensi mempengaruhi jumlah saham beredar, harga saham, serta struktur modal perusahaan.
Overall Workflow
The notebook starts by importing the required libraries and configuring API access.
Next, a helper function is created to extract list-based data from API responses.
The notebook then retrieves:
Right Issue Calendar data
Stock Split Calendar data
After the data is successfully retrieved, both datasets are converted into dataframes and displayed through a dashboard interface.
Finally, the notebook generates summary information and a dashboard conclusion to help users monitor corporate action schedules more effectively.
Why This Project Matters
Corporate actions can significantly influence how investors evaluate a company.
Right Issue schedules provide information about additional share issuance, while Stock Split schedules provide information about changes in the number of shares outstanding.
By combining both datasets into a single dashboard, investors can monitor important corporate action events from one place.
Conclusion
The IDX Corporate Action Calendar Dashboard combines Right Issue Calendar data and Stock Split Calendar data into a single dashboard.
The project helps users monitor corporate action schedules, view structured datasets, generate simple summaries, and gain a better understanding of upcoming events that may influence listed companies.