
INTRODUCTION
In stock analysis, price movement alone is not always enough.
A stock may rise sharply in one session, but without strong transaction activity, the move may not be meaningful. On the other hand, a stock may appear in the top transaction list, but that does not always mean it is showing strong upward momentum.
This is why combining market mover data and top stock transaction data can create a more useful screening workflow.
In this tutorial, we build an IDX active stock screener using Python. The goal is to identify stocks that are not only moving upward, but also active in market transactions.
The notebook combines two APIs:
getMarketMover
and
getTopStocks
getMarketMover is used to retrieve top gainers from the market mover endpoint. getTopStocks is used to retrieve stocks with strong transaction activity based on value, volume, and frequency. After retrieving both datasets, the notebook cleans the data, detects relevant columns, merges both datasets by ticker, calculates a combined_score, visualizes the Top 15 stocks, and exports the result.
Cell 1 — Import Library + Config API
import os
import json
import time
from typing import Any, Dict, List, Optional, Union

import requests
import pandas as pd
import matplotlib.pyplot as plt


RAPIDAPI_HOST = "indonesia-stock-exchange-idx.p.rapidapi.com"
BASE_URL = f"https://{RAPIDAPI_HOST}"

# Ganti dengan RapidAPI Key Anda
RAPIDAPI_KEY = "ISI_RAPIDAPI_KEY_ANDA_DI_SINI"

# Alternatif jika memakai environment variable:
# RAPIDAPI_KEY = os.getenv("RAPIDAPI_KEY")

if not RAPIDAPI_KEY or RAPIDAPI_KEY == "ISI_RAPIDAPI_KEY_ANDA_DI_SINI":
    raise ValueError("Masukkan RapidAPI Key Anda dulu pada variabel RAPIDAPI_KEY.")

HEADERS = {
    "Content-Type": "application/json",
    "x-rapidapi-host": RAPIDAPI_HOST,
    "x-rapidapi-key": RAPIDAPI_KEY,
}

print("API configuration ready.")
Explanation
Cell 1 prepares the notebook environment and API configuration.
The notebook imports several required libraries. os is prepared for environment variable usage. json is used to preview raw API responses in readable format. time is used to add delays between API requests. requests is used to call the API endpoints. pandas is used to process data into dataframes. matplotlib.pyplot is used later for visualization.
The typing module imports Any, Dict, List, Optional, and Union. These are used in helper functions to make input and output types clearer.
The API setup starts with RAPIDAPI_HOST, which stores the RapidAPI host for the Indonesia Stock Exchange IDX API. BASE_URL is then created from that host.
The RAPIDAPI_KEY variable stores the API key. In this article, the key is replaced with a placeholder to avoid exposing private credentials.
The notebook also provides an alternative method for loading the API key from an environment variable:
# RAPIDAPI_KEY = os.getenv("RAPIDAPI_KEY")This is useful if the notebook is used in a safer or production-like environment.
The validation block checks whether the API key is empty or still using the placeholder. If it is, the notebook raises a ValueError.
Finally, HEADERS is created. It contains Content-Type, x-rapidapi-host, and x-rapidapi-key. These headers are used for every API request.
Cell 2 — Helper Function
def request_get(
    endpoint: str,
    params: Optional[Dict[str, Any]] = None,
    timeout: int = 30,
    max_retries: int = 5,
    wait_seconds: int = 3
) -> Union[Dict[str, Any], List[Any]]:

    url = f"{BASE_URL}{endpoint}"

    for attempt in range(1, max_retries + 1):
        time.sleep(wait_seconds)

        response = requests.get(
            url,
            headers=HEADERS,
            params=params,
            timeout=timeout
        )

        try:
            payload = response.json()
        except Exception:
            payload = response.text

        if response.ok:
            return payload

        if response.status_code == 429:
            print(
                f"Rate limit 429. Percobaan {attempt}/{max_retries}. "
                f"Tunggu {wait_seconds} detik..."
            )
            time.sleep(wait_seconds)
            continue

        raise RuntimeError(
            f"Request gagal. Status: {response.status_code}\n"
            f"URL: {response.url}\n"
            f"Response: {payload}"
        )

    raise RuntimeError(
        f"Request gagal karena rate limit 429 setelah {max_retries} percobaan."
    )


def find_first_list(obj: Any) -> List[Dict[str, Any]]:
    if isinstance(obj, list):
        return obj if all(isinstance(item, dict) for item in obj) else []

    if isinstance(obj, dict):
        priority_keys = [
            "data", "result", "results", "items", "rows",
            "content", "stocks", "topStocks", "topGainer", "movers"
        ]

        for key in priority_keys:
            if key in obj:
                found = find_first_list(obj[key])
                if found:
                    return found

        for value in obj.values():
            found = find_first_list(value)
            if found:
                return found

    return []


def json_to_dataframe(payload: Union[Dict[str, Any], List[Any]]) -> pd.DataFrame:
    records = find_first_list(payload)

    if records:
        return pd.json_normalize(records)

    if isinstance(payload, dict):
        return pd.json_normalize(payload)

    return pd.DataFrame()


def detect_column(df: pd.DataFrame, keywords: List[str]) -> Optional[str]:
    if df.empty:
        return None

    lower_map = {col.lower(): col for col in df.columns}

    for keyword in keywords:
        if keyword.lower() in lower_map:
            return lower_map[keyword.lower()]

    for col in df.columns:
        col_lower = col.lower()
        if any(keyword.lower() in col_lower for keyword in keywords):
            return col

    return None


def safe_series(df: pd.DataFrame, col: Optional[str], default_value=None) -> pd.Series:
    if col is None or col not in df.columns:
        return pd.Series([default_value] * len(df), index=df.index)

    return df[col]


def normalize_0_100(series: pd.Series) -> pd.Series:
    numeric = pd.to_numeric(series, errors="coerce").fillna(0)

    min_val = numeric.min()
    max_val = numeric.max()

    if max_val == min_val:
        return pd.Series([0] * len(numeric), index=numeric.index)

    return (numeric - min_val) / (max_val - min_val) * 100
Explanation
Cell 2 contains helper functions that make the workflow more flexible and stable.
The first function is request_get. It sends a GET request to an API endpoint. The endpoint is combined with BASE_URL, then the request is sent with requests.get.
This function includes retry logic. If the API returns status code 429, meaning rate limit, the notebook waits and retries the request. The maximum number of retries is set to 5.
If the response is successful, the function returns the payload. If another error occurs, it raises a RuntimeError containing the response status, URL, and payload.
The second function is find_first_list. It searches through a nested JSON response and tries to find the first list of dictionaries. It checks keys such as data, result, results, items, rows, stocks, topStocks, topGainer, and movers.
The third function is json_to_dataframe. It converts the API payload into a dataframe. If a list of records is found, it normalizes the list with pd.json_normalize. If not, it normalizes the dictionary directly.
The fourth function is detect_column. It detects a dataframe column based on possible keywords. This is useful because API responses can use different column names for the same type of information.
The fifth function is safe_series. It safely returns a dataframe column. If the column does not exist, it returns a default-value series with the same index as the dataframe.
The last function is normalize_0_100. It converts a numeric series into a 0–100 score. This function is later used to calculate normalized scores for price movement, volume, transaction value, and frequency.
Cell 3 — Ambil Data dari 2 API
# Parameter getMarketMover
FILTER_STOCKS = "FILTER_STOCKS_TYPE_MAIN_BOARD,FILTER_STOCKS_TYPE_DEVELOPMENT_BOARD"

# Parameter getTopStocks
START_DATE = "2026-01-05"
END_DATE = "2026-01-05"
PAGE = 1
MARKET_TYPE = "MARKET_TYPE_ALL"
INVESTOR_TYPE = "INVESTOR_TYPE_ALL"
VALUE_TYPE = "VALUE_TYPE_TOTAL"


print("Mengambil data getMarketMover...")
market_mover_payload = request_get(
    endpoint="/api/movers/top-gainer",
    params={
        "filterStocks": FILTER_STOCKS
    },
    wait_seconds=3
)

time.sleep(5)

print("Mengambil data getTopStocks...")
top_stocks_payload = request_get(
    endpoint="/api/market-detector/top-stock",
    params={
        "end": END_DATE,
        "page": PAGE,
        "marketType": MARKET_TYPE,
        "investorType": INVESTOR_TYPE,
        "valueType": VALUE_TYPE,
        "start": START_DATE
    },
    wait_seconds=3
)


market_mover_df = json_to_dataframe(market_mover_payload)
top_stocks_df = json_to_dataframe(top_stocks_payload)

market_mover_df["source_api"] = "getMarketMover"
top_stocks_df["source_api"] = "getTopStocks"

print("Market Mover shape:", market_mover_df.shape)
print("Top Stocks shape:", top_stocks_df.shape)

display(market_mover_df.head())
display(top_stocks_df.head())

print("Preview Market Mover JSON:")
print(json.dumps(market_mover_payload, indent=2, ensure_ascii=False)[:1500])

print("\nPreview Top Stocks JSON:")
print(json.dumps(top_stocks_payload, indent=2, ensure_ascii=False)[:1500])
Explanation
Cell 3 retrieves data from the two APIs.
The first section defines the getMarketMover parameter:
FILTER_STOCKS = "FILTER_STOCKS_TYPE_MAIN_BOARD,FILTER_STOCKS_TYPE_DEVELOPMENT_BOARD"
This means the market mover request focuses on stocks from the main board and development board.
The second section defines parameters for getTopStocks:
START_DATE
END_DATE
PAGE
MARKET_TYPE
INVESTOR_TYPE
VALUE_TYPE
The date used in the notebook is 2026-01-05. The market type and investor type are both set to all categories, while the value type is set to total value.
The notebook then calls the getMarketMover endpoint:
/api/movers/top-gainer
This endpoint retrieves top gainer market mover data.
After that, the notebook waits for 5 seconds using time.sleep(5). This delay helps reduce the risk of hitting the API rate limit.
Then, the notebook calls the getTopStocks endpoint:
/api/market-detector/top-stock
The response from each API is stored in:
market_mover_payload
and
top_stocks_payload
Both payloads are converted into dataframes using json_to_dataframe.
The resulting dataframes are:
market_mover_df
and
top_stocks_df
The notebook then adds a source_api column to each dataframe. This makes it easier to track where the data comes from.
Finally, the notebook prints the shape of each dataframe, displays the first rows, and prints a preview of the raw JSON responses.
This cell is the main data collection step for the IDX active stock screener.
Cell 4 — Cleaning Data dan Deteksi Kolom
# Deteksi kolom Market Mover
mover_ticker_col = detect_column(
    market_mover_df,
    ["ticker", "symbol", "stockCode", "stock_code", "code", "securityCode"]
)

mover_name_col = detect_column(
    market_mover_df,
    ["name", "stockName", "stock_name", "companyName", "company_name", "issuer"]
)

mover_price_col = detect_column(
    market_mover_df,
    ["price", "lastPrice", "last_price", "close", "currentPrice", "current_price"]
)

mover_change_col = detect_column(
    market_mover_df,
    ["change", "chg", "priceChange", "price_change", "point"]
)

mover_percent_col = detect_column(
    market_mover_df,
    ["percent", "percentage", "changePercent", "change_percent", "pct", "gain"]
)

mover_volume_col = detect_column(
    market_mover_df,
    ["volume", "vol", "transactionVolume", "transaction_volume"]
)


# Deteksi kolom Top Stocks
top_ticker_col = detect_column(
    top_stocks_df,
    ["ticker", "symbol", "stockCode", "stock_code", "code", "securityCode"]
)

top_name_col = detect_column(
    top_stocks_df,
    ["name", "stockName", "stock_name", "companyName", "company_name", "issuer"]
)

top_value_col = detect_column(
    top_stocks_df,
    ["value", "amount", "transactionValue", "transaction_value", "turnover", "total"]
)

top_volume_col = detect_column(
    top_stocks_df,
    ["volume", "vol", "transactionVolume", "transaction_volume"]
)

top_frequency_col = detect_column(
    top_stocks_df,
    ["frequency", "freq", "transactionFrequency", "transaction_frequency"]
)


print("Detected Market Mover columns:")
print("ticker :", mover_ticker_col)
print("name   :", mover_name_col)
print("price  :", mover_price_col)
print("change :", mover_change_col)
print("percent:", mover_percent_col)
print("volume :", mover_volume_col)

print("\nDetected Top Stocks columns:")
print("ticker   :", top_ticker_col)
print("name     :", top_name_col)
print("value    :", top_value_col)
print("volume   :", top_volume_col)
print("frequency:", top_frequency_col)


market_mover_clean = pd.DataFrame({
    "ticker": (
        safe_series(market_mover_df, mover_ticker_col, "")
        .astype(str)
        .str.upper()
        .str.strip()
    ),
    "stock_name_mover": safe_series(market_mover_df, mover_name_col, ""),
    "last_price": pd.to_numeric(safe_series(market_mover_df, mover_price_col, None), errors="coerce"),
    "price_change": pd.to_numeric(safe_series(market_mover_df, mover_change_col, None), errors="coerce"),
    "change_percent": pd.to_numeric(safe_series(market_mover_df, mover_percent_col, None), errors="coerce"),
    "mover_volume": pd.to_numeric(safe_series(market_mover_df, mover_volume_col, None), errors="coerce"),
})

market_mover_clean = market_mover_clean[market_mover_clean["ticker"].ne("")].copy()
market_mover_clean["source_api_mover"] = "getMarketMover"


top_stocks_clean = pd.DataFrame({
    "ticker": (
        safe_series(top_stocks_df, top_ticker_col, "")
        .astype(str)
        .str.upper()
        .str.strip()
    ),
    "stock_name_top": safe_series(top_stocks_df, top_name_col, ""),
    "top_value": pd.to_numeric(safe_series(top_stocks_df, top_value_col, None), errors="coerce"),
    "top_volume": pd.to_numeric(safe_series(top_stocks_df, top_volume_col, None), errors="coerce"),
    "top_frequency": pd.to_numeric(safe_series(top_stocks_df, top_frequency_col, None), errors="coerce"),
})

top_stocks_clean = top_stocks_clean[top_stocks_clean["ticker"].ne("")].copy()
top_stocks_clean["source_api_top"] = "getTopStocks"


display(market_mover_clean.head(20))
display(top_stocks_clean.head(20))
Explanation
Cell 4 cleans both datasets and detects important columns.
The first section detects columns from market_mover_df. The notebook searches for ticker, stock name, price, price change, percentage change, and volume columns.
For example, ticker may appear as ticker, symbol, stockCode, stock_code, code, or securityCode. The price column may appear as price, lastPrice, close, or currentPrice.
The second section detects columns from top_stocks_df. The notebook searches for ticker, stock name, transaction value, volume, and transaction frequency.
After detection, the notebook prints all detected columns so the user can verify whether the correct columns were found.
Next, the notebook creates market_mover_clean. This dataframe standardizes market mover data into:
ticker
stock_name_mover
last_price
price_change
change_percent
mover_volume
The ticker is converted to uppercase and stripped of extra spaces. Numerical columns are converted using pd.to_numeric.
Rows with empty ticker values are removed, and the notebook adds:
source_api_mover = "getMarketMover"
Then, the notebook creates top_stocks_clean. This dataframe standardizes top stock data into:
ticker
stock_name_top
top_value
top_volume
top_frequency
The ticker is also converted to uppercase and cleaned. Numerical columns are converted into numeric format.
Rows with empty ticker values are removed, and the notebook adds:
source_api_top = "getTopStocks"
At the end, the notebook displays the first 20 rows of both cleaned dataframes.
This cell turns raw API responses into clean, standardized datasets that are ready to be merged.
Cell 5 — Gabungkan Data dan Buat Scoring
project_output = market_mover_clean.merge(
    top_stocks_clean,
    on="ticker",
    how="outer"
)

project_output["stock_name"] = project_output["stock_name_mover"].fillna(
    project_output["stock_name_top"]
)

project_output["change_percent_score"] = normalize_0_100(project_output["change_percent"])
project_output["mover_volume_score"] = normalize_0_100(project_output["mover_volume"])
project_output["top_value_score"] = normalize_0_100(project_output["top_value"])
project_output["top_volume_score"] = normalize_0_100(project_output["top_volume"])
project_output["top_frequency_score"] = normalize_0_100(project_output["top_frequency"])

project_output["combined_score"] = (
    project_output["change_percent_score"] * 0.35
    + project_output["mover_volume_score"] * 0.15
    + project_output["top_value_score"] * 0.25
    + project_output["top_volume_score"] * 0.15
    + project_output["top_frequency_score"] * 0.10
)

project_output["is_market_mover"] = project_output["source_api_mover"].notna()
project_output["is_top_stock"] = project_output["source_api_top"].notna()

project_output["project_note"] = (
    "Data getMarketMover dan getTopStocks digabungkan berdasarkan ticker "
    "untuk melihat saham yang bergerak naik dan aktif secara transaksi."
)

project_output = project_output.sort_values("combined_score", ascending=False)

summary_df = pd.DataFrame({
    "description": [
        "Total saham dari getMarketMover",
        "Total saham dari getTopStocks",
        "Total saham setelah digabung",
        "Saham yang muncul di kedua API",
        "Tanggal top stocks"
    ],
    "value": [
        len(market_mover_clean),
        len(top_stocks_clean),
        len(project_output),
        len(project_output[
            (project_output["is_market_mover"] == True) &
            (project_output["is_top_stock"] == True)
        ]),
        START_DATE
    ]
})

display(project_output.head(30))
display(summary_df)
Explanation
Cell 5 merges the cleaned datasets and creates the scoring system.
The notebook merges market_mover_clean and top_stocks_clean using the ticker column. The merge uses how="outer", which means all tickers from both datasets are kept.
After merging, the notebook creates a unified stock name column:
stock_name
This column uses stock_name_mover first. If that value is missing, it uses stock_name_top.
Then, the notebook creates several normalized score columns using normalize_0_100:
change_percent_score
mover_volume_score
top_value_score
top_volume_score
top_frequency_score
These scores convert different metrics into the same 0–100 scale.
The main ranking metric is combined_score.
The formula is:
35% from change_percent_score
15% from mover_volume_score
25% from top_value_score
15% from top_volume_score
10% from top_frequency_score
This means the screener gives the highest weight to percentage price movement, while transaction value, volume, and frequency act as supporting activity signals.
The notebook also creates two boolean columns:
is_market_mover
and
is_top_stock
These columns indicate whether a ticker appears in the market mover dataset, the top stocks dataset, or both.
Then, the notebook adds a project_note explaining that the data from getMarketMover and getTopStocks is merged by ticker to identify stocks that are moving upward and actively traded.
After that, project_output is sorted by combined_score from highest to lowest.
Finally, the notebook creates summary_df, which summarizes total stocks from each API, total merged stocks, stocks that appear in both APIs, and the top stocks date.
This cell is the core of the IDX active stock screener.
Cell 6 — Visualisasi dan Export
top_n = 15
plot_df = project_output.head(top_n).copy()

plt.figure(figsize=(10, 6))
plt.barh(plot_df["ticker"].astype(str), plot_df["combined_score"])
plt.gca().invert_yaxis()
plt.xlabel("Combined Score")
plt.ylabel("Ticker")
plt.title(f"Top {top_n} Market Mover + Top Stocks")
plt.tight_layout()
plt.show()


market_mover_clean.to_csv("idx_market_mover_clean.csv", index=False)
top_stocks_clean.to_csv("idx_top_stocks_clean.csv", index=False)
project_output.to_csv("idx_market_mover_top_stocks_project.csv", index=False)
summary_df.to_csv("idx_market_mover_top_stocks_summary.csv", index=False)

with pd.ExcelWriter("idx_market_mover_top_stocks_project.xlsx", engine="openpyxl") as writer:
    market_mover_df.to_excel(writer, sheet_name="market_mover_raw", index=False)
    top_stocks_df.to_excel(writer, sheet_name="top_stocks_raw", index=False)
    market_mover_clean.to_excel(writer, sheet_name="market_mover_clean", index=False)
    top_stocks_clean.to_excel(writer, sheet_name="top_stocks_clean", index=False)
    project_output.to_excel(writer, sheet_name="final_output", index=False)
    summary_df.to_excel(writer, sheet_name="summary", index=False)

print("Export selesai:")
print("- idx_market_mover_clean.csv")
print("- idx_top_stocks_clean.csv")
print("- idx_market_mover_top_stocks_project.csv")
print("- idx_market_mover_top_stocks_summary.csv")
print("- idx_market_mover_top_stocks_project.xlsx")
Explanation
Cell 6 visualizes and exports the final result.
The notebook sets:
top_n = 15
Then, it takes the top 15 rows from project_output and stores them in plot_df.
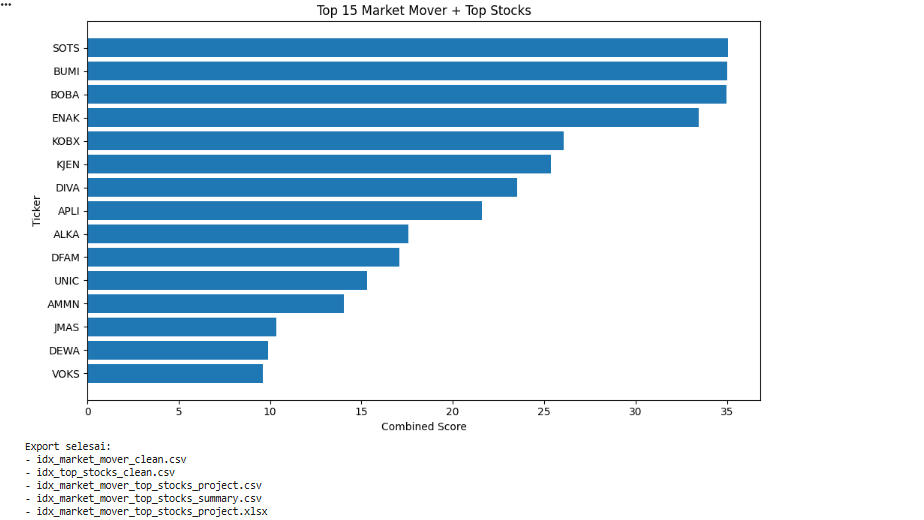
A horizontal bar chart is created using matplotlib. The Y-axis shows the stock tickers, while the X-axis shows combined_score.
The chart title is:
Top 15 Market Mover + Top Stocks
This visualization helps users quickly identify the highest-ranked stocks based on the combined score.
After visualization, the notebook exports several CSV files:
idx_market_mover_clean.csv
idx_top_stocks_clean.csv
idx_market_mover_top_stocks_project.csv
idx_market_mover_top_stocks_summary.csv
Then, the notebook exports an Excel file:
idx_market_mover_top_stocks_project.xlsx
The Excel file contains several sheets:
market_mover_raw
top_stocks_raw
market_mover_clean
top_stocks_clean
final_output
summary
This makes the final project easier to review, share, or continue in another analysis workflow.
Result:
Overall Workflow
This notebook follows a practical stock screening workflow.
First, it prepares the API configuration and required Python libraries.
Second, it creates helper functions for API requests, rate limit handling, JSON parsing, dataframe conversion, column detection, safe column selection, and score normalization.
Third, it retrieves market mover data from getMarketMover.
Fourth, it retrieves active transaction data from getTopStocks.
Fifth, it cleans both datasets and standardizes important columns.
Sixth, it merges both datasets by ticker.
Seventh, it calculates a combined_score based on price movement and transaction activity.
Finally, it visualizes the Top 15 stocks and exports the result to CSV and Excel.
The result is an IDX active stock screener that helps identify stocks with both upward movement and transaction activity.
Why This Case Matters
Many traders only look at top gainers. Others only look at transaction value or volume. But a stronger stock screener should combine both momentum and activity.
A stock that appears as a market mover may indicate short-term price strength. A stock that appears in top stocks may indicate strong transaction interest. When a stock appears in both signals, it may deserve closer attention.
This notebook turns that idea into a structured Python workflow.
By combining getMarketMover and getTopStocks, the notebook helps users build an IDX active stock screener that is more practical than looking at one API alone.
This does not mean the output is a buy or sell signal. It is a screening tool. The result should still be reviewed with deeper analysis, including trend structure, liquidity, risk, news, fundamentals, and market context.
Conclusion
This tutorial shows how to build an IDX active stock screener using Python, getMarketMover, and getTopStocks.
The notebook retrieves top gainer data and top transaction data, converts them into dataframes, detects relevant columns, cleans both datasets, merges them by ticker, calculates normalized scores, and creates a final combined_score.
The final result helps identify stocks that are both moving upward and actively traded. It also provides a Top 15 visualization and export files for further analysis.
This workflow is useful as an early-stage stock screening system for the Indonesian stock market. It gives traders, investors, and data enthusiasts a clean way to combine price movement and transaction activity into one ranked output.
In the end, the project is not just about calling two APIs. It is about building a simple but practical data-driven screener for finding active IDX stocks worth deeper analysis.