
INTRODUCTION
In stock analysis, finding strong candidates is rarely about looking at one signal only. A stock may look attractive from a growth-potential perspective, but that does not always mean the market is actively paying attention to it. On the other hand, a stock with high broker activity does not automatically mean it has strong long-term potential.
That is why combining multiple perspectives can be more useful.
This notebook uses two APIs: scanMultibagger and getBrokerActivity. The scanMultibagger API is used to find potential IDX multibagger stock candidates, while getBrokerActivity is used to capture additional signals from broker activity.
The final result is not just a raw stock list. The notebook collects API data, normalizes it, cleans ticker symbols, creates scoring columns, merges two datasets, and calculates a combined_score to rank the most interesting stock candidates.
This article explains each cell in the notebook step by step.
What Is scanMultibagger?
scanMultibagger is the main API endpoint used in this notebook to search for potential IDX multibagger stock candidates. In stock market analysis, a multibagger usually refers to a stock that has the potential to multiply significantly in value over time.
In this notebook, scanMultibagger acts as the core data source. The API result is processed into multi_df, unpacked into candidate data, cleaned by ticker, and converted into a standardized score called multibagger_score.
The main SEO keyword of this article is scanMultibagger, because the entire workflow starts from this endpoint.What Is getBrokerActivity?
getBrokerActivity is the second API used in the notebook. It retrieves broker activity data based on a selected broker code.
In this notebook, the selected broker code is:
DH
Broker activity data is used as an additional signal. After stock candidates are found through scanMultibagger, the notebook checks whether those stocks also appear in broker activity data.
The processed broker data is later summarized into:
broker_activity_score
Cell 1 — Import library
import os
import requests
import pandas as pd
import numpy as np
import matplotlib.pyplot as plt
from datetime import datetime

pd.set_option("display.max_columns", None)
pd.set_option("display.max_rows", 100)
Explanation
Cell 1 imports all libraries needed for the notebook.
requests is used to call the API endpoints. pandas is used to process API responses into dataframes. numpy helps handle numerical values and missing data. matplotlib.pyplot is used later to create the final Top 15 chart.
The notebook also changes pandas display settings. display.max_columns is set to None so all columns can be shown, while display.max_rows is set to 100 so the notebook can display more rows when previewing dataframes.
Cell 2 — Isi RapidAPI key
RAPIDAPI_KEY = "ISI_API_KEY_KAMU_DI_SINI"

if RAPIDAPI_KEY == "ISI_API_KEY_KAMU_DI_SINI":
    raise ValueError("Isi dulu RAPIDAPI_KEY kamu.")
Explanation
Cell 2 stores the RapidAPI key inside the RAPIDAPI_KEY variable.
The condition below it checks whether the user has replaced the placeholder value. If the value is still "ISI_API_KEY_KAMU_DI_SINI", the notebook stops and raises a ValueError.
This is useful because the API cannot be called without a valid RapidAPI key.
For a public tutorial, the API key should never be exposed directly. Readers should replace the placeholder with their own RapidAPI key.
Cell 3 — Setting API siap pakai
RAPIDAPI_HOST = "indonesia-stock-exchange-idx.p.rapidapi.com"
BASE_URL = "https://indonesia-stock-exchange-idx.p.rapidapi.com"

SCAN_MULTIBAGGER_URL = f"{BASE_URL}/api/analysis/retail/multibagger/scan"
BROKER_ACTIVITY_BASE_URL = f"{BASE_URL}/api/market-detector/broker-activity"

headers = {
    "Content-Type": "application/json",
    "x-rapidapi-key": RAPIDAPI_KEY,
    "x-rapidapi-host": RAPIDAPI_HOST
}
Explanation
Cell 3 prepares the API configuration.
RAPIDAPI_HOST stores the host name for the Indonesia Stock Exchange IDX API on RapidAPI. BASE_URL stores the base API URL.
The notebook then creates two endpoint URLs.
SCAN_MULTIBAGGER_URL points to the scanMultibagger endpoint:
/api/analysis/retail/multibagger/scan
BROKER_ACTIVITY_BASE_URL points to the broker activity endpoint:
/api/market-detector/broker-activity
The headers dictionary contains all required request headers, including Content-Type, x-rapidapi-key, and x-rapidapi-host.
There is also one line written as:
Cell 3 — Setting API siap pakai
In the file, this line appears inside a code cell. It is copied here because it exists in the original notebook, but it works more like a section marker than executable Python code.
Cell 4 — Parameter
# =========================
# PARAMETER MULTIBAGGER
# =========================
MULTI_MAX_RESULTS = 50

# Kosongkan sector supaya scan semua sektor
MULTI_SECTOR = ""

# Turunkan score supaya kandidat muncul
MULTI_MIN_SCORE = 0


# =========================
# PARAMETER BROKER ACTIVITY
# =========================
BROKER_CODE = "DH"

BROKER_LIMIT = 50
BROKER_PAGE = 1

BROKER_TRANSACTION_TYPE = "TRANSACTION_TYPE_NET"
BROKER_MARKET_BOARD = "MARKET_BOARD_ALL"
BROKER_INVESTOR_TYPE = "INVESTOR_TYPE_ALL"

BROKER_FROM_DATE = "2026-01-02"
BROKER_TO_DATE = "2026-01-02"


print("Parameter siap.")
print("Multibagger:", MULTI_SECTOR, MULTI_MIN_SCORE, MULTI_MAX_RESULTS)
print("Broker:", BROKER_CODE, BROKER_FROM_DATE, BROKER_TO_DATE)
Explanation
Cell 4 defines the parameters for both APIs.
For scanMultibagger, the notebook uses MULTI_MAX_RESULTS = 50, meaning it tries to retrieve up to 50 results. MULTI_SECTOR is left empty so the scan can cover all sectors. MULTI_MIN_SCORE = 0 is used to make it easier for candidates to appear.
For getBrokerActivity, the notebook uses broker code DH. It also sets the broker activity request to use net transaction type, all market boards, all investor types, and the date range from 2026-01-02 to 2026-01-02.
At the end, the notebook prints the selected parameters so the user can confirm the setup before running the API calls.
Cell 5 — Ambil daftar saham IDX
def call_api(url, params=None, label="API"):
    print(f"\nCalling {label}")
    print("URL:", url)
    print("Params:", params)

    response = requests.get(
        url,
        headers=headers,
        params=params,
        timeout=30
    )

    print("Status:", response.status_code)
    print("Preview:")
    print(response.text[:3000])

    response.raise_for_status()

    try:
        return response.json()
    except Exception as e:
        raise ValueError(f"Response {label} bukan JSON valid: {e}")
Explanation
Cell 5 creates a reusable helper function called call_api.
This function receives a URL, optional parameters, and a label. It prints the API label, URL, parameters, response status, and a preview of the response text.
The request is sent using requests.get.
response.raise_for_status() is used to stop the process if the API returns an HTTP error.
Finally, the response is converted into JSON. If the response is not valid JSON, the function raises a ValueError.
This function is used later to call both scanMultibagger and getBrokerActivity.
Cell 6 — Ambil data scan multibagger
multi_attempts = [
    {"max_results": 50, "sector": "", "min_score": 0},
    {"max_results": 50, "sector": "Energy", "min_score": 0},
    {"max_results": 50, "sector": "Financials", "min_score": 0},
    {"max_results": 50, "sector": "Basic Materials", "min_score": 0},
    {"max_results": 50, "sector": "Consumer Cyclicals", "min_score": 0},
    {"max_results": 50, "sector": "Consumer Non-Cyclicals", "min_score": 0},
    {"max_results": 50, "sector": "Industrials", "min_score": 0},
    {"max_results": 50, "sector": "Infrastructure", "min_score": 0},
    {"max_results": 50, "sector": "Healthcare", "min_score": 0},
    {"max_results": 50, "sector": "Technology", "min_score": 0},
    {"max_results": 50, "sector": "Transportation & Logistic", "min_score": 0},
]

multi_json = None
multi_df = None
used_multi_params = None

for params in multi_attempts:
    print("\nMencoba parameter:", params)

    temp_json = call_api(
        SCAN_MULTIBAGGER_URL,
        params=params,
        label="Scan Multibagger"
    )

    temp_df = pd.json_normalize(temp_json)

    total_candidates = 0

    if "data.total_candidates" in temp_df.columns:
        total_candidates = int(temp_df["data.total_candidates"].iloc[0])

    print("Total candidates:", total_candidates)

    if total_candidates > 0:
        multi_json = temp_json
        multi_df = temp_df
        used_multi_params = params
        break

if multi_df is None:
    raise ValueError(
        "Semua percobaan scan multibagger tetap menghasilkan 0 kandidat. "
        "Kemungkinan API sedang tidak punya data kandidat untuk periode ini."
    )

multi_df["sector_request"] = used_multi_params.get("sector")
multi_df["min_score_request"] = used_multi_params.get("min_score")
multi_df["max_results_request"] = used_multi_params.get("max_results")

print("\nParameter yang berhasil:", used_multi_params)
print("multi_df shape:", multi_df.shape)
display(multi_df.head())
print(multi_df.columns.tolist())
Explanation
Cell 6 is where the notebook calls the scanMultibagger API.
The notebook creates a list called multi_attempts, which contains several parameter combinations. The first attempt scans all sectors by using an empty sector value. If that attempt does not return candidates, the notebook continues trying individual sectors such as Energy, Financials, Basic Materials, Consumer Cyclicals, Consumer Non-Cyclicals, Industrials, Infrastructure, Healthcare, Technology, and Transportation & Logistic.
Each attempt is sent to the SCAN_MULTIBAGGER_URL endpoint using the call_api function.
The API response is normalized into a dataframe using pd.json_normalize.
The notebook checks whether data.total_candidates exists. If the number of candidates is greater than zero, the successful response is stored in multi_json, multi_df, and used_multi_params.
If all attempts return zero candidates, the notebook raises a ValueError.
After a successful request, the notebook adds three tracking columns: sector_request, min_score_request, and max_results_request. These columns help identify which parameter set successfully returned the data.
Cell 7 — Ambil data broker activity
broker_activity_url = f"{BROKER_ACTIVITY_BASE_URL}/{BROKER_CODE}"

broker_params = {
    "limit": BROKER_LIMIT,
    "transactionType": BROKER_TRANSACTION_TYPE,
    "to": BROKER_TO_DATE,
    "marketBoard": BROKER_MARKET_BOARD,
    "investorType": BROKER_INVESTOR_TYPE,
    "from": BROKER_FROM_DATE,
    "page": BROKER_PAGE
}

broker_json = call_api(
    broker_activity_url,
    params=broker_params,
    label="Broker Activity"
)

broker_df = pd.json_normalize(broker_json)

broker_df["broker_code_request"] = BROKER_CODE
broker_df["from_date_request"] = BROKER_FROM_DATE
broker_df["to_date_request"] = BROKER_TO_DATE
broker_df["transaction_type_request"] = BROKER_TRANSACTION_TYPE

print("broker_df shape:", broker_df.shape)
display(broker_df.head())
print(broker_df.columns.tolist())
Explanation
Cell 7 retrieves broker activity data from the getBrokerActivity endpoint.
The broker activity URL is created by combining BROKER_ACTIVITY_BASE_URL and BROKER_CODE. Since BROKER_CODE is set to DH, the API request focuses on broker DH.
The request parameters are stored in broker_params. These include limit, transaction type, end date, market board, investor type, start date, and page.
The API is called using call_api, and the JSON response is normalized into broker_df.
The notebook also adds several tracking columns: broker_code_request, from_date_request, to_date_request, and transaction_type_request.
These columns preserve the context of the broker activity request inside the dataframe.
Cell 8 — Helper pembersihan ticker
def clean_ticker_value(x):
    if pd.isna(x):
        return np.nan

    x = str(x).upper().strip()
    x = x.replace(".JK", "")
    x = x.replace("IDX:", "")
    x = x.replace(" ", "")
    x = x.replace("-", "")

    if x in ["", "NONE", "NAN", "NULL"]:
        return np.nan

    return x


def find_ticker_col(df, df_name="df"):
    candidates = [
        "ticker", "Ticker", "TICKER",
        "symbol", "Symbol", "SYMBOL",
        "code", "Code", "CODE",
        "stock", "Stock", "STOCK",
        "emiten", "Emiten", "EMITEN",
        "kode", "Kode", "KODE",
        "Kode Saham", "kode_saham", "KODE_SAHAM",
        "saham", "Saham", "SAHAM",

        # Kolom dari API broker activity lama
        "netbs_stock_code",
        "stock_code",
        "stockCode",
        "StockCode",
        "stock.code",
        "company_code",
        "company.symbol",
        "idx_code",
        "idxCode",

        # Kolom dari API broker activity kamu sekarang
        "data.data.broker_summary.symbol",
        "data.broker_summary.symbol",
        "broker_summary.symbol"
    ]

    for col in candidates:
        if col in df.columns:
            return col

    raise ValueError(
        f"Kolom ticker tidak ditemukan di {df_name}. "
        f"Kolom tersedia: {df.columns.tolist()}"
    )
Explanation
Cell 8 creates two helper functions for ticker cleaning.
The first function is clean_ticker_value. It standardizes ticker values by converting them into uppercase, removing .JK, removing IDX:, removing spaces, removing hyphens, and converting invalid values such as empty string, NONE, NAN, and NULL into np.nan.
The second function is find_ticker_col. It searches for the ticker column inside a dataframe by checking many possible column names, such as ticker, symbol, code, stock, emiten, kode, stock_code, company.symbol, and nested broker summary columns.
If a matching column is found, the function returns the column name. If no ticker column is found, it raises a ValueError and prints all available columns.
This cell is important because data from different API endpoints may use different names for ticker columns.
Cell 9 — Bongkar data multibagger
print("Kolom multi_df awal:")
print(multi_df.columns.tolist())

if "data.candidates" in multi_df.columns:
    candidates_raw = multi_df["data.candidates"].iloc[0]

    if candidates_raw is None or len(candidates_raw) == 0:
        print("Data candidates kosong.")
        print("Coba turunkan MULTI_MIN_SCORE atau ubah MULTI_SECTOR.")
        display(multi_df)
        raise ValueError("API multibagger tidak mengembalikan kandidat.")

    if isinstance(candidates_raw, dict):
        candidates_raw = [candidates_raw]

    multi_clean_raw = pd.json_normalize(candidates_raw)

elif isinstance(multi_json, list):
    multi_clean_raw = pd.json_normalize(multi_json)

elif isinstance(multi_json, dict) and "candidates" in multi_json:
    candidates_raw = multi_json["candidates"]

    if candidates_raw is None or len(candidates_raw) == 0:
        raise ValueError("Key candidates kosong dari API multibagger.")

    multi_clean_raw = pd.json_normalize(candidates_raw)

else:
    multi_clean_raw = multi_df.copy()

print("Kolom multi_clean_raw:")
print(multi_clean_raw.columns.tolist())

print("multi_clean_raw shape:", multi_clean_raw.shape)
display(multi_clean_raw.head())
Explanation
Cell 9 unpacks the candidate data from the scanMultibagger response.
The notebook first prints the original columns in multi_df.
If the dataframe contains the data.candidates column, the notebook extracts the candidates from that column. If the candidate list is empty, the notebook displays the dataframe and raises a ValueError.
If the candidate data is a dictionary, it is converted into a list so it can be normalized properly.
The candidate data is then converted into a dataframe using pd.json_normalize and stored as multi_clean_raw.
The cell also handles alternative API response structures. If multi_json is already a list, it normalizes that list. If multi_json is a dictionary with a candidates key, it normalizes that value. Otherwise, it copies multi_df.
At the end, the notebook prints the columns and shape of multi_clean_raw, then displays the first rows.
Cell 10 — Bersihkan ticker multibagger
multi_ticker_col = find_ticker_col(multi_clean_raw, "multi_clean_raw")

multi_clean = multi_clean_raw.copy()
multi_clean["ticker"] = multi_clean[multi_ticker_col].apply(clean_ticker_value)
multi_clean = multi_clean.dropna(subset=["ticker"])

print("Multi ticker column:", multi_ticker_col)
print("multi_clean shape:", multi_clean.shape)
display(multi_clean.head())
Explanation
Cell 10 cleans ticker symbols in the multibagger dataframe.
The function find_ticker_col is used to find which column contains the ticker value inside multi_clean_raw.
The dataframe is copied into multi_clean. Then, a new standardized column called ticker is created by applying clean_ticker_value to the detected ticker column.
Rows without valid ticker values are removed using dropna.
The result is a cleaned multibagger dataframe that is ready to be merged later.
Cell 11 — Bersihkan ticker broker activity
broker_ticker_col = find_ticker_col(broker_df, "broker_df")

broker_clean = broker_df.copy()
broker_clean["ticker"] = broker_clean[broker_ticker_col].apply(clean_ticker_value)
broker_clean = broker_clean.dropna(subset=["ticker"])

print("Broker ticker column:", broker_ticker_col)
print("broker_clean shape:", broker_clean.shape)
display(broker_clean.head())
print(broker_clean.columns.tolist())
Explanation
Cell 11 cleans ticker symbols in the broker activity dataframe.
The function find_ticker_col searches for the ticker column in broker_df.
The dataframe is copied into broker_clean. Then, a new standardized ticker column is created using clean_ticker_value.
Rows with invalid ticker values are removed.
The notebook prints the detected broker ticker column, dataframe shape, preview rows, and all available columns.
This step ensures that broker activity data can be matched with the multibagger data using the same ticker format.
Cell 12 — Cari score multibagger
def find_score_col(df):
    candidates = [
        "combined_score", "Combined Score",
        "score", "Score",
        "total_score", "Total Score",
        "final_score", "Final Score",
        "multibagger_score", "Multibagger Score",
        "rank_score", "Rank Score",
        "data.score",
        "data.combined_score"
    ]

    for col in candidates:
        if col in df.columns:
            return col

    numeric_cols = df.select_dtypes(include=[np.number]).columns.tolist()

    if len(numeric_cols) == 0:
        raise ValueError(
            "Tidak ada kolom numeric untuk score multibagger. "
            f"Kolom tersedia: {df.columns.tolist()}"
        )

    print("Kolom score tidak ditemukan otomatis.")
    print("Pakai kolom numeric pertama:", numeric_cols[0])
    return numeric_cols[0]


multi_score_col = find_score_col(multi_clean)

multi_summary = multi_clean.copy()

if multi_score_col != "multibagger_score":
    multi_summary = multi_summary.rename(columns={multi_score_col: "multibagger_score"})

multi_summary["multibagger_score"] = pd.to_numeric(
    multi_summary["multibagger_score"],
    errors="coerce"
).fillna(0)

print("Multibagger score column:", multi_score_col)
display(multi_summary[["ticker", "multibagger_score"]].head())
Explanation
Cell 12 searches for the score column in the multibagger data.
The function find_score_col checks several possible score column names, such as combined_score, score, total_score, final_score, multibagger_score, rank_score, data.score, and data.combined_score.
If one of those columns exists, it is used as the score column.
If no matching score column is found, the function searches for the first numeric column and uses it as a fallback. If no numeric column exists, it raises a ValueError.
After the score column is found, the notebook copies multi_clean into multi_summary.
If the detected score column is not already named multibagger_score, the notebook renames it.
Finally, the multibagger_score column is converted into numeric format, and missing values are filled with zero.
Cell 13 — Buat broker activity score
broker_numeric_cols = broker_clean.select_dtypes(include=[np.number]).columns.tolist()

broker_score_col = None

broker_candidates = [
    "broker_activity_score",
    "broker_score", "Broker Score",
    "net_buy", "Net Buy",
    "foreign_net_buy", "Foreign Net Buy",
    "bval", "bvalv",
    "blot", "blotv",
    "value", "Value",
    "volume", "Volume",
    "total", "Total"
]

for col in broker_candidates:
    if col in broker_clean.columns:
        broker_score_col = col
        break

if broker_score_col is None and len(broker_numeric_cols) > 0:
    broker_score_col = broker_numeric_cols[0]

if broker_score_col:
    print("Broker score column:", broker_score_col)

    broker_clean[broker_score_col] = pd.to_numeric(
        broker_clean[broker_score_col],
        errors="coerce"
    ).fillna(0)

    broker_summary = (
        broker_clean
        .groupby("ticker", as_index=False)[broker_score_col]
        .sum()
        .rename(columns={broker_score_col: "broker_activity_score"})
    )
else:
    print("Tidak ada kolom numeric broker. broker_activity_score dibuat 0.")

    broker_summary = broker_clean[["ticker"]].drop_duplicates()
    broker_summary["broker_activity_score"] = 0

display(broker_summary.head())
Explanation
Cell 13 creates the broker activity score.
First, the notebook gets all numeric columns from broker_clean.
Then, it checks several possible broker score column names, such as broker_activity_score, broker_score, net_buy, foreign_net_buy, bval, bvalv, blot, blotv, value, volume, and total.
If one of these columns exists, it is used as broker_score_col.
If no candidate column is found but numeric columns exist, the notebook uses the first numeric column as a fallback.
If a broker score column is found, it is converted into numeric format and missing values are filled with zero.
Then, the broker data is grouped by ticker, and the selected broker score column is summed per ticker. The result is renamed to broker_activity_score.
If no numeric broker column exists, the notebook creates broker_activity_score manually and fills it with zero.
The output is broker_summary, which summarizes broker activity per ticker.
Cell 14 — Merge multibagger dan broker
final_df = multi_summary.merge(
    broker_summary,
    on="ticker",
    how="left"
)

final_df["broker_activity_score"] = pd.to_numeric(
    final_df["broker_activity_score"],
    errors="coerce"
).fillna(0)

final_df["multibagger_score"] = pd.to_numeric(
    final_df["multibagger_score"],
    errors="coerce"
).fillna(0)

print("Jumlah final_df:", len(final_df))
display(final_df.head())
Explanation
Cell 14 merges the multibagger data and broker activity data into a single dataframe.
The merge is performed using the ticker column.
The parameter how="left" means all rows from multi_summary are kept, even if there is no matching row in broker_summary.
After merging, both broker_activity_score and multibagger_score are converted into numeric format, and missing values are filled with zero.
The result is stored in final_df.
This dataframe becomes the base dataset for calculating the combined score.
Cell 15 — Hitung combined score
def minmax(series):
    series = pd.to_numeric(series, errors="coerce").fillna(0)

    if series.max() == series.min():
        return pd.Series([0] * len(series), index=series.index)

    return (series - series.min()) / (series.max() - series.min())


final_df["multibagger_score_norm"] = minmax(final_df["multibagger_score"])
final_df["broker_activity_score_norm"] = minmax(final_df["broker_activity_score"])

final_df["combined_score"] = (
    final_df["multibagger_score_norm"] * 70
    + final_df["broker_activity_score_norm"] * 30
)

final_df = final_df.sort_values("combined_score", ascending=False)

display(final_df.head(20))
Explanation
Cell 15 calculates the final combined_score.
The notebook first defines a function called minmax. This function normalizes numerical values using min-max normalization.
If all values in the series are the same, the function returns zero for all rows. This prevents division by zero.
The notebook then creates two normalized columns:
multibagger_score_norm
and
broker_activity_score_norm
After that, it calculates combined_score.
The formula gives 70% weight to multibagger_score_norm and 30% weight to broker_activity_score_norm.
This means the ranking is mainly driven by the multibagger score, while broker activity works as an additional supporting signal.
Finally, final_df is sorted by combined_score from highest to lowest, and the top 20 rows are displayed.
Cell 16 — Grafik Top 15
plot_df = final_df.copy()

plot_df = plot_df.dropna(subset=["ticker"])
plot_df = plot_df[plot_df["ticker"].astype(str).str.upper() != "NONE"]
plot_df = plot_df.sort_values("combined_score", ascending=False).head(15)

if plot_df.empty:
    raise ValueError("Data kosong. Tidak ada ticker valid untuk ditampilkan.")

plt.figure(figsize=(12, 7))
plt.barh(plot_df["ticker"], plot_df["combined_score"])
plt.xlabel("Combined Score")
plt.ylabel("Ticker")
plt.title("Top 15 Multibagger Candidates + Broker Activity Signal")
plt.gca().invert_yaxis()
plt.tight_layout()
plt.show()
Explanation
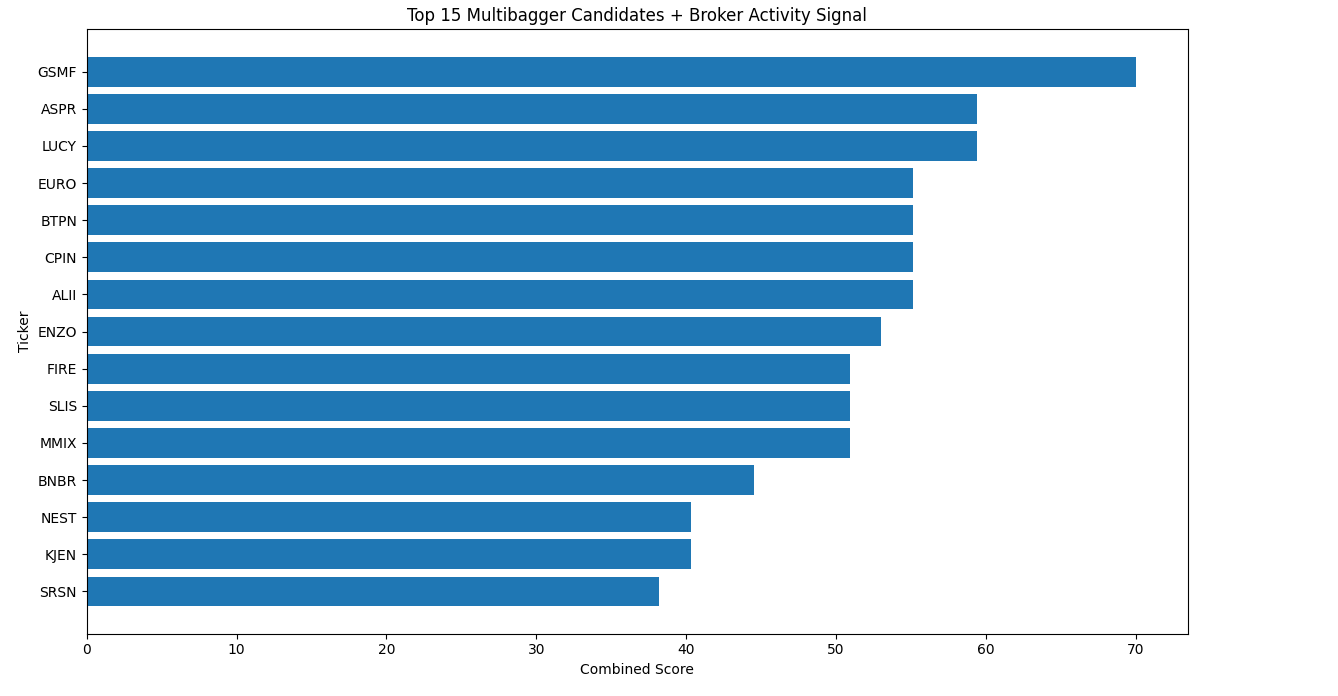
Cell 16 visualizes the Top 15 stock candidates based on combined_score.
The notebook copies final_df into plot_df.
It removes rows with missing ticker values and excludes ticker values equal to NONE.
Then, it sorts the dataframe by combined_score and selects the top 15 rows.
If plot_df is empty, the notebook raises a ValueError.
If data exists, the notebook creates a horizontal bar chart using matplotlib.
The Y-axis shows the ticker symbols, while the X-axis shows the combined score. The chart title is:
Top 15 Multibagger Candidates + Broker Activity Signal
This chart helps readers quickly identify which IDX stock candidates rank highest after combining the scanMultibagger signal with broker activity data.
Result:
Conclusion
This tutorial shows how to build a simple IDX stock screening workflow using scanMultibagger and getBrokerActivity.
The notebook starts by preparing libraries and API configuration. Then it sets request parameters, calls the scanMultibagger API, retrieves broker activity data, cleans ticker symbols, finds scoring columns, merges both datasets, calculates a combined score, and finally visualizes the Top 15 candidates.
The key part of this workflow is the combination of two signals. scanMultibagger provides the main stock candidate list, while getBrokerActivity adds broker activity context. The final combined_score gives more weight to the multibagger score and uses broker activity as a supporting factor.
This approach can be useful as an early-stage IDX stock scanner. However, the result should not be treated as a direct buy or sell recommendation. Any candidate found from this workflow should still be checked further using fundamental analysis, technical analysis, liquidity, market sentiment, and risk management.