
INTRODUCTION
In the stock market, timing and context matter.
A stock may appear in the trending list because of price movement, volume, or transaction value. But without market context, that movement can be difficult to interpret. This is where combining getMorningBriefing and getTrendingStocks becomes useful.
The getMorningBriefing API provides market briefing information that can help users understand the broader IDX context. Meanwhile, the getTrendingStocks API provides a list of stocks currently gaining attention in the market.
In this tutorial, we will walk through a Python notebook that combines both APIs into one simple analysis project. The notebook retrieves data from both endpoints, converts JSON responses into dataframes, cleans the trending stock data, calculates a trending_score, visualizes the Top 15 stocks, and exports the final results into CSV and Excel files.
Cell 1 — Konfigurasi API
import os
import json
import time
from typing import Any, Dict, List, Optional, Union

import requests
import pandas as pd
import matplotlib.pyplot as plt


RAPIDAPI_HOST = "indonesia-stock-exchange-idx.p.rapidapi.com"
BASE_URL = f"https://{RAPIDAPI_HOST}"

# Ganti dengan RapidAPI Key Anda
RAPIDAPI_KEY = "ISI_RAPIDAPI_KEY_ANDA_DI_SINI"

# Alternatif jika menggunakan environment variable:
# RAPIDAPI_KEY = os.getenv("RAPIDAPI_KEY")

if not RAPIDAPI_KEY or RAPIDAPI_KEY == "ISI_RAPIDAPI_KEY_ANDA_DI_SINI":
    raise ValueError("Masukkan RapidAPI Key Anda dulu pada variabel RAPIDAPI_KEY.")

HEADERS = {
    "Content-Type": "application/json",
    "x-rapidapi-host": RAPIDAPI_HOST,
    "x-rapidapi-key": RAPIDAPI_KEY,
}

print("API configuration ready.")
Explanation
This cell prepares the main configuration needed to access the Indonesia Stock Exchange IDX API through RapidAPI.
The notebook imports several important libraries. requests is used to send API requests. pandas is used to process data into dataframes. matplotlib.pyplot is used later for visualization. The typing module is used to define type hints in helper functions.
The variable RAPIDAPI_HOST stores the API host:
indonesia-stock-exchange-idx.p.rapidapi.com
Then, BASE_URL is created using the host value. This base URL will later be combined with endpoint paths such as /api/main/morning-briefing and /api/main/trending.
The RAPIDAPI_KEY variable stores the RapidAPI key. In a public article, this value should be replaced with a placeholder to avoid exposing private credentials.
The notebook also provides an alternative option using environment variables:
# RAPIDAPI_KEY = os.getenv("RAPIDAPI_KEY")This is useful for safer credential management.
The validation section checks whether the API key is empty or still using the placeholder value. If so, the notebook stops with a ValueError.
Finally, the HEADERS dictionary is created. It contains all headers required to call the API, including Content-Type, x-rapidapi-host, and x-rapidapi-key.
When the setup is complete, the notebook prints:
API configuration ready.
Cell 2 — Helper Function
def request_get(endpoint: str, params: Optional[Dict[str, Any]] = None):
    url = f"{BASE_URL}{endpoint}"
    time.sleep(0.2)

    response = requests.get(
        url,
        headers=HEADERS,
        params=params,
        timeout=30
    )

    try:
        payload = response.json()
    except Exception:
        payload = response.text

    if not response.ok:
        raise RuntimeError(
            f"Request gagal. Status: {response.status_code}\n"
            f"URL: {response.url}\n"
            f"Response: {payload}"
        )

    return payload


def find_first_list(obj: Any) -> List[Dict[str, Any]]:
    if isinstance(obj, list):
        return obj if all(isinstance(item, dict) for item in obj) else []

    if isinstance(obj, dict):
        for key in ["data", "result", "results", "items", "rows", "content", "stocks", "trending"]:
            if key in obj:
                found = find_first_list(obj[key])
                if found:
                    return found

        for value in obj.values():
            found = find_first_list(value)
            if found:
                return found

    return []


def json_to_dataframe(payload: Union[Dict[str, Any], List[Any]]) -> pd.DataFrame:
    records = find_first_list(payload)

    if records:
        return pd.json_normalize(records)

    if isinstance(payload, dict):
        return pd.json_normalize(payload)

    return pd.DataFrame()


def detect_column(df: pd.DataFrame, keywords: List[str]) -> Optional[str]:
    if df.empty:
        return None

    lower_map = {col.lower(): col for col in df.columns}

    for keyword in keywords:
        if keyword.lower() in lower_map:
            return lower_map[keyword.lower()]

    for col in df.columns:
        if any(keyword.lower() in col.lower() for keyword in keywords):
            return col

    return None


def safe_series(df: pd.DataFrame, col: Optional[str], default_value=None):
    if col is None or col not in df.columns:
        return pd.Series([default_value] * len(df), index=df.index)

    return df[col]


def normalize_0_100(series: pd.Series):
    numeric = pd.to_numeric(series, errors="coerce").fillna(0)

    if numeric.max() == numeric.min():
        return pd.Series([0] * len(numeric), index=numeric.index)

    return (numeric - numeric.min()) / (numeric.max() - numeric.min()) * 100


def flatten_json(obj: Any, parent_key: str = "") -> List[Dict[str, Any]]:
    rows = []

    if isinstance(obj, dict):
        for key, value in obj.items():
            new_key = f"{parent_key}.{key}" if parent_key else str(key)

            if isinstance(value, (dict, list)):
                rows.extend(flatten_json(value, new_key))
            else:
                rows.append({
                    "section": parent_key if parent_key else "root",
                    "field": str(key),
                    "path": new_key,
                    "value": value
                })

    elif isinstance(obj, list):
        for index, item in enumerate(obj):
            new_key = f"{parent_key}[{index}]"

            if isinstance(item, (dict, list)):
                rows.extend(flatten_json(item, new_key))
            else:
                rows.append({
                    "section": parent_key if parent_key else "root",
                    "field": str(index),
                    "path": new_key,
                    "value": item
                })

    return rows
Explanation
This cell contains the helper functions used throughout the notebook.
The first function is request_get. It sends a GET request to an API endpoint. The endpoint is joined with BASE_URL, then the request is sent using requests.get. The function also includes time.sleep(0.2) to create a small delay before each request.
After receiving the response, the function tries to convert the response into JSON. If it cannot parse JSON, it stores the response as plain text.
If the API request fails, the function raises a RuntimeError and displays the status code, URL, and response. If the request succeeds, it returns the payload.
The second function is find_first_list. It searches through a JSON object to find the first list of dictionaries. This is useful because API responses can have different structures. Sometimes the list is inside data, sometimes inside result, items, stocks, or trending.
The third function is json_to_dataframe. It converts a JSON payload into a pandas dataframe. It first tries to find a list of records using find_first_list. If records are found, it normalizes them using pd.json_normalize. If not, it normalizes the dictionary directly.
The fourth function is detect_column. It helps detect column names based on keyword candidates. This is important because API column names may vary. For example, ticker data may appear as ticker, symbol, stockCode, or another similar name.
The fifth function is safe_series. It safely returns a dataframe column. If the column does not exist, it returns a default-value series with the same length as the dataframe.
The sixth function is normalize_0_100. It converts numerical values into a 0 to 100 scale. This function is later used to calculate normalized scores for price change percentage, volume, and transaction value.
The last function is flatten_json. It converts nested JSON data into a flat table containing section, field, path, and value. This is especially useful for getMorningBriefing, because briefing data may contain nested information rather than a simple table.
Cell 3 — Ambil Data dari Dua API
morning_payload = request_get("/api/main/morning-briefing")
trending_payload = request_get("/api/main/trending")

morning_df = json_to_dataframe(morning_payload)
trending_df = json_to_dataframe(trending_payload)

morning_flat = pd.DataFrame(flatten_json(morning_payload))
morning_flat["source_api"] = "getMorningBriefing"

trending_df["source_api"] = "getTrendingStocks"

print("Morning dataframe shape:", morning_df.shape)
print("Trending dataframe shape:", trending_df.shape)

display(morning_df.head())
display(trending_df.head())
display(morning_flat.head(20))
Explanation
This cell retrieves data from the two main APIs.
The first API call is:
/api/main/morning-briefing
This endpoint is used as getMorningBriefing. It retrieves morning briefing data from the IDX API.
The second API call is:
/api/main/trending
This endpoint is used as getTrendingStocks. It retrieves trending stock data.
After both API responses are retrieved, the notebook converts them into dataframes.
morning_df stores the normalized morning briefing data.
trending_df stores the normalized trending stock data.
Then, the notebook creates morning_flat by applying flatten_json to morning_payload. This creates a flatter version of the morning briefing data, making nested information easier to inspect and use.
The notebook also adds a source_api column to both datasets:
morning_flat["source_api"] = "getMorningBriefing"
and
trending_df["source_api"] = "getTrendingStocks"
This helps identify the source of each dataset.
At the end of the cell, the notebook prints the shape of both dataframes and displays previews of morning_df, trending_df, and morning_flat.
This cell is the main data collection step of the project.
Cell 4 — Cleaning, Scoring, dan Gabungkan Data
ticker_col = detect_column(trending_df, ["ticker", "symbol", "stockCode", "stock_code", "code", "tickerCode", "securityCode"])
name_col = detect_column(trending_df, ["name", "stockName", "stock_name", "companyName", "company_name", "issuer"])
price_col = detect_column(trending_df, ["price", "lastPrice", "last_price", "close", "last", "currentPrice", "current_price"])
change_col = detect_column(trending_df, ["change", "chg", "priceChange", "price_change", "point"])
percent_col = detect_column(trending_df, ["percent", "percentage", "changePercent", "change_percent", "pct", "gain"])
volume_col = detect_column(trending_df, ["volume", "vol", "transactionVolume", "transaction_volume"])
value_col = detect_column(trending_df, ["value", "amount", "transactionValue", "transaction_value", "turnover"])

print("Detected columns:")
print("ticker :", ticker_col)
print("name   :", name_col)
print("price  :", price_col)
print("change :", change_col)
print("percent:", percent_col)
print("volume :", volume_col)
print("value  :", value_col)

trending_clean = pd.DataFrame({
    "ticker": safe_series(trending_df, ticker_col, "").astype(str).str.upper().str.strip(),
    "stock_name": safe_series(trending_df, name_col, ""),
    "price": pd.to_numeric(safe_series(trending_df, price_col, None), errors="coerce"),
    "change": pd.to_numeric(safe_series(trending_df, change_col, None), errors="coerce"),
    "change_percent": pd.to_numeric(safe_series(trending_df, percent_col, None), errors="coerce"),
    "volume": pd.to_numeric(safe_series(trending_df, volume_col, None), errors="coerce"),
    "value": pd.to_numeric(safe_series(trending_df, value_col, None), errors="coerce"),
})

if ticker_col is not None:
    trending_clean = trending_clean[trending_clean["ticker"].ne("")].copy()

briefing_context = " | ".join(
    morning_flat["value"]
    .dropna()
    .astype(str)
    .str.strip()
    .head(30)
    .tolist()
)

analysis_df = trending_clean.copy()

analysis_df["change_percent_score"] = normalize_0_100(analysis_df["change_percent"])
analysis_df["volume_score"] = normalize_0_100(analysis_df["volume"])
analysis_df["value_score"] = normalize_0_100(analysis_df["value"])

analysis_df["trending_score"] = (
    analysis_df["change_percent_score"] * 0.50
    + analysis_df["volume_score"] * 0.25
    + analysis_df["value_score"] * 0.25
)

project_output = analysis_df.sort_values("trending_score", ascending=False).copy()
project_output["briefing_context"] = briefing_context
project_output["briefing_items_count"] = len(morning_flat)
project_output["project_note"] = "Trending Stocks digabungkan dengan konteks Morning Briefing IDX."

display(project_output.head(20))
Explanation
This cell is the core analysis section of the notebook.
The first part detects important columns from trending_df. Because API responses may use different column names, the notebook uses detect_column to search for possible ticker, name, price, change, percent change, volume, and value columns.
For example, ticker information may appear as ticker, symbol, stockCode, stock_code, code, tickerCode, or securityCode.
After detecting the columns, the notebook prints the detected column names so the user can confirm which columns were found.
Next, the notebook creates trending_clean. This dataframe standardizes the trending stock data into clean columns:
ticker
stock_name
price
change
change_percent
volume
value
The ticker value is converted into uppercase and stripped of extra spaces. Numerical columns are converted using pd.to_numeric.
If a ticker column is detected, rows with empty ticker values are removed.
After that, the notebook creates briefing_context. This variable combines the first 30 non-empty values from morning_flat["value"] into one text string separated by " | ".
This means the morning briefing data is not merged row by row with each stock. Instead, it is used as a general market context attached to the final output.
Then, the notebook creates analysis_df from trending_clean.
Three normalized score columns are created:
change_percent_score
volume_score
value_score
Each score is normalized using normalize_0_100.
The final trending_score is calculated using this formula:
50% from change_percent_score
25% from volume_score
25% from value_score
This means price percentage change has the highest influence on the final score, while volume and transaction value are used as supporting signals.
After calculating the score, the data is sorted by trending_score from highest to lowest.
The notebook then adds three context columns:
briefing_context
briefing_items_count
project_note
The final result is stored in project_output.
This cell transforms raw trending stock data into a ranked stock analysis table enriched with morning briefing context.
Cell 5 — Visualisasi dan Export
top_n = 15
plot_df = project_output.head(top_n).copy()

plt.figure(figsize=(10, 6))
plt.barh(plot_df["ticker"].astype(str), plot_df["trending_score"])
plt.gca().invert_yaxis()
plt.xlabel("Trending Score")
plt.ylabel("Ticker")
plt.title(f"Top {top_n} Trending Stocks Based on Morning Briefing Context")
plt.tight_layout()
plt.show()


morning_flat.to_csv("idx_morning_briefing_flat.csv", index=False)
project_output.to_csv("idx_trending_stocks_analysis.csv", index=False)

with pd.ExcelWriter("idx_morning_trending_project.xlsx", engine="openpyxl") as writer:
    morning_df.to_excel(writer, sheet_name="morning_raw", index=False)
    morning_flat.to_excel(writer, sheet_name="morning_flat", index=False)
    trending_df.to_excel(writer, sheet_name="trending_raw", index=False)
    trending_clean.to_excel(writer, sheet_name="trending_clean", index=False)
    project_output.to_excel(writer, sheet_name="final_analysis", index=False)

print("Export selesai:")
print("- idx_morning_briefing_flat.csv")
print("- idx_trending_stocks_analysis.csv")
print("- idx_morning_trending_project.xlsx")
Explanation
This final cell handles visualization and export.
First, the notebook sets:
top_n = 15
This means only the top 15 rows from project_output will be visualized.
plot_df is created from the first 15 rows of project_output.
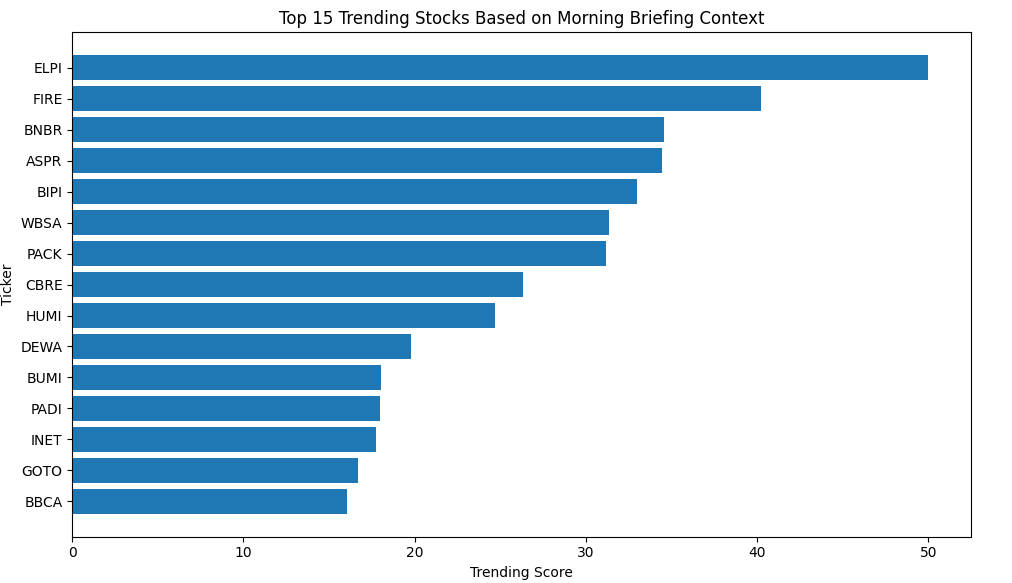
The notebook then creates a horizontal bar chart using matplotlib. The Y-axis shows the stock ticker, while the X-axis shows the trending_score.
The chart title is:
Top 15 Trending Stocks Based on Morning Briefing Context
This visualization helps users quickly identify the top trending stocks based on the scoring system created earlier.
After visualization, the notebook exports the data into CSV files.
morning_flat is exported as:
idx_morning_briefing_flat.csv
project_output is exported as:
idx_trending_stocks_analysis.csv
Then, the notebook creates an Excel file named:
idx_morning_trending_project.xlsx
The Excel file contains several sheets:
morning_raw
morning_flat
trending_raw
trending_clean
final_analysis
This export step is useful because the analysis result can be opened later in Excel or shared for reporting.
At the end, the notebook prints all exported filenames.
Result:
Conclusion
This notebook shows how to combine getMorningBriefing and getTrendingStocks into one practical IDX stock analysis workflow.
The process starts by setting up the API configuration, then creating helper functions to request data, normalize JSON responses, detect columns, flatten nested briefing data, and normalize numerical scores.
After that, the notebook retrieves data from two API endpoints. getMorningBriefing provides market context, while getTrendingStocks provides the list of stocks currently attracting attention.
The analysis section then cleans the trending stock data, detects important columns, calculates normalized scores, and creates a final trending_score. This score is based on price percentage change, volume, and transaction value.
Finally, the notebook visualizes the Top 15 trending stocks and exports the results into CSV and Excel files.
For traders, investors, or data enthusiasts, this notebook can be a useful starting point for building a simple IDX market dashboard. It does not produce a direct buy or sell recommendation, but it helps organize market data into a cleaner, more readable, and more actionable format.